Irrigation for frost protection of strawberries
Learn about types of frost, frost injury and how irrigation is used to protect strawberry plants from frost injury. This technical information is for Ontario strawberry producers.
ISSN 1198-712X, Published November 2022
Introduction
There is nothing colder than a strawberry field on a frosty spring night. Strawberry plants bravely bloom in early spring, often before the last frost. The blooms are close to the ground, and the ground, covered with straw, doesn’t provide much heat. That’s why many strawberry growers pull a few all-nighters each spring to run the irrigation system and use a thermodynamic principle to protect their crop from frost injury.
This fact sheet describes types of frost, frost injury and how irrigation is used to protect strawberry plants from frost injury.
Symptoms of frost injury
Frost occurs when the temperature around the plant drops below 0°C (32°F). At this temperature, pure water forms ice crystals on surfaces that have fallen below the freezing point of water.
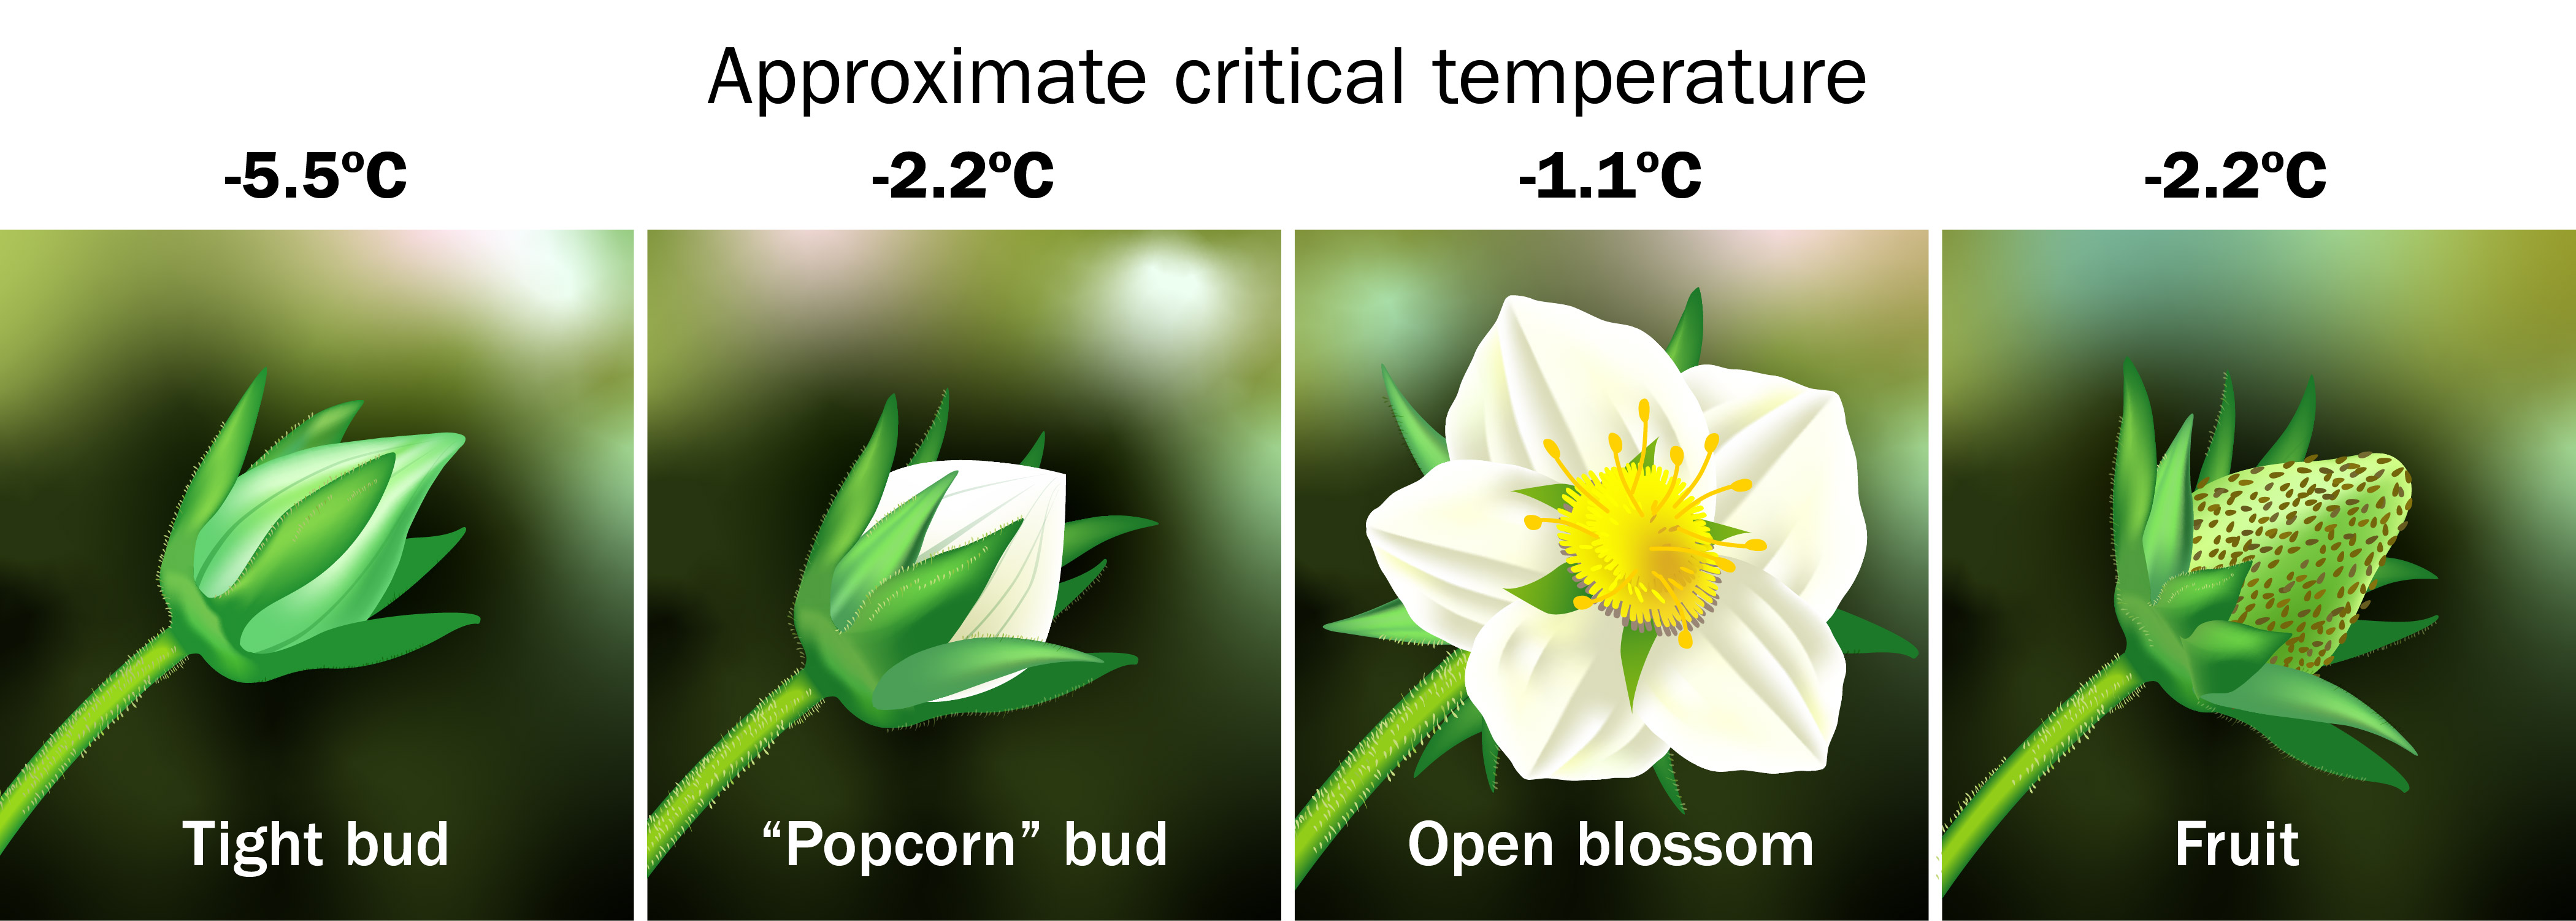
Plant sap is not pure water, therefore strawberries have a lower freezing point than 0°C (32°F). When the critical temperature (Figure 1) is reached, crystals form and damage cell membranes, allowing cell fluids to leak out.
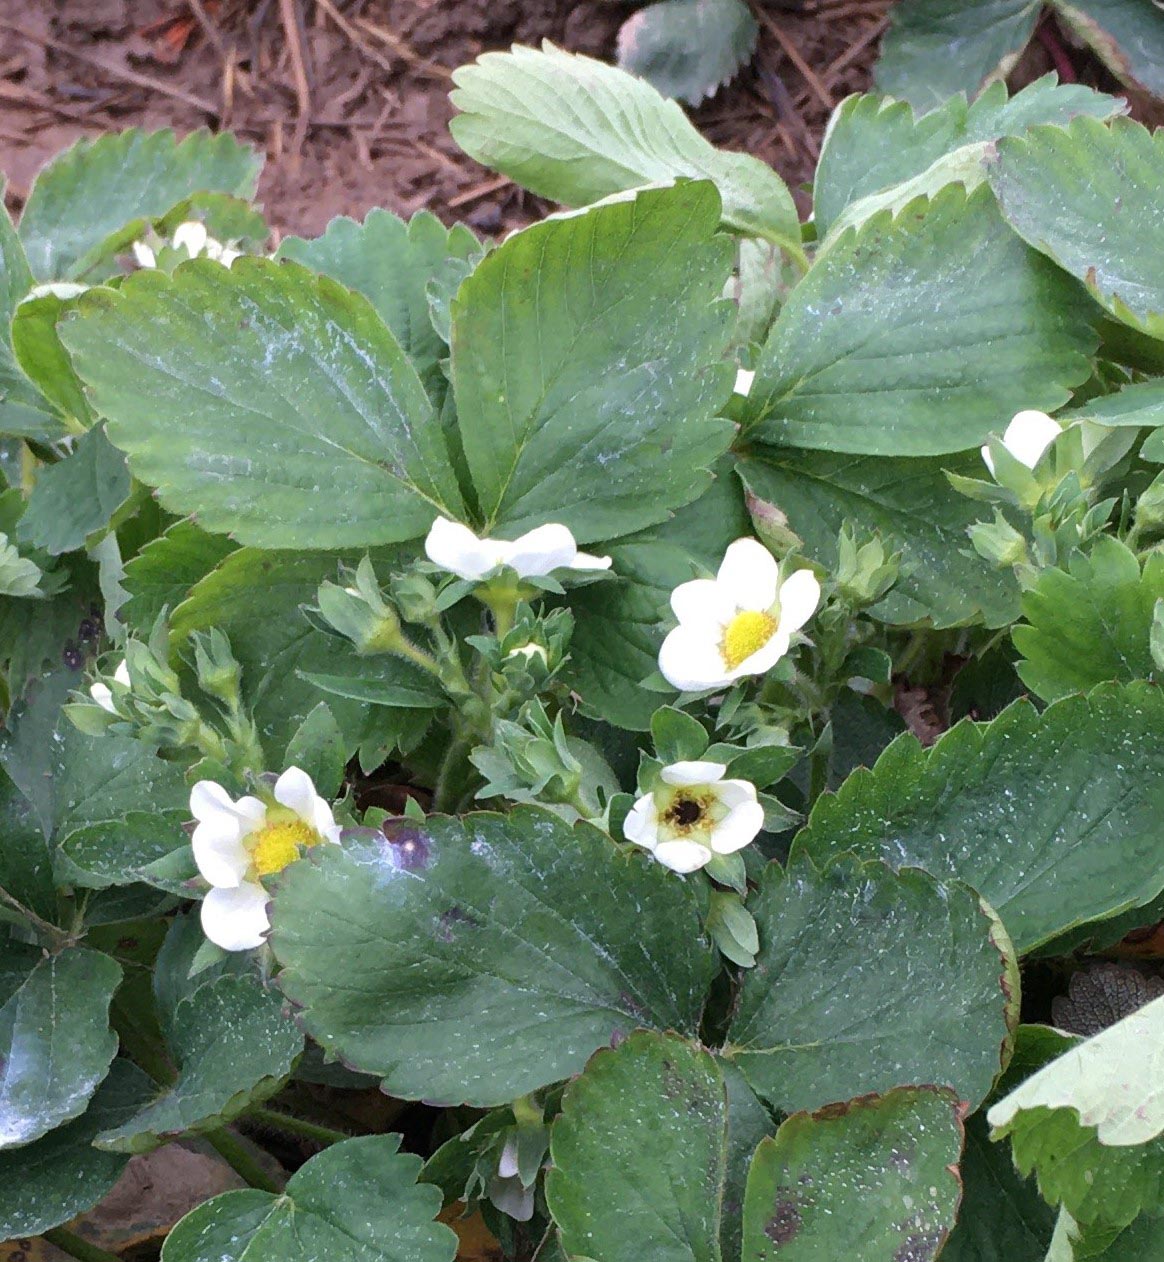
Frost can kill flowers outright or injure them enough to cause misshapen berries. When a flower is injured by cold, the pistils are killed first (Figure 2). The center of the bloom will turn black within a couple of hours to one day after the frost event.
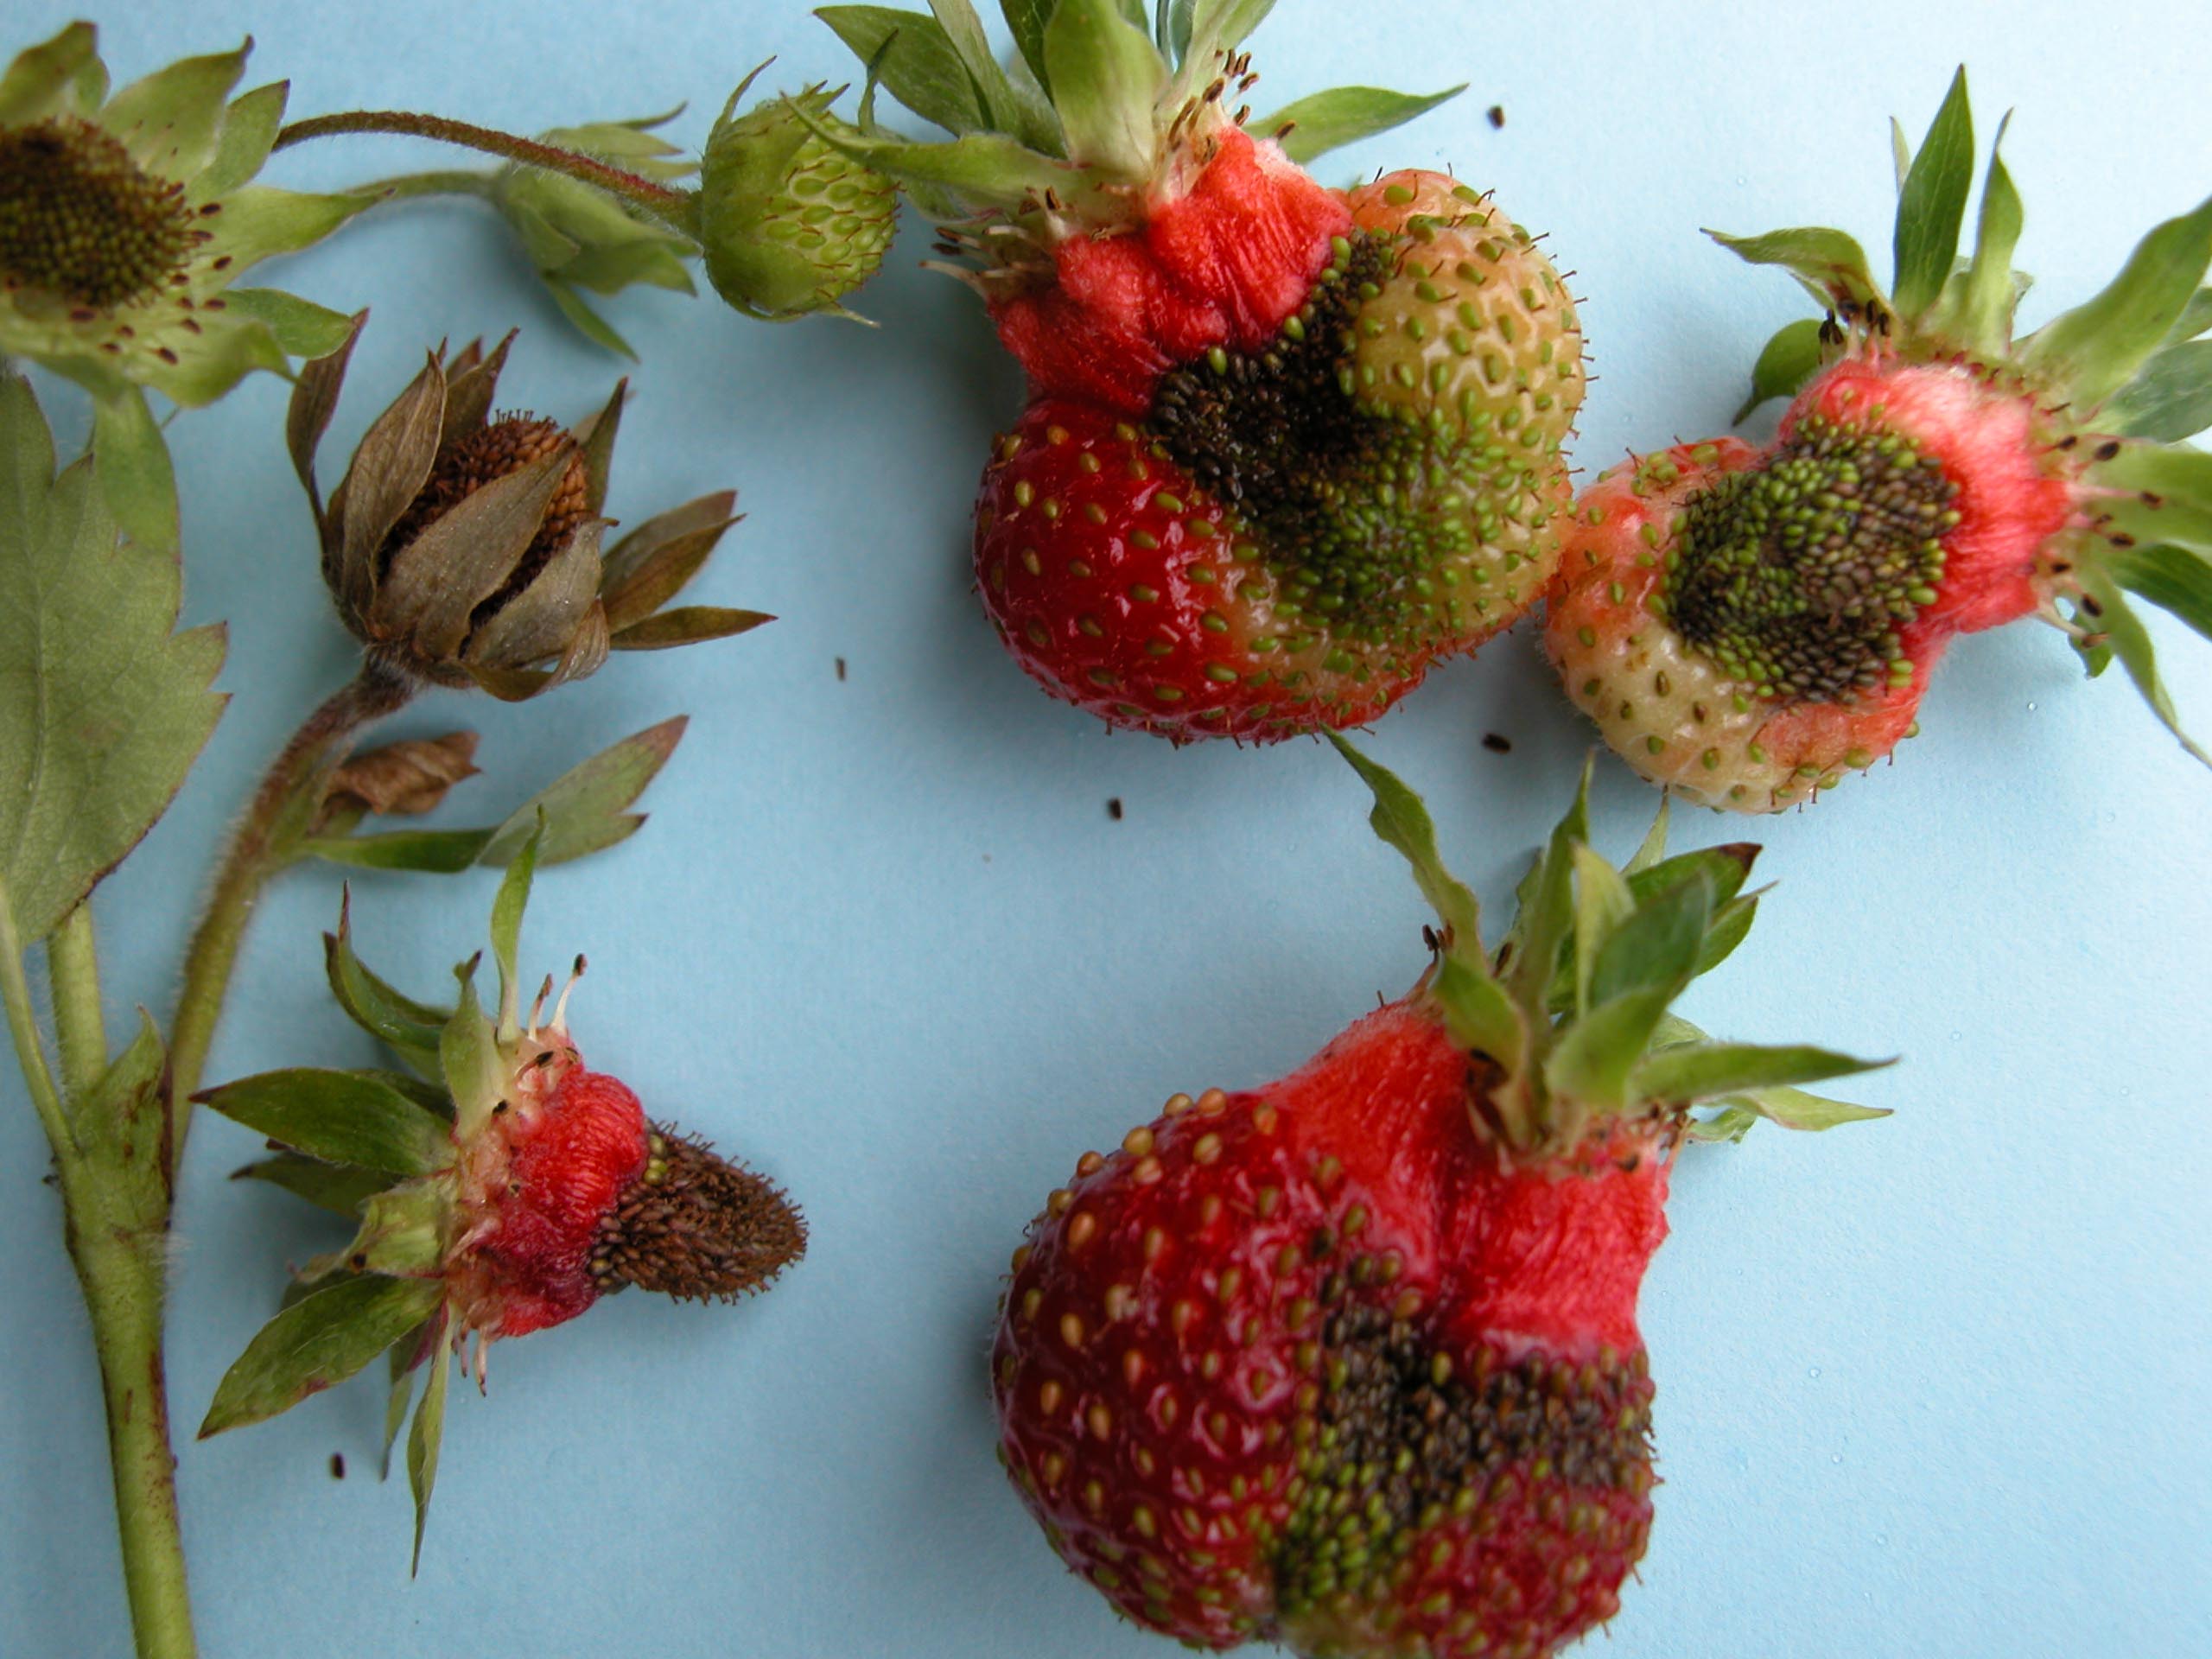
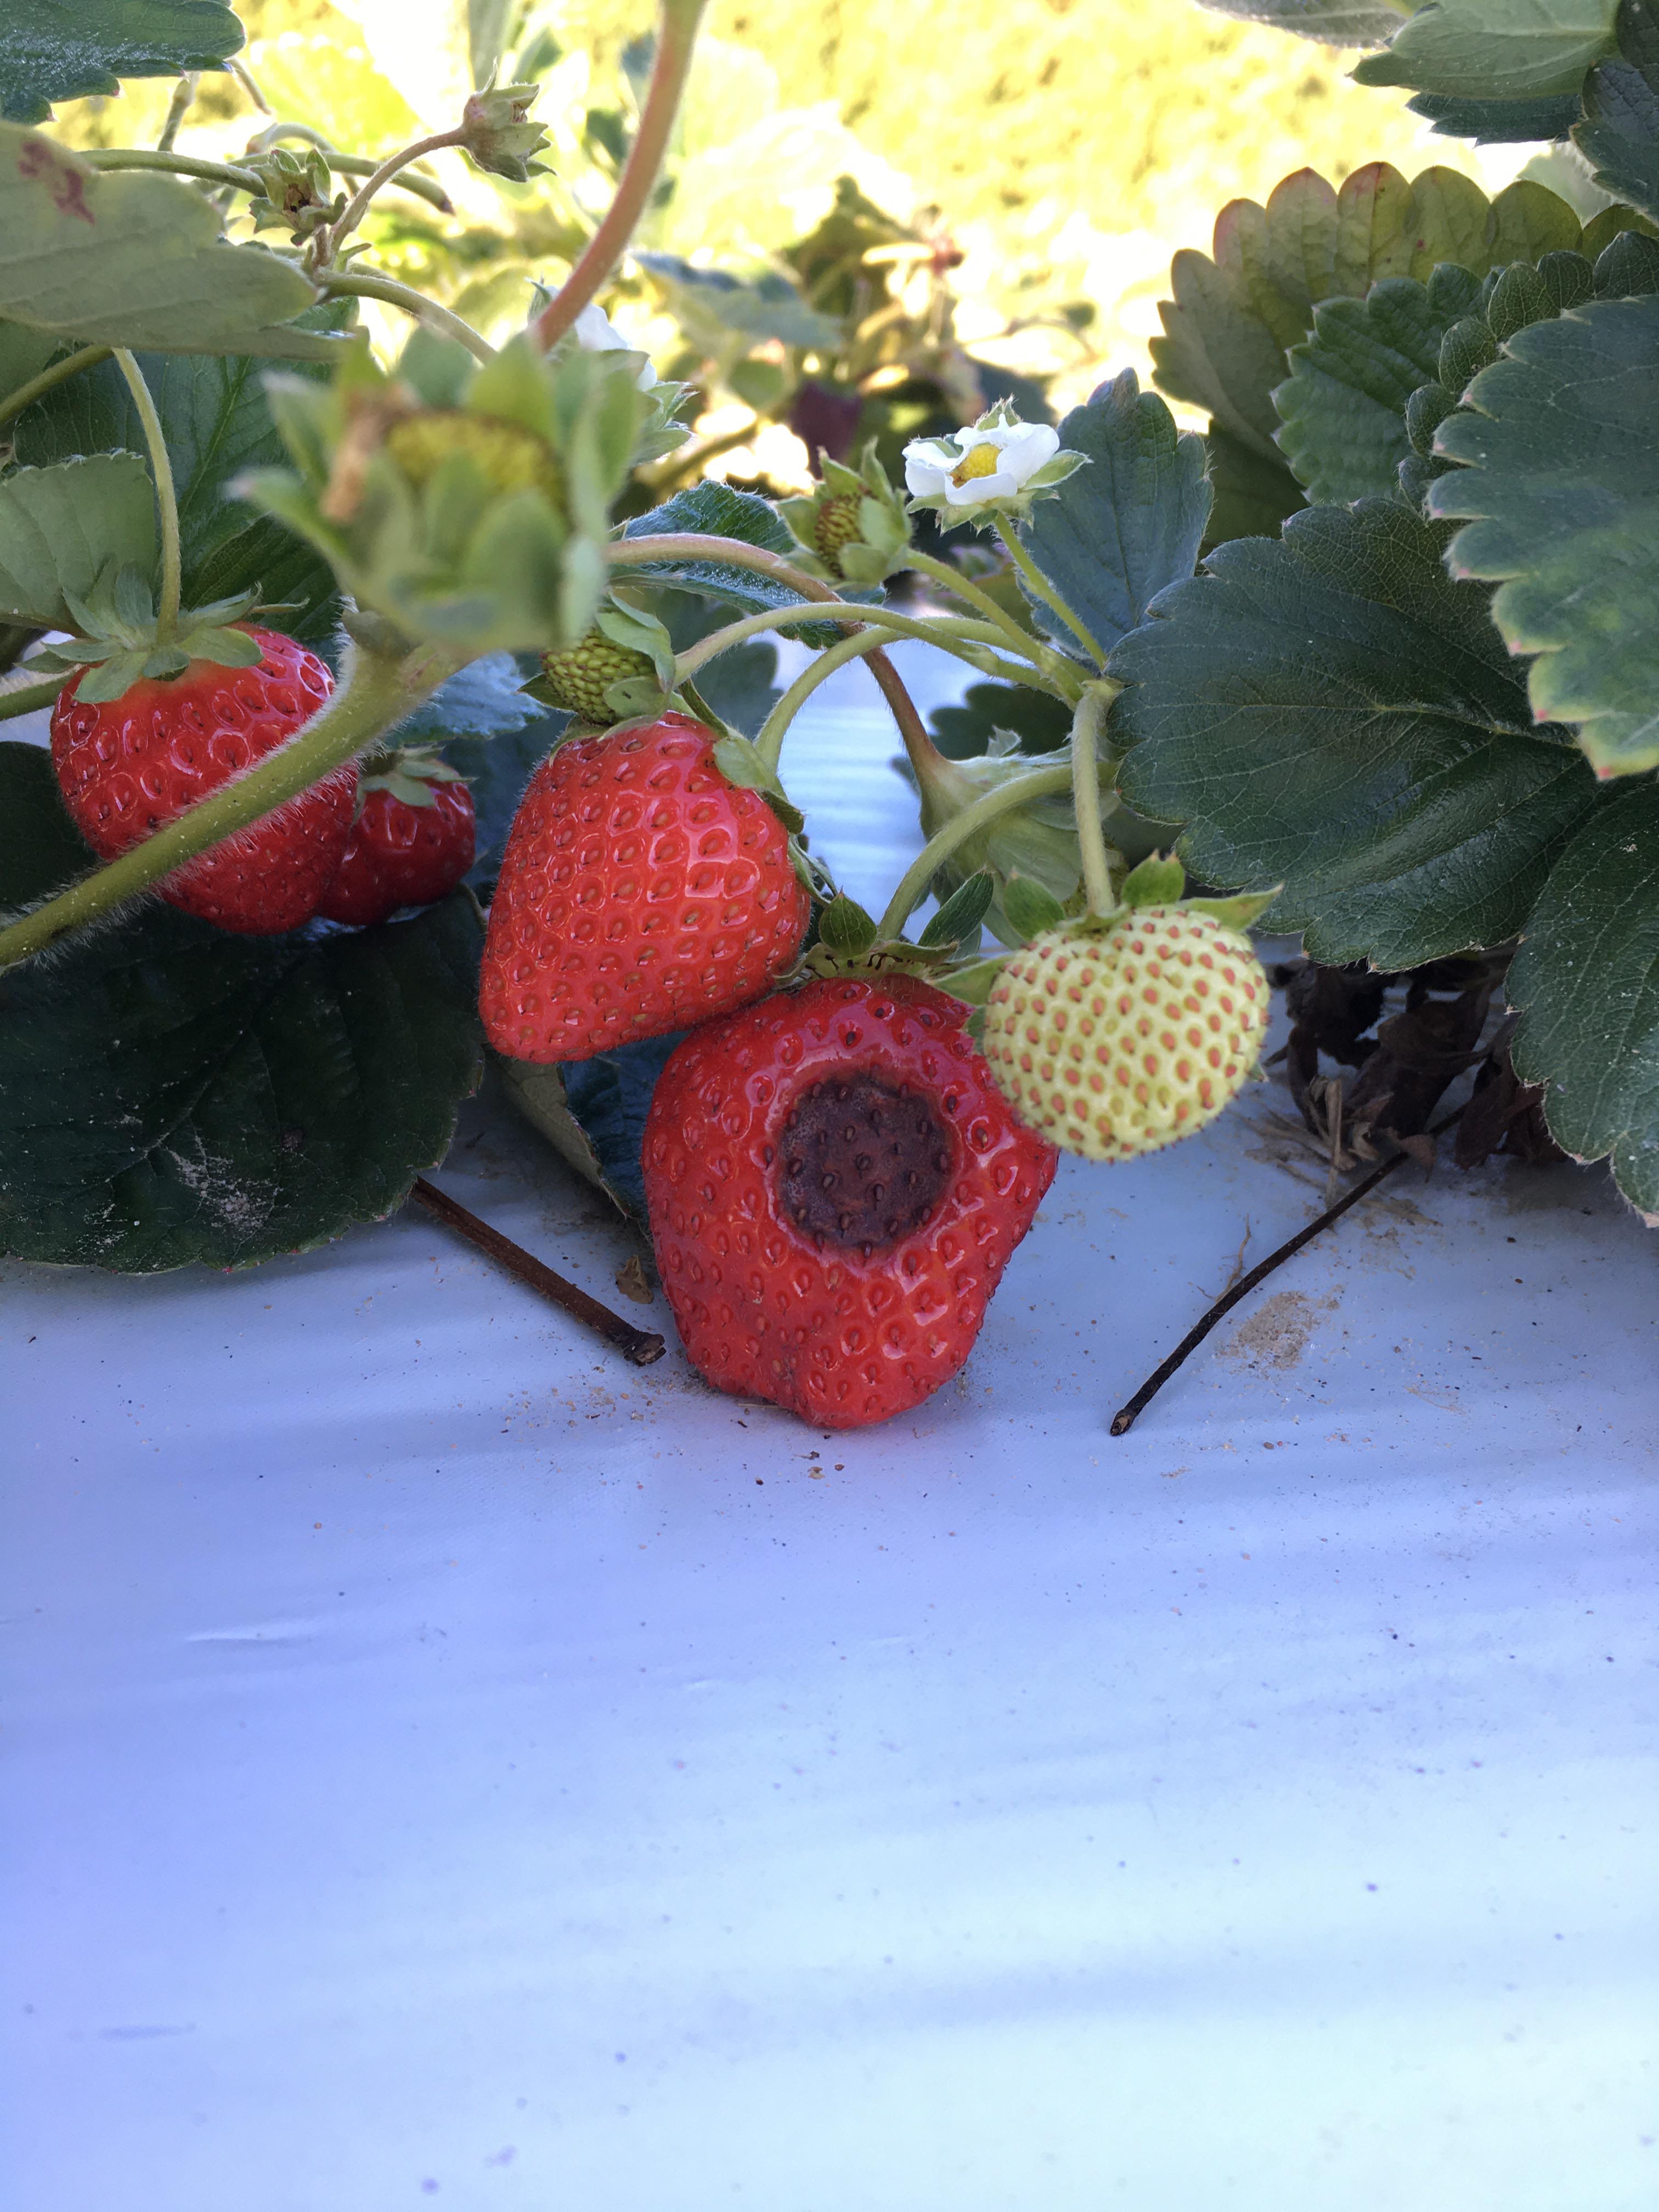
If pistils are killed before pollination, embryos do not develop. A seedy spot on the berry forms, with hollow seeds (Figure 3). Sometimes fruit cracks at the bottom.
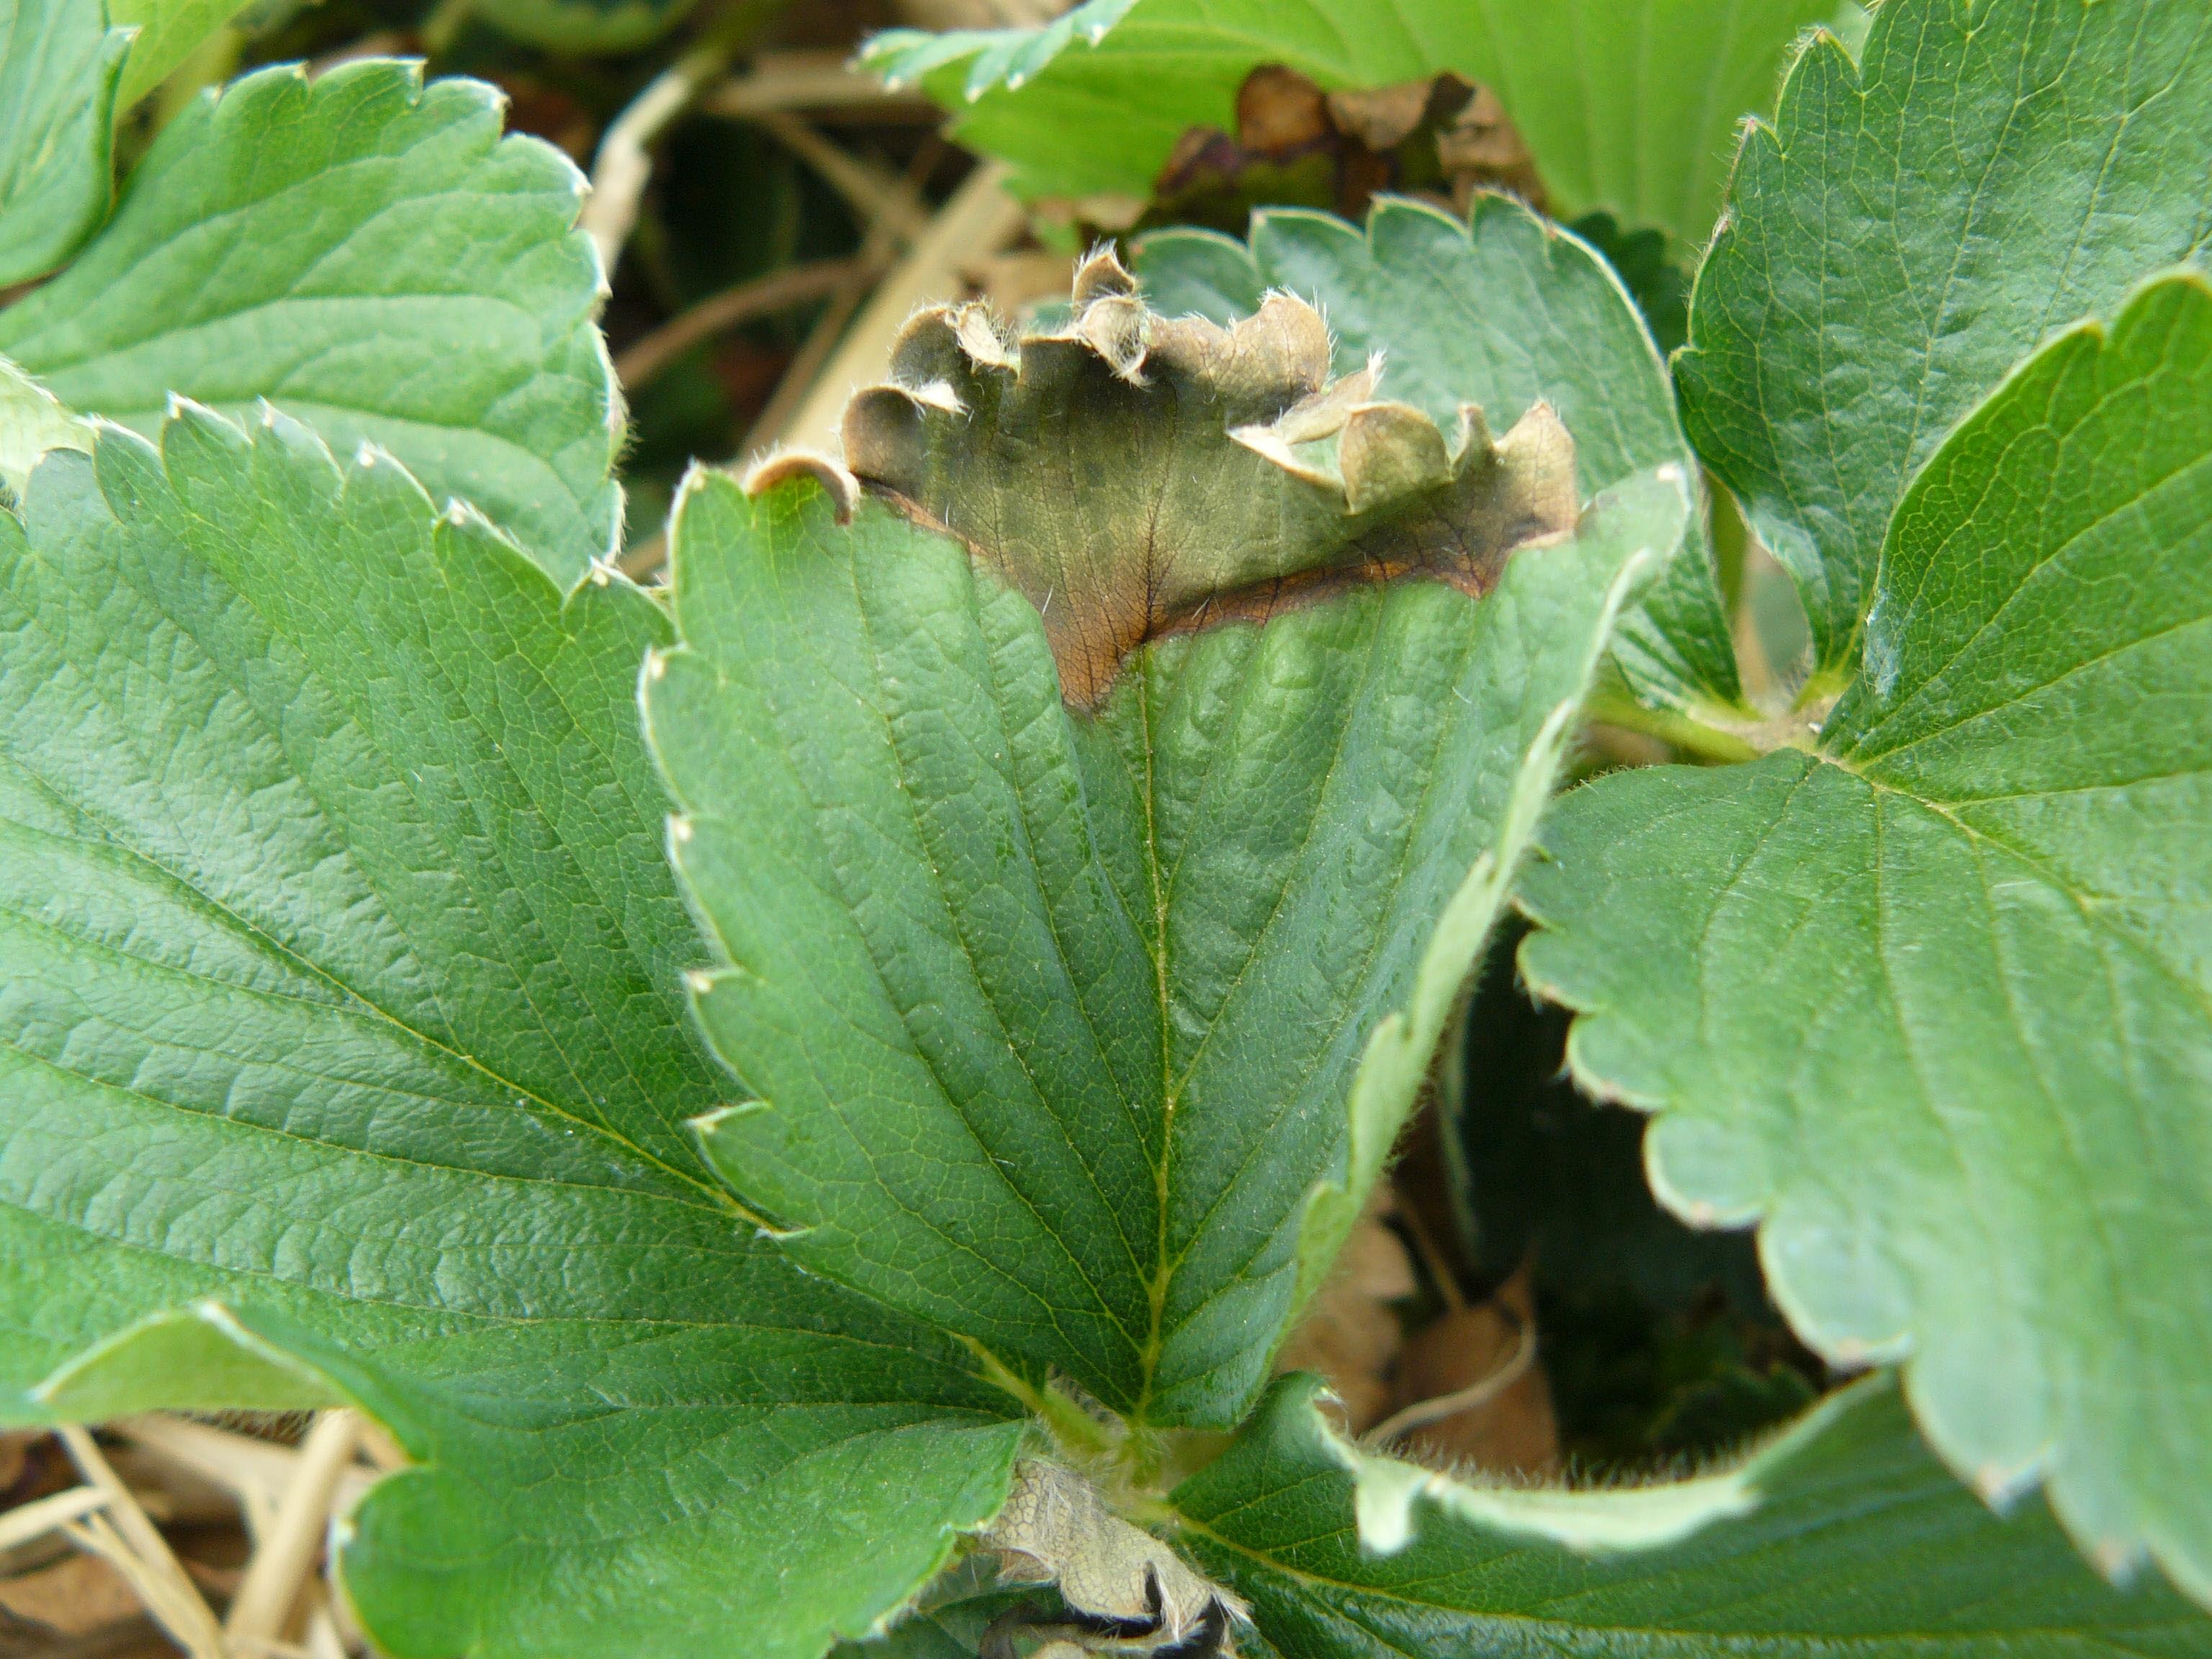
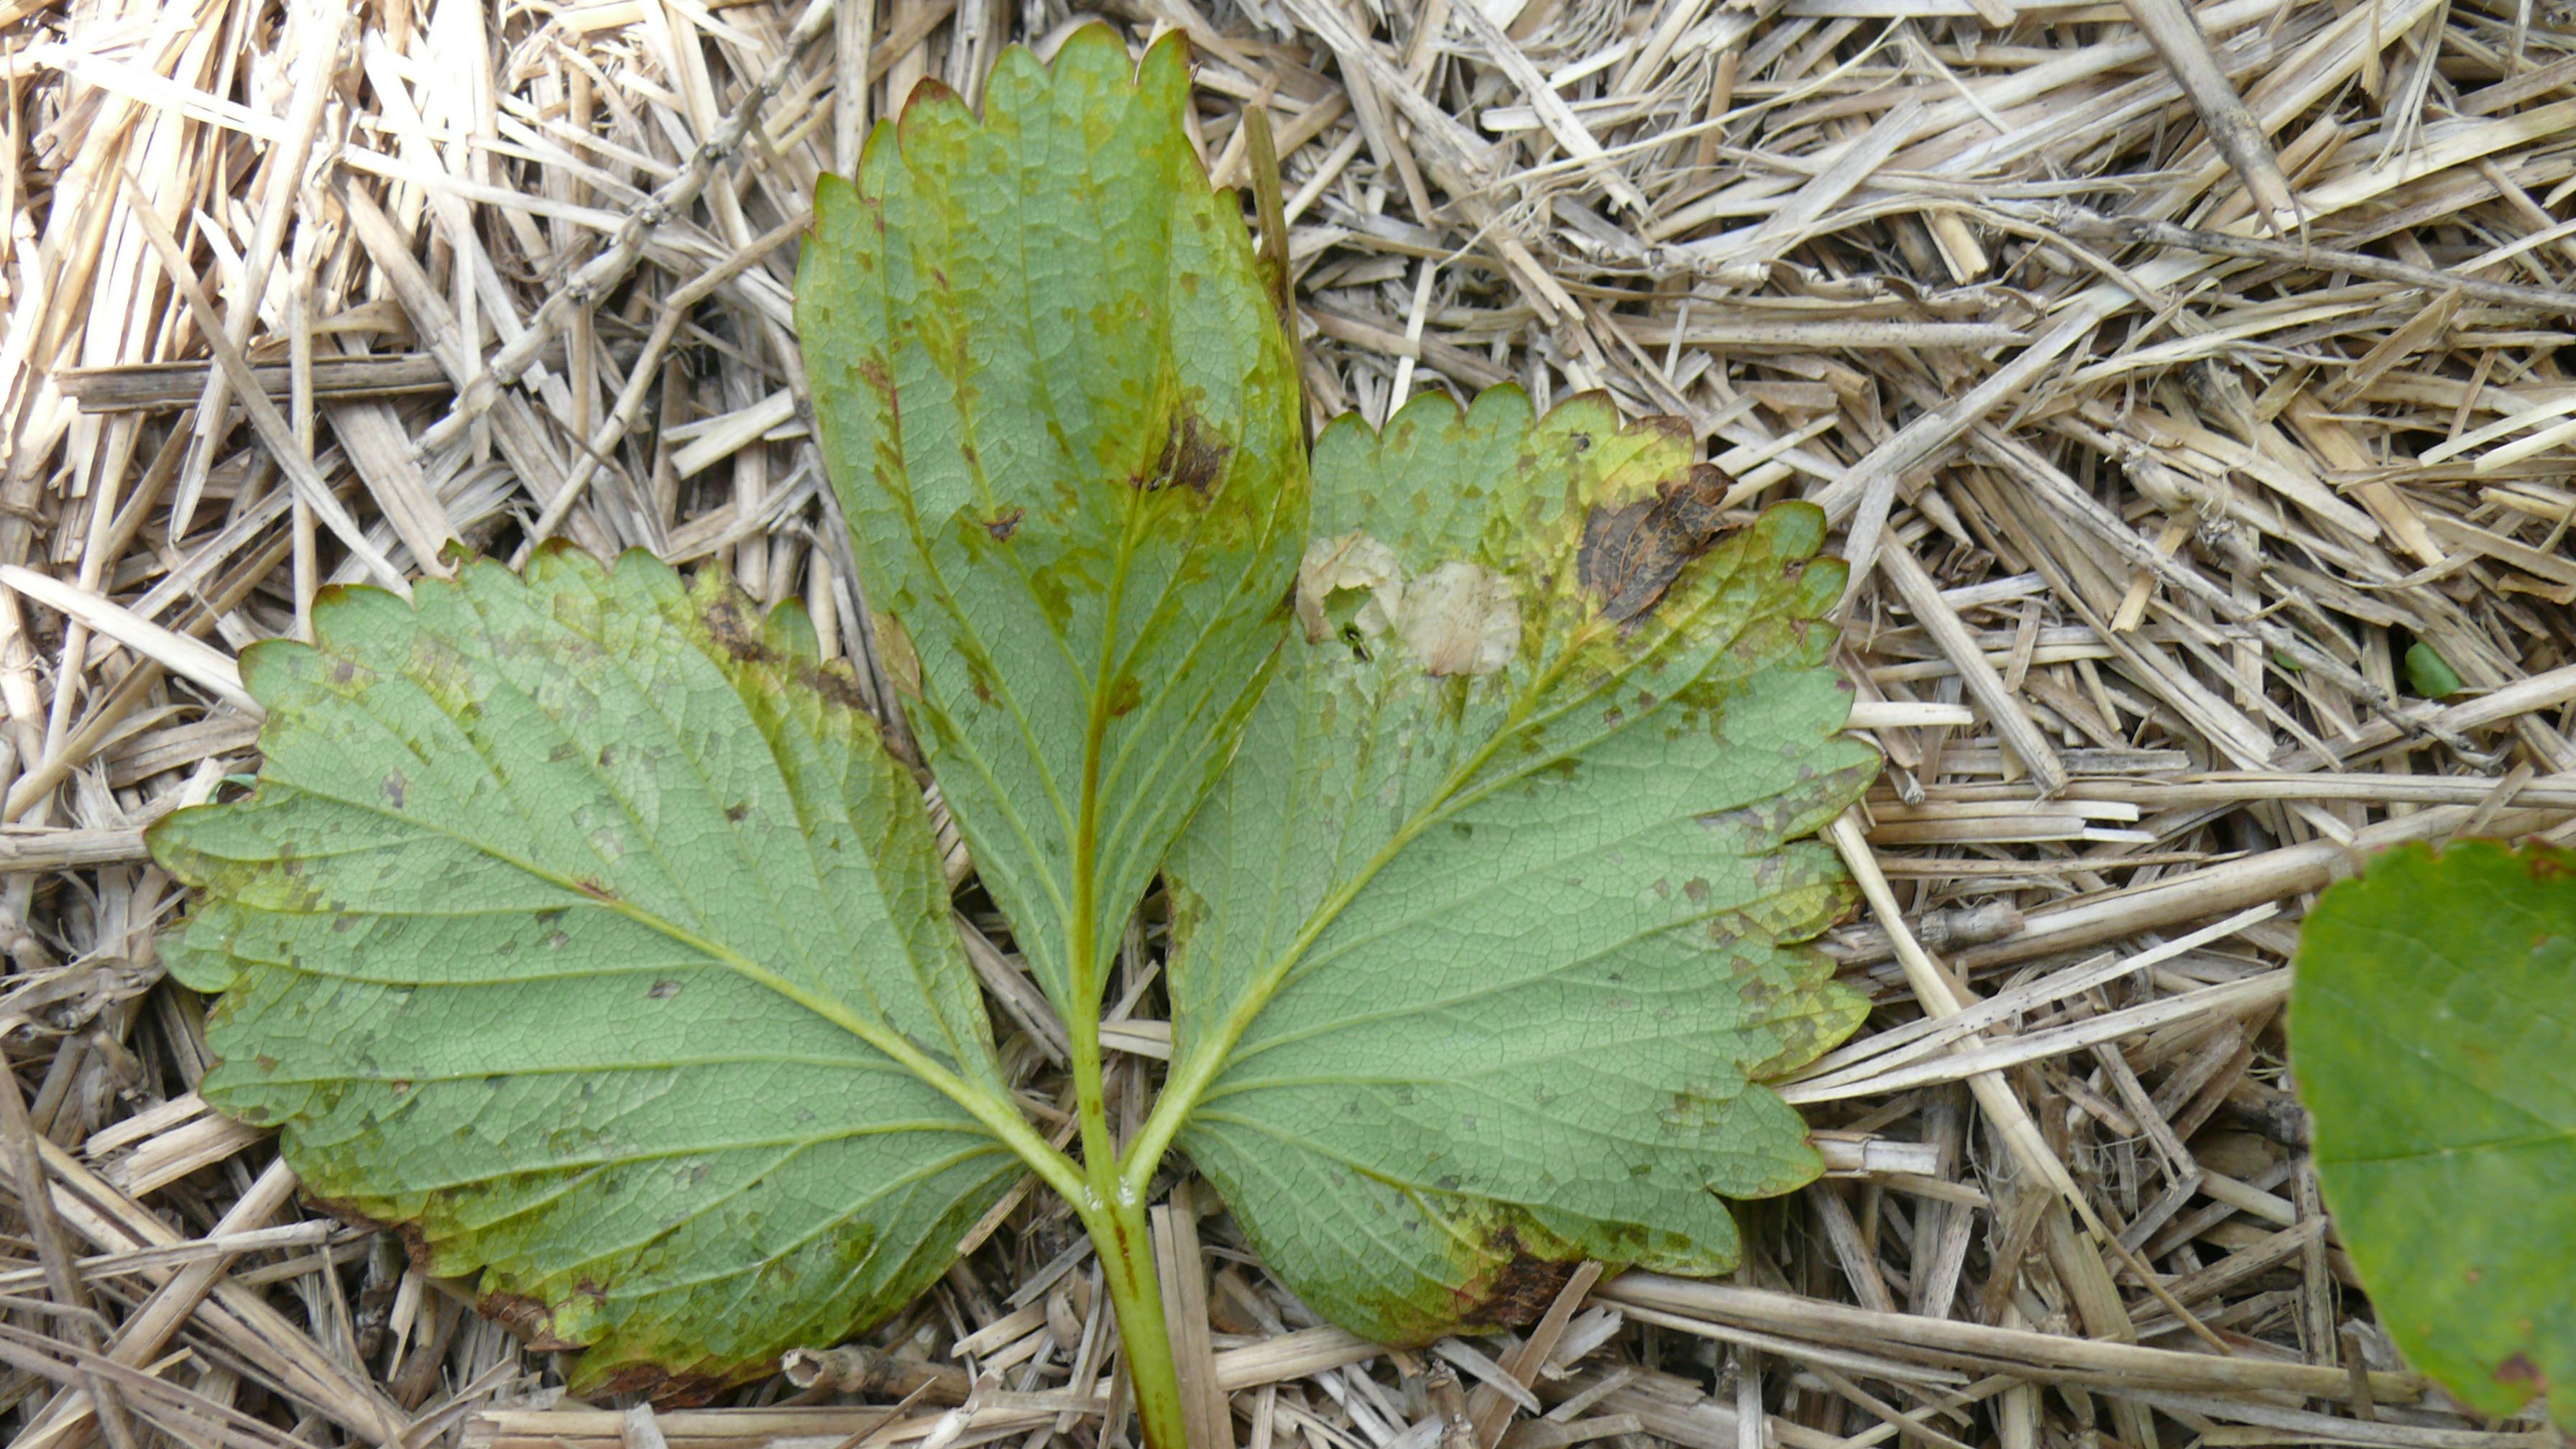
Leaves can also be injured by the frost, especially when they are growing vigorously and very tender. The edges or tips of leaves blacken and then dry out (Figure 4).
Frost usually damages the largest and earliest blooms. This represents the best and most lucrative part of the berry crop, because prices are highest at the beginning of the season. Also, the first flowers to open produce the largest fruit. If 5%–7% of the flowers are lost, and these flowers are mostly king bloom, the total crop will be reduced by 10%–15%.
Critical temperatures for frost injury
Bloom and flower parts are most susceptible to freezing temperatures (Figure 1).
These temperatures are tissue temperatures and are a degree or two lower than the critical air temperature in the plant canopy. There are many variables that affect the actual critical temperature for a given plant and the amount of injury:
- duration of cold temperatures
- growing conditions prior to the cold event
- cultivars (because of plant habit, or avoidance, rather than genetic differences)
- stage of development
- super cooling (in the absence of ice nucleation points, plant sap can cool below the freezing point without forming ice crystals)
- soil type and condition (moist dark soil holds more heat than dry light soil)
Understanding heat transfer
Cold conditions occur when heat is lost. Cold cannot be added, but heat can be removed (Figure 5).
Heat can be transferred by:
- conduction: the transfer of energy within an object or system. Metal, water and ice is a good conductor, but air is a poor conductor of heat.
- convection: the transfer of heat by movement and mixing of liquid or gas. Most air is warmed by convection.
- radiation: the transfer of energy through free space without a transporting medium. We receive energy from the sun by radiation. Objects on earth also radiate energy back to space.
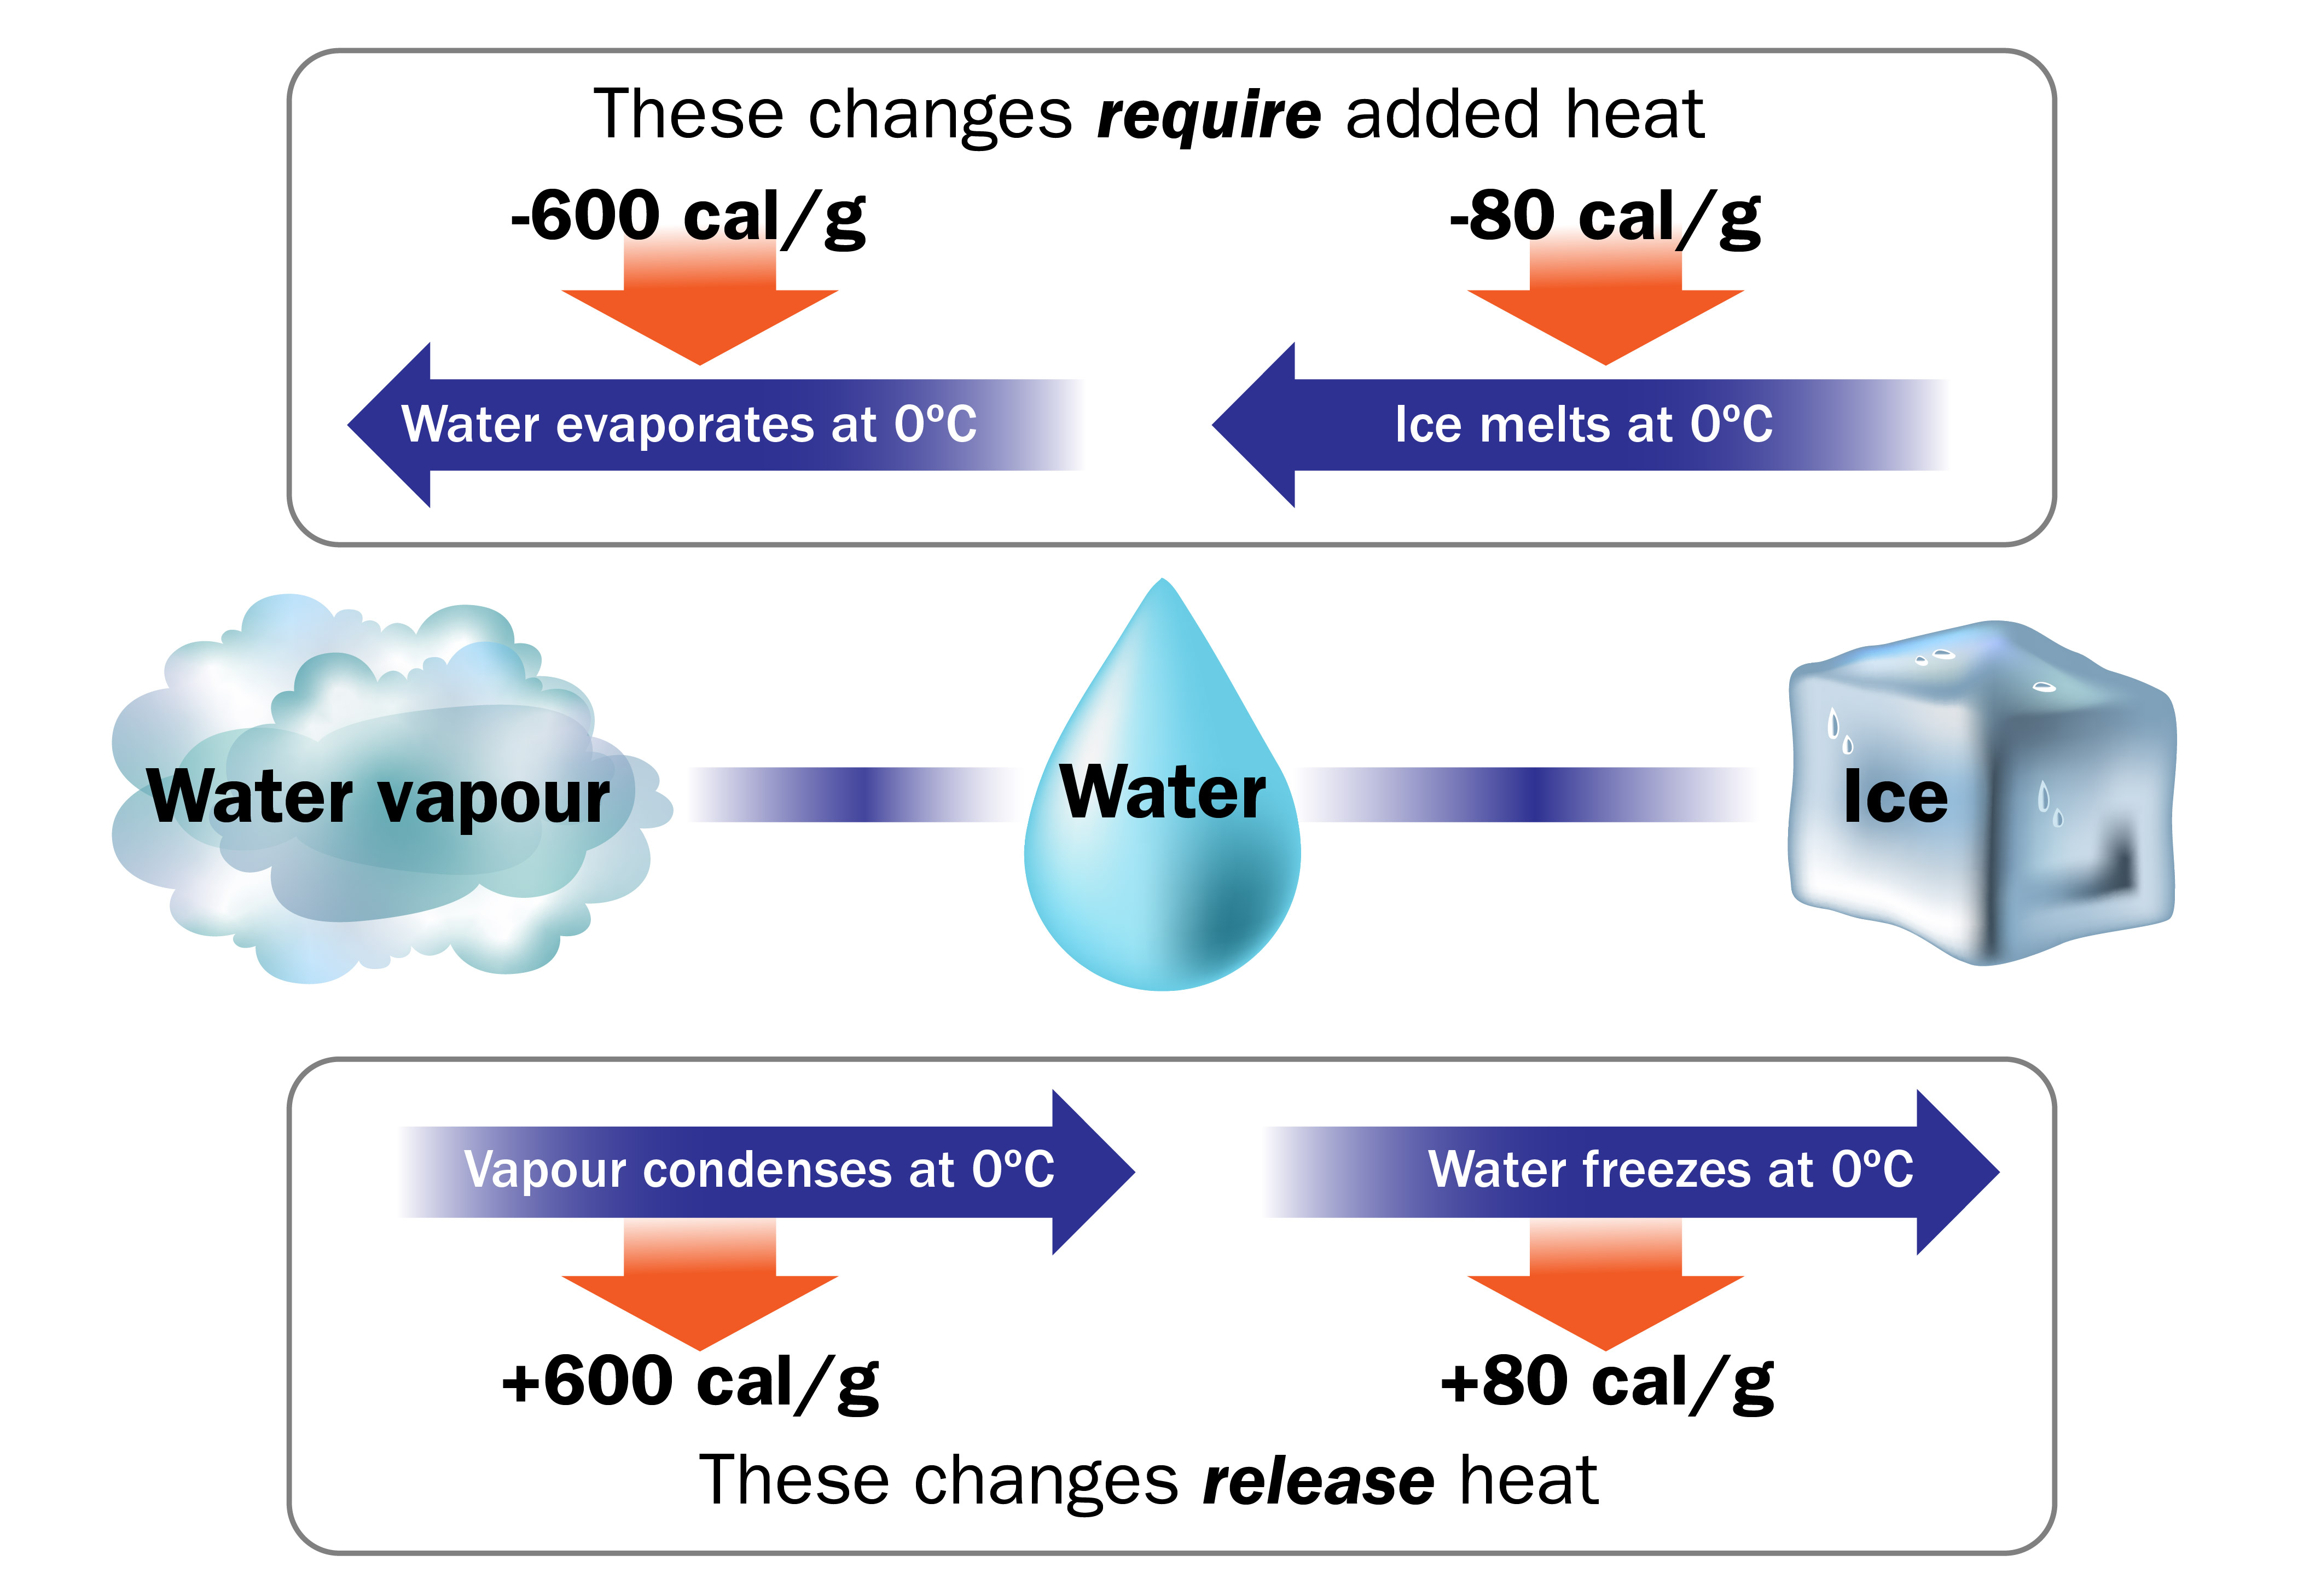
- changes in state: when water molecules change state, from gas to liquid, or liquid to ice, heat is released. This potential energy is called latent heat. It is not measured by a thermometer, until it is released by a change in state of the water.
When water condenses, cools or freezes, the temperature around the water rises as latent heat is released. Water changing to ice on the surface of a plant will add heat to that plant. Conversely, when ice melts, or water evaporates, the temperature around the water is cooled, as heat moves to the water. Water evaporating from the surface of a plant will draw heat from that plant.
Energy budgets
During the day, the sun warms the soil and other objects, such as crops. When these objects become warmer than the air, they pass heat to the air by conduction. This warm air is less dense and rises, and is replaced by cooler air from above. This mixing of air is how the lower atmosphere is warmed. Normally, air near the surface of the earth is warmer than the air above it. Crops also radiate heat to outer space. Some of this energy is reflected back to the earth by clouds and C02 in the atmosphere.
At night, there is no incoming radiation from the sun. If the atmosphere is clear, there is little heat reflected back to earth. The soil and crops continue to radiate energy out to space. Temperatures drop near the earth’s surface, forming a layer of air that is colder at the bottom and warmer at the top. If a wind or breeze is present, the warm air and cooler air are mixed. But on a still night, especially when the air is dry, the air temperature at ground level is coolest, and the temperature increases with height up to a certain level. Because this situation is the opposite of normal daytime conditions, the term inversion is used to describe these conditions.
Objects can radiate heat faster than the air around them. As a result, frost forms on the roof of a building or the hood of a car when air temperatures are still a degree or two above zero. Strawberry blooms radiate heat quite quickly on a clear night.
Important facts about weather
Although the terms “frost” and “freeze” are used interchangeably, they describe two distinct types of cold events (Table 1).
An advective, or wind-borne freeze, occurs when a cold air mass moves into the area and brings freezing temperatures. Significant wind occurs as the cold front moves in. The cold air layer is 150–1,500 m deep. It is difficult to protect crops from frost injury when these conditions occur.
A radiation frost occurs when a clear sky and calm winds allow an inversion to develop and the temperature near the surface of the earth drops below freezing. The cold air inversion is 10–60 m deep (with warm air above).
| Characteristic | Advective freeze | Radiation frost |
|---|---|---|
| Winds | Winds (above 8 km/hr) | Calm winds (less than 8 km/hr) |
| Skies | Clouds may exist | Clear skies |
| Cold air depth | 150–1,500 m | 10–60 m |
| Inversion | No | Yes: air next to the ground is cooler than air above it. |
| Cold air drainage | No | Yes |
| Frost protection | Difficult | Successful frost protection likely |
Microclimate monitoring
Air temperatures referred to in weather reports and forecasts are measured 1.5 m (5 ft) above the ground. Temperatures can be much colder at ground level and even colder in the low parts of the field. Cloud cover and wind speeds are also important factors to consider when determining the risk of frost.
Use max/min thermometers to monitor the low temperatures in your fields. Compare these to the forecast lows. In cloudy breezy weather, forecast lows are likely similar to the observed low in a region. On clear calm nights, especially in a strawberry field, the observed low can be much lower than the forecasted low.
Use max/min thermometers to compare the temperatures at several locations on your farm on a given night. After several observations you will know just how much colder each field is compared to your backyard. Install a frost alarm in a convenient location if you know how much colder it gets in the field.
Factors affecting the risk of frost
Cold air is heavier than warm air, and it sinks and flows across a field like water. It also piles up where obstructions block its flow to a lower area. Road banks, hedge rows and berms are examples of obstructions to cold air flow. Cold air will drain from elevated areas to lower storage areas, such as a large body of water. Strawberry fields on sloping fields, or in generally elevated areas, are less prone to frost damage. Be aware of frost pockets within the field.
Remove obstructions at the lower end of the field to improve air drainage. Design windbreaks to slow the wind, but not block all air movement. For air drainage through a windbreak, about 50% air space at the bottom of the windbreak is recommended.
Soil moisture and compaction can have a significant effect on temperature. A moist, compact soil will store more heat than a loose dry soil and, therefore, has more heat to transfer to the crop at night. Cultivation just before a frost can increase the risk of plant injury because the soil is looser and drier after cultivation. Soil under a grassy cover crop will hold more heat if the grass is mowed short.
Irrigation for frost protection
Most growers rely on sprinkler irrigation systems to apply frost protection. When water from sprinklers turns to ice, the heat released protects the plant from injury. As long as a thin layer of water is present, on the bloom or on the ice, the blossom is protected. This is important since it is not the layer of ice that provides the protection, it is the water constantly freezing that keeps the temperature above the critical point.
System specifications
Sprinkler systems should have the following:
- the capacity to irrigate the whole field at one time
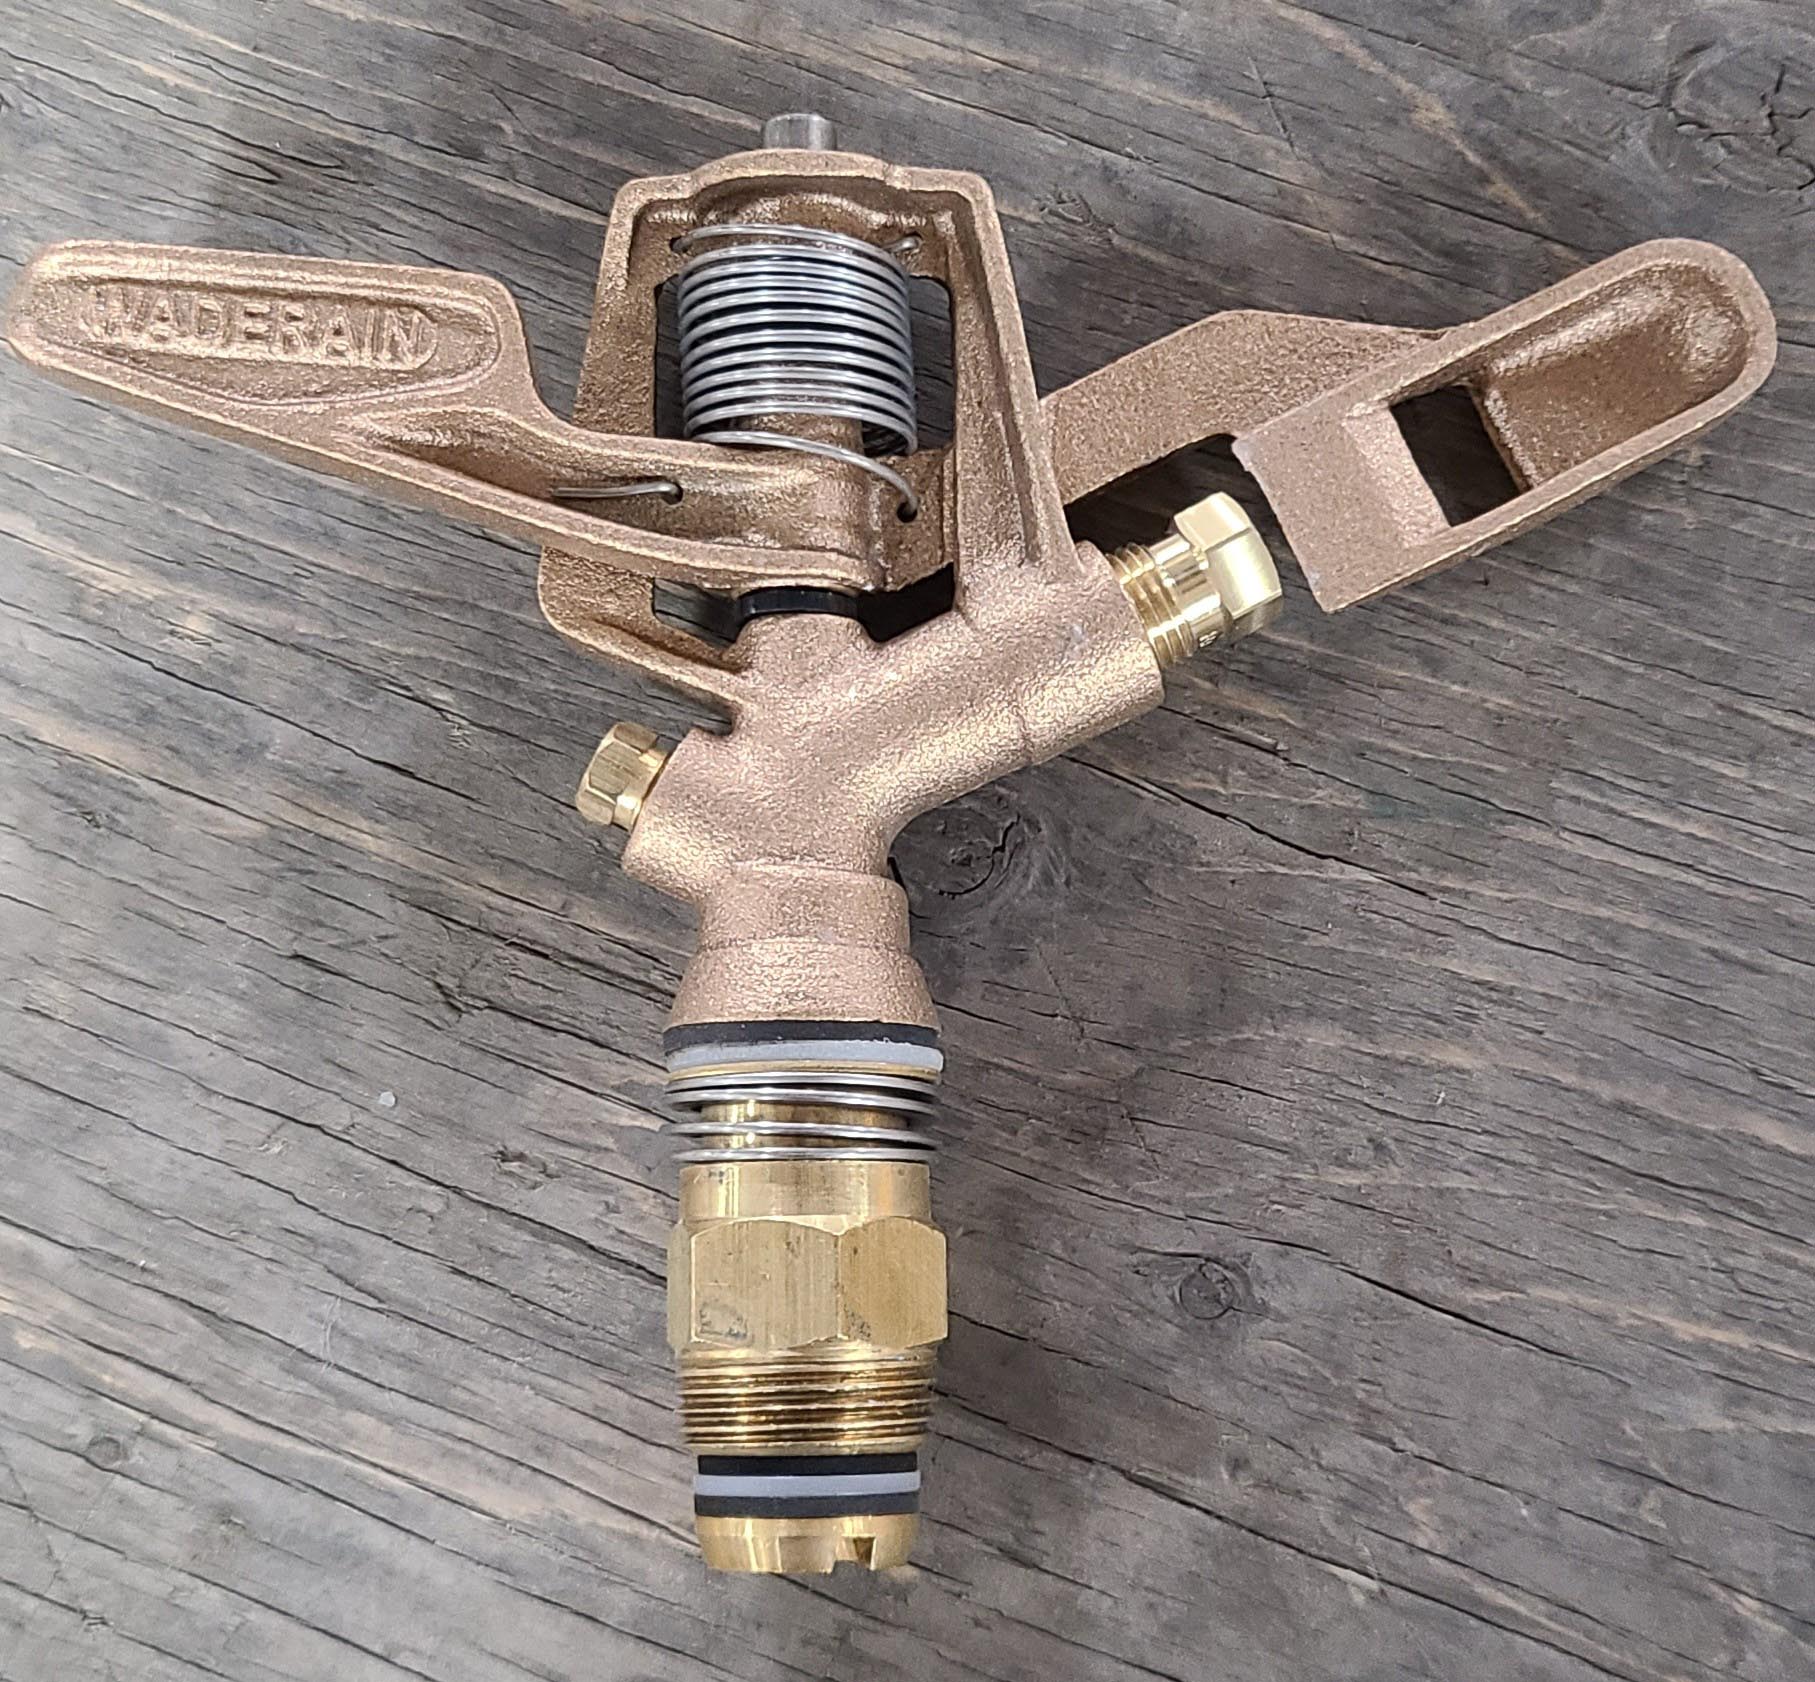
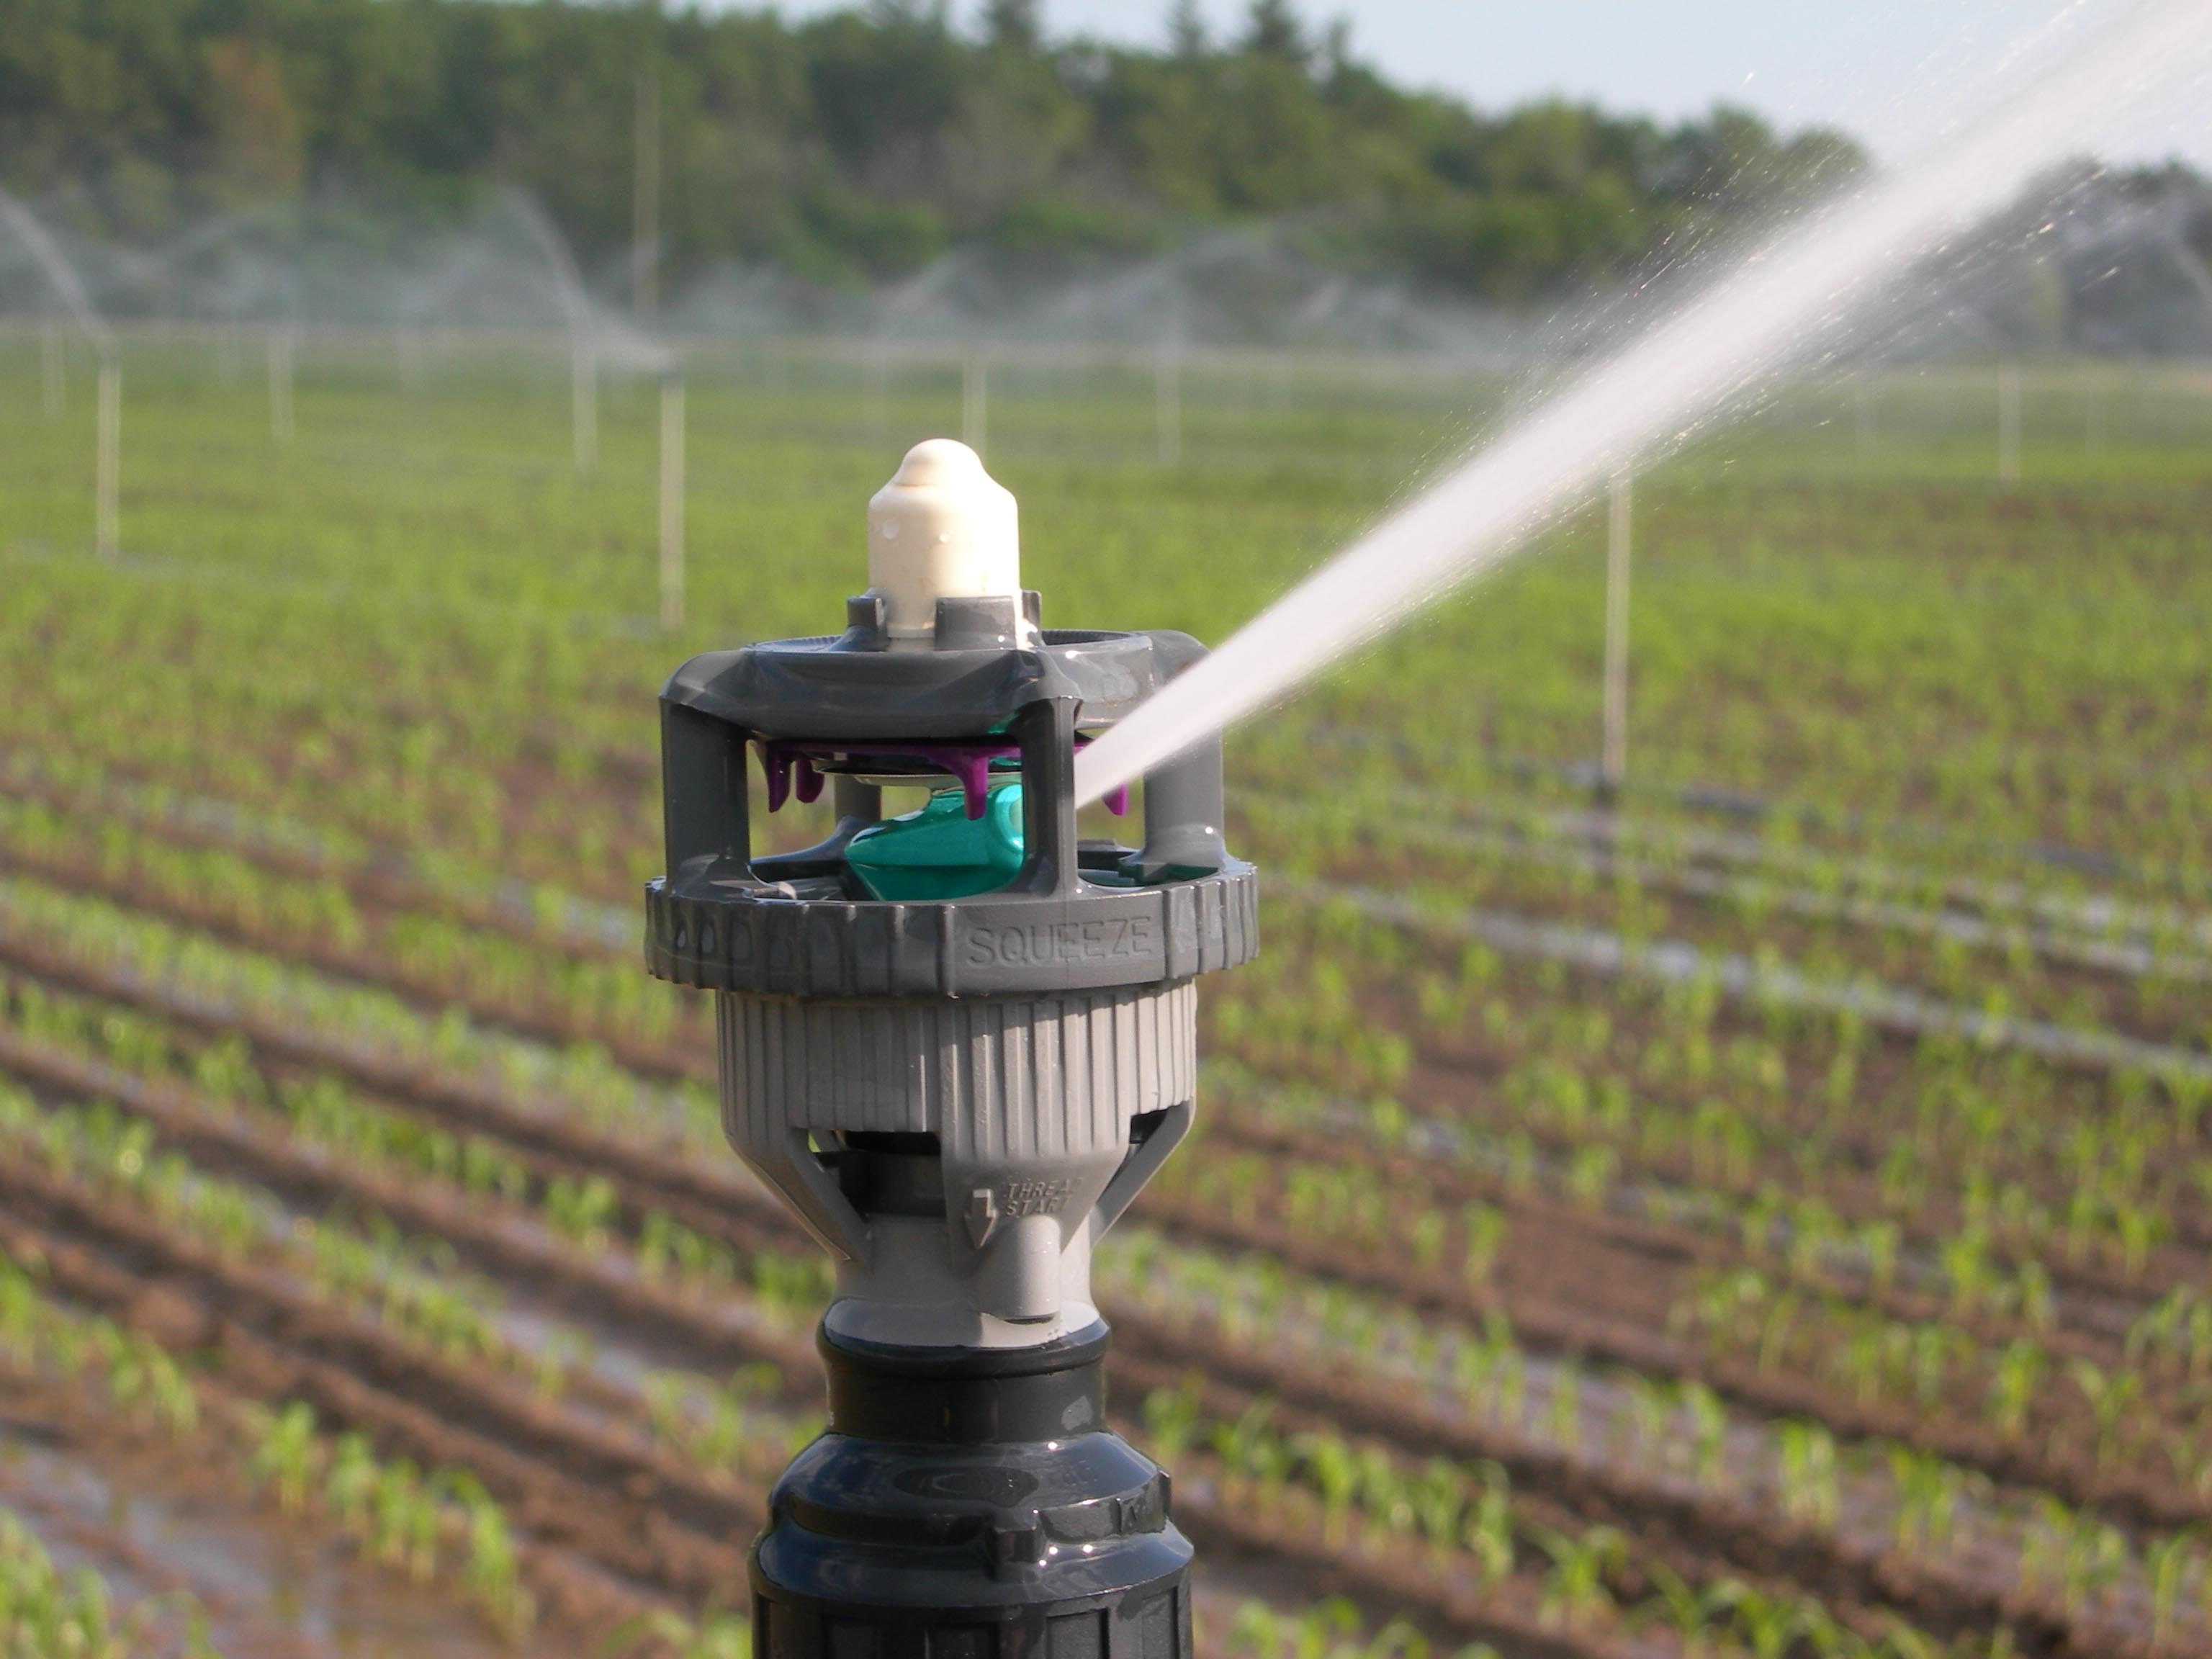
- sprinkler heads designed for frost protection that have low output nozzles. For metal nozzles, the spring is covered to prevent freeze-up and the back nozzle should be plugged (Figure 6). Plastic rotator nozzles can also be used (Figure 7).
- a rapid sprinkler rotation of at least one revolution per minute
- spacing of risers not exceeding 30%–60% (depending on wind conditions) of the area wetted by each sprinkler. Generally, an off-set pattern provides more uniform coverage than a square or rectangle, but this really depends on the nozzle and sprinkler you are using. Irrigation supply specialists can help design your system.
- traditional spacing is 18 m × 18 m (60 ft × 60 ft), not as many sprinklers required, but it takes longer for sprinklers to cover area. In areas where many advective freezes occur, with winds, a spacing of 9 m × 9 m (30 ft × 30 ft) is recommended.
- plastic rotator nozzle systems (typically designed starting with a tighter spacing, such as 12 m × 15 m (40 ft × 50 ft).
- enough water to irrigate for several nights in a row
For example: For 0.4 ha (1 acre), you need about 225 L/min (60 US gpm), to irrigate 3 mm/hr (⅛ in./hr). This is 13,600 L/hr (3,600 US gal/hr). If irrigation is required for 10 hours, you need 136,000 L per night (36,000 gallons). Plan to irrigate for several nights in a row.
How much water to apply
The amount of water applied per hour is based on the amount of wind and the temperature (Table 2). Higher water application rates are required on windy nights, or when humidity is low, because considerably more energy is removed when a gram of water evaporates than is added when a gram of water freezes (Table 2). A rate of 2.5 mm/hr (0.1 in./hr) is considered adequate to protect to −4.4°C (24°F) with no wind.
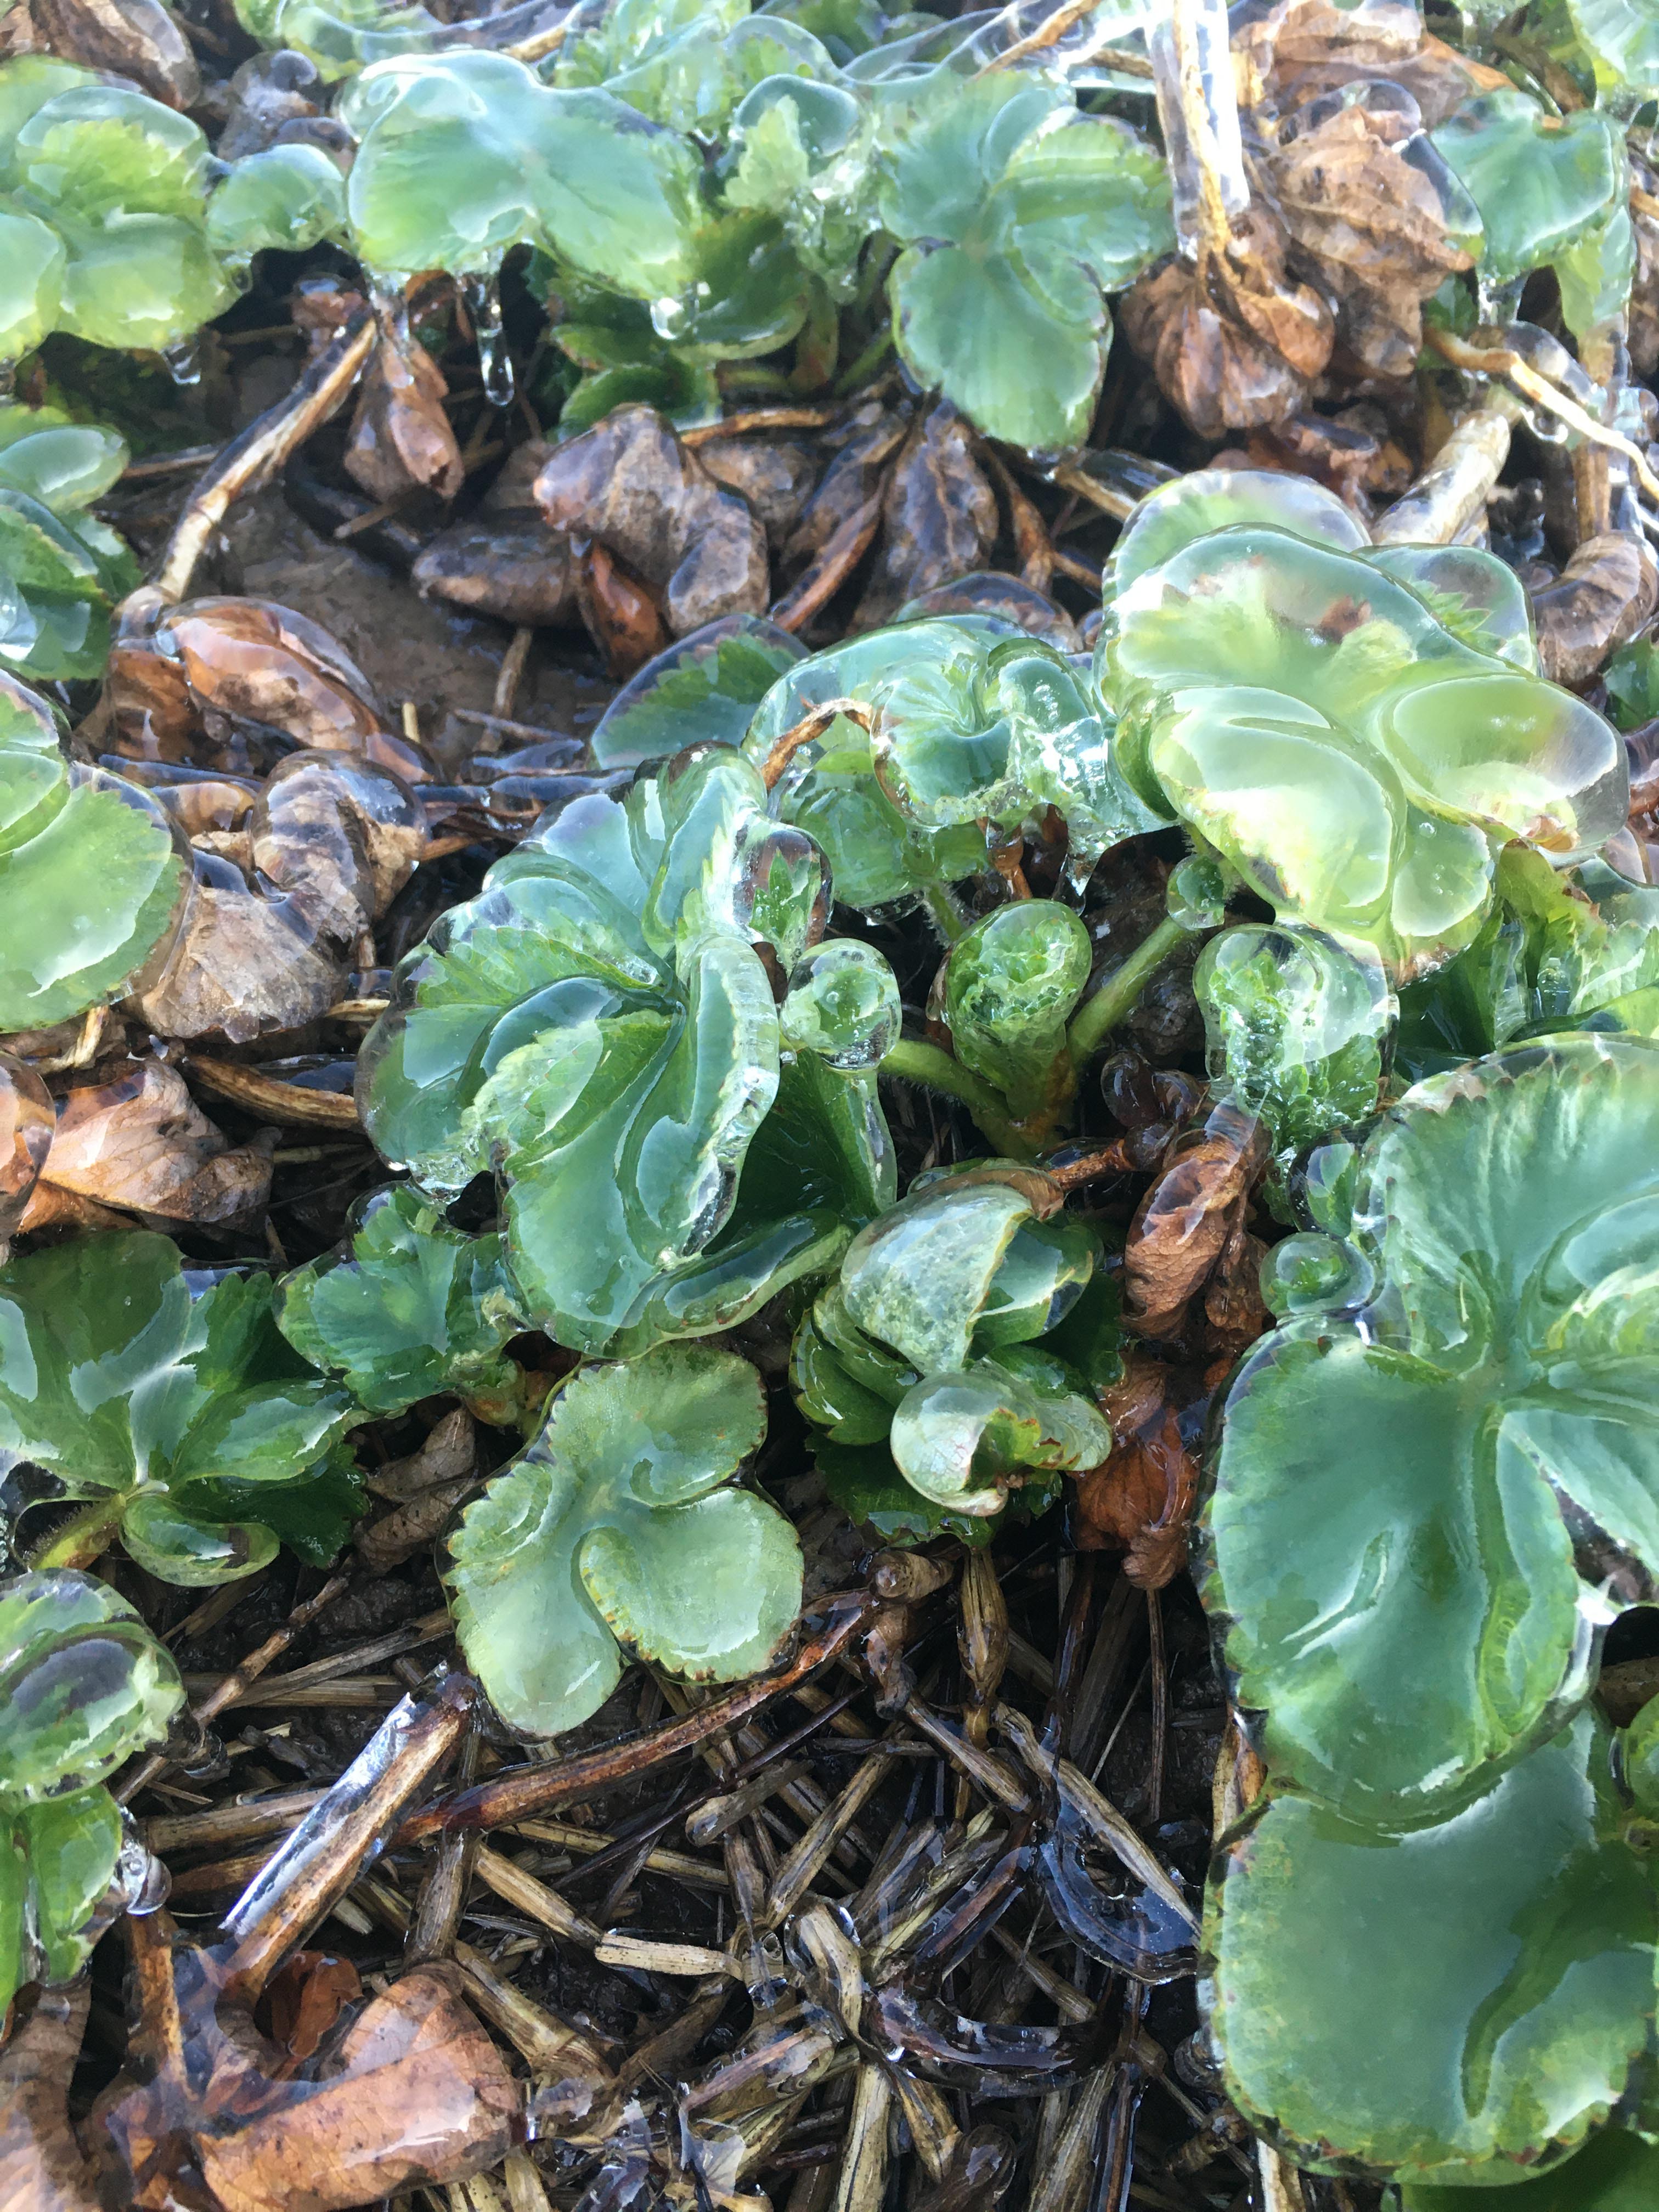
When the water is frozen on the plant, the ice should be clear (Figure 8), which indicates that there was enough water applied. If the ice is cloudy or milky white, the water application rate is not fast enough to protect the flower. In this case, increase the water application rate by reducing the sprinkler spacing or changing to higher flow-rate nozzles. At wind speeds above 16 km/hr or at temperatures below −6.7°C (20°F), sprinkler irrigation can do more harm than good because of rapid freezing.
| Wind speed at crop height | Air temperature at canopy −2.8°C (27°F) |
Air temperature at canopy −4.4°C (24°F) |
Air temperature at canopy −6.7°C (20°F) |
Air temperature at canopy −7.8°C (18°F) |
|---|---|---|---|---|
| 0–2 km/hr | 2.5 mm/hr (0.10 in./hr) | 2.5 mm/hr (0.10 in./hr) | 4 mm/hr (0.16 in./hr) | 5 mm/hr (0.20 in./hr) |
| 3–6 km/hr | 2.5 mm/hr (0.10 in./hr) | 4 mm/hr (0.16 in./hr) | 7.5 mm/hr (0.30 in./hr) | 10 mm/hr (0.40 in./hr) |
| 7–14 km/hr | 2.5 mm/hr (0.10 in./hr) | 7.5 mm/hr (0.30 in./hr) | 15 mm/hr (0.60 in./hr) | 18 mm/hr (0.70 in./hr) |
| 15–19 km/hr | 2.5 mm/hr (0.10 in./hr) | 10 mm/hr (0.40 in./hr) | 20 mm/hr (0.80 in./hr) | 25 mm/hr (1.00 in./hr) |
| 20–35 km/hr | 5 mm/hr (0.20 in./hr) | 20 mm/hr (0.80 in./hr) | N/A | N/A |
Source: Gerber and Martsolf, 1979
When to start irrigation
To successfully use irrigation for frost protection, growers need information about the dew point. Dew point is especially important in determining the irrigation start-up point.
The dew point
The dew point is the temperature at which moisture condenses from the air to form dew. The dew point is related to relative humidity: when the air is humid the dew point occurs at a higher temperature than when the air is dry. Once dew begins to form, the air temperature begins to drop more slowly. When temperatures reach freezing, the dew turns to frost.
Dew points are available from weather forecasts such as:
- Environment Canada — provides current dew points and other current weather conditions, for certain locations
- Farmzone — provides forecasted dew points
Significance of dew point
Growers use dew points to estimate how quickly the temperature might drop on any given night (Table 3). Once dew begins to form, the air temperature drops more slowly because heat is released. Frequently, the nighttime temperature drops to the dew point, but not much below it. Sometimes the dew point is referred to as the basement temperature.
If the air is dry, then the dew point will be low. If the dew point is below 0°C (32°F), frost forms instead of dew. Black frosts occur when temperatures are below freezing but above the dew point. Don’t wait for frost to form before starting the irrigation system (especially when the humidity is low).
The lower the dew point, the sooner you should start to irrigate.
| Dew point | Suggested starting air temperature |
|---|---|
| −1.1°C | 0°C |
| −1.7°C | 0.5°C |
| −2.8°C | 1.1°C |
| −3.8°C | 1.6°C |
| −4.4°C | 2.7°C |
| −5.5°C | 3.3°C |
| −6.7°C | 3.8°C |
| −8.3°C | 4.4°C |
Wet bulb temperature
Sometimes the term wet bulb temperature is used to determine when to start up irrigation systems. The wet bulb temperature represents the temperature a wet surface will cool to as the water evaporates. A wet bulb thermometer is covered with clean muslin soaked in distilled water. Air is passed over the bulb and the water evaporates, reducing the temperature around the thermometer.
If wet bulb temperatures are available, use them to determine when irrigation should begin, and when the system can be shut off. Start irrigation just before the wet bulb temperature reaches the critical temperature (Figure 1).
When to stop irrigation
Stop the irrigation when ice on the plants begins to melt, usually after sunrise. Monitor to make sure the ice continues to melt, and the temperature remains above freezing. Changes in wind speed could change temperatures near the plant surface. Restart irrigation if water begins to freeze.
Ice does not have to be completely melted. The plant temperature will warm up as the sun’s rays hit the field. You know plant temperatures are above freezing when the ice falls off the plant and the water next to the pant has started to melt. At this point, turn off the irrigation water, usually around 7:30 or 8:00 am.
The best way to know when to turn off the irrigation is to monitor plant tissue temperatures beneath the ice. Digital thermometers attached to thermocouples inserted into the plant tissue can indicate when plant temperatures begin to warm up above the critical temperature.
Negative side effects of irrigation
One negative side effect of using irrigation for frost protection is the increased potential for disease outbreaks. Angular leaf spot is a bacterial disease that is spread by splashing rain or irrigation on leaves and seems to get established in frosty conditions. Anthracnose, which can cause fruit rot, generally likes warm humid weather. However, even during cool periods, it will spread by water splashing on the plants and, after establishing itself, it will thrive when warm weather arrives (Figures 9 and 10).
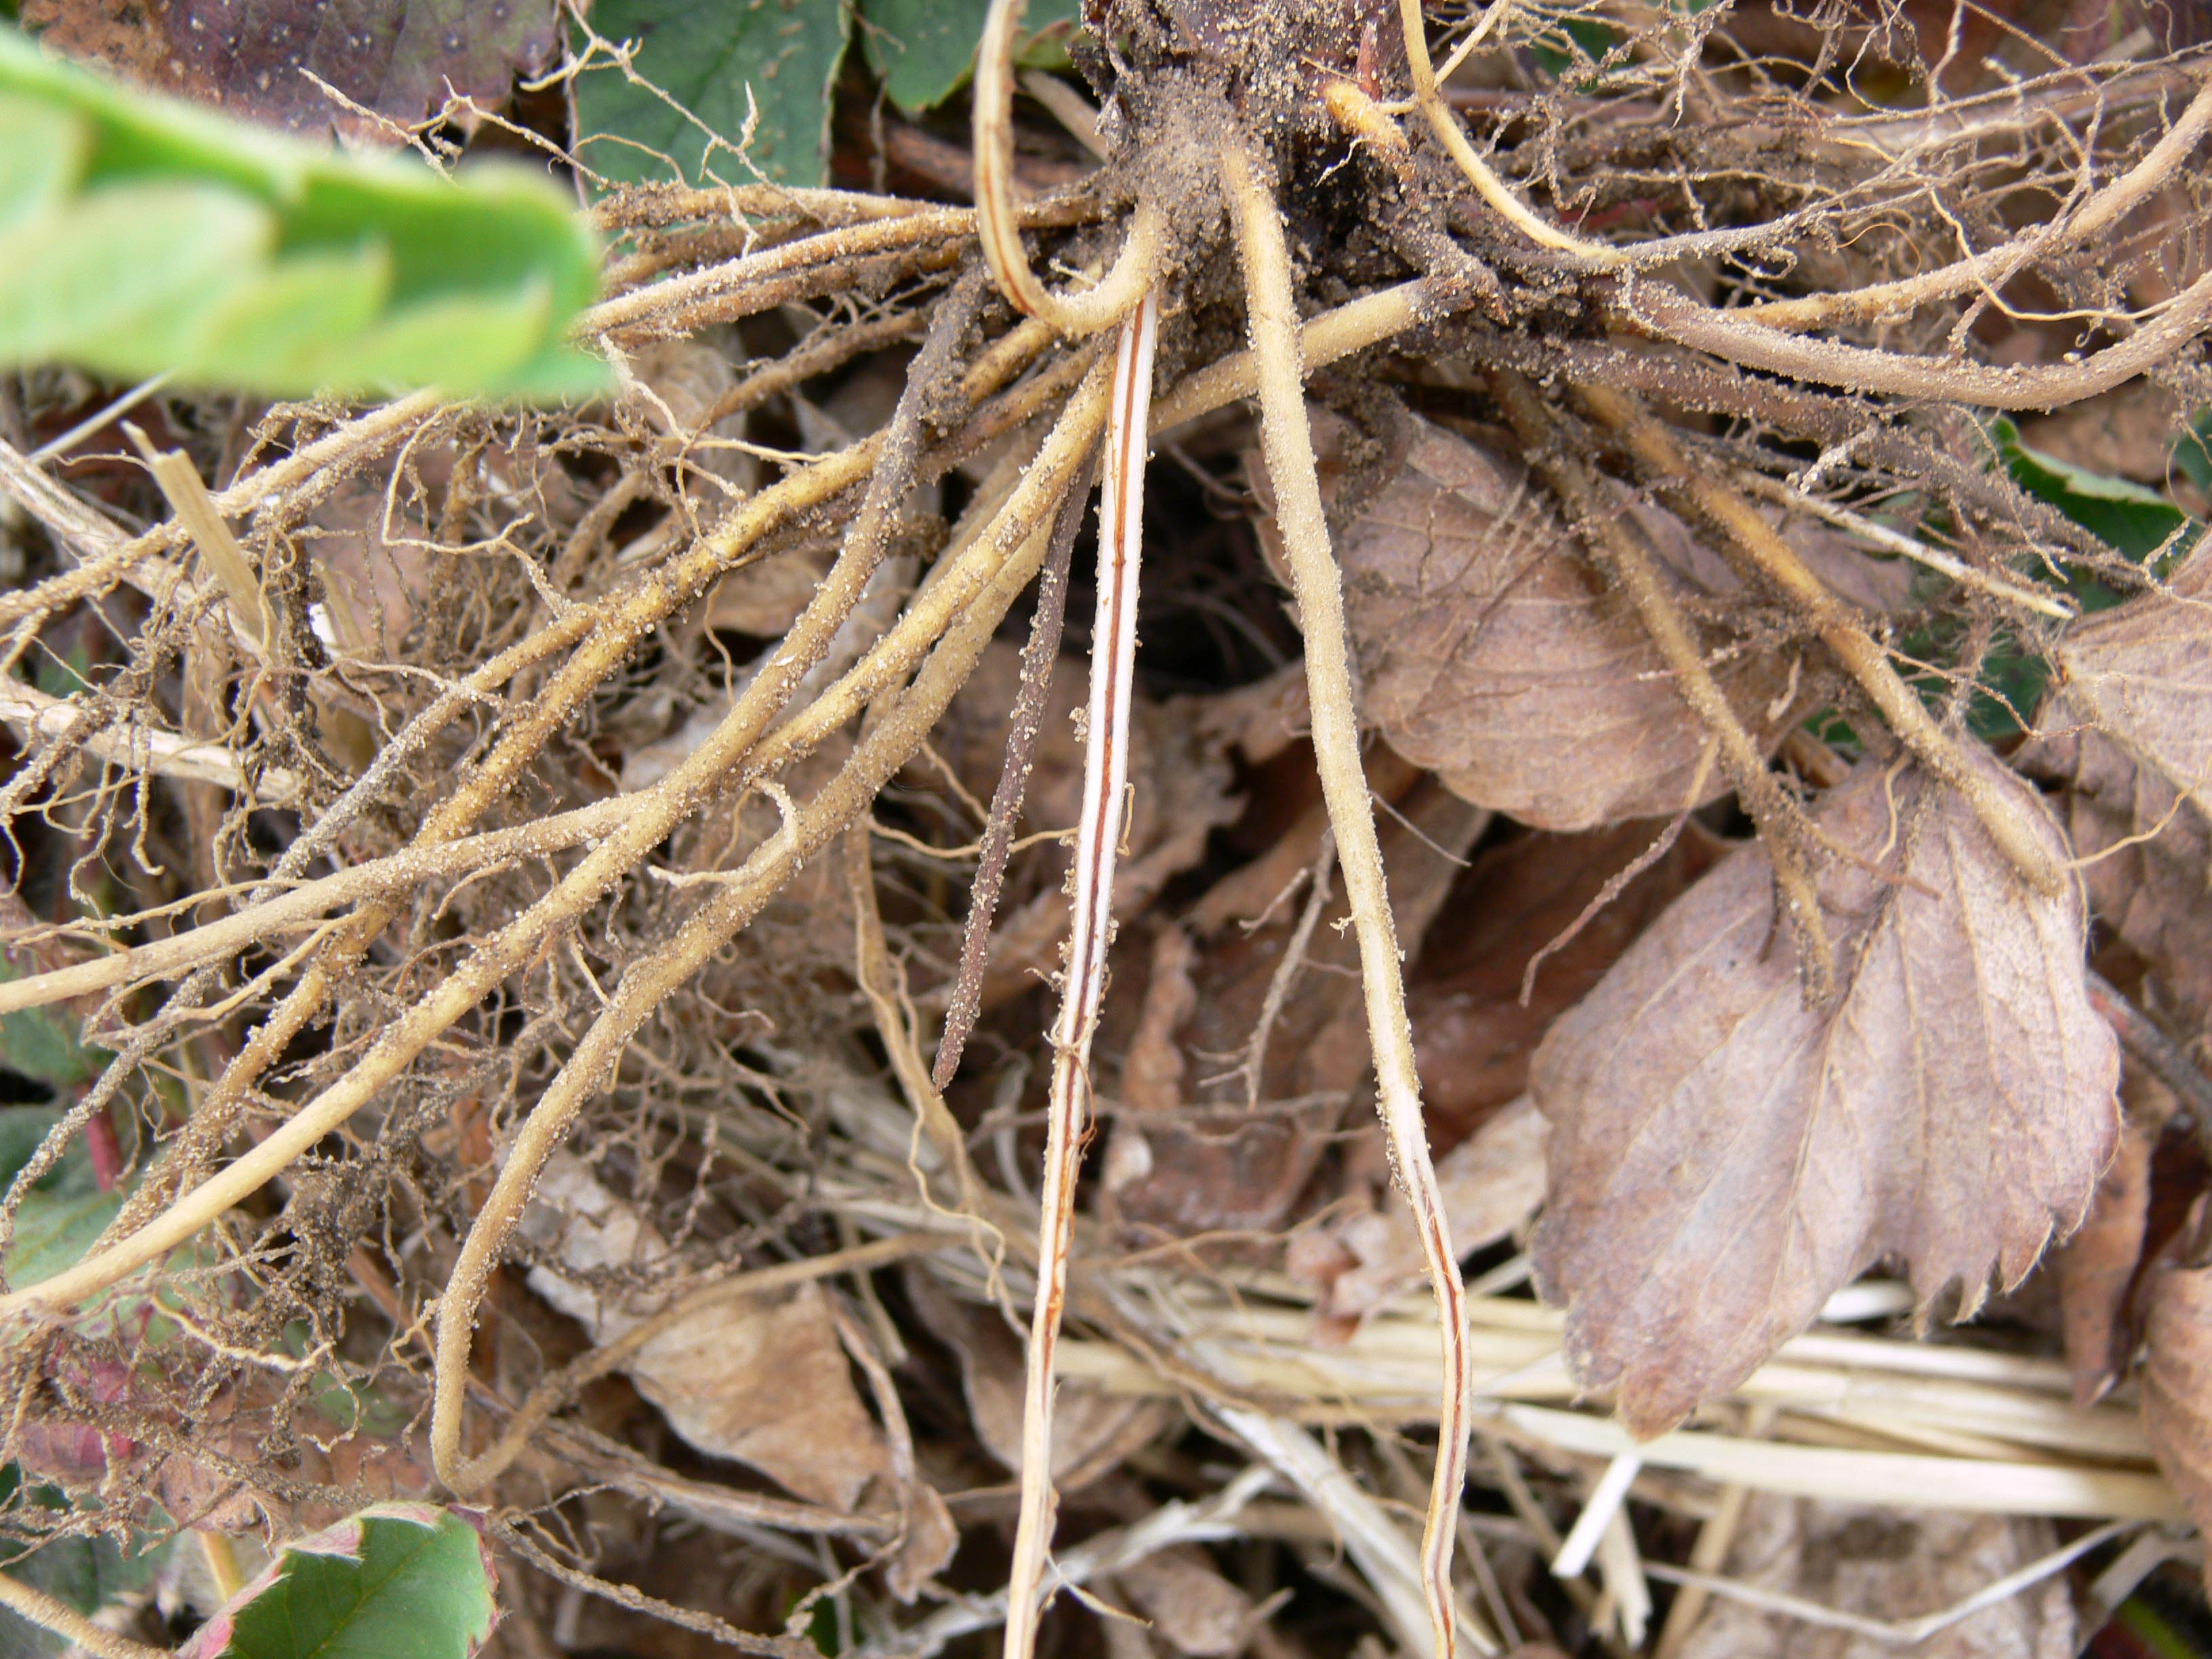
Root rots, such as red stele, thrive in saturated soil conditions. Outbreaks of red stele and other root rots have occurred after long periods of irrigation for frost protection (Figure 11). The sites best suited for frost protection by irrigation are well drained with sand or sandy loam soils.
Disease can be limited by reducing the amount of water applied. Reduce water volumes by:
- using low application rates/nozzles
- stopping when ice begins to melt, not when all the ice is melted
- monitoring the weather to irrigate only when needed
- using row covers (this can delay the start-up time for irrigation by several hours)
Row covers
Row covers reduce evaporative cooling and the rate of cooling under the cover. According to supplier’s information, the heavier-weight covers (50–70 g/m2 (1.5–2 oz/yd2)) can provide 2°C–3°C protection, but this varies both with the weight and between manufacturers. The lighter-weight covers (19–30 g/m2 (0.55–0.9 oz/yd2)) are advertised to provide 1°C–2°C protection. Trials by Dr. Allen Straw at the University of Tennessee showed only 1°C protection even with heavier-weight covers. Research suggests that two layers of 30 g/m2 (0.9 oz/yd2) cover provide more protection than one layer of 70 g/m2 (2 oz/yd2) material. They do buy time on a frosty night.
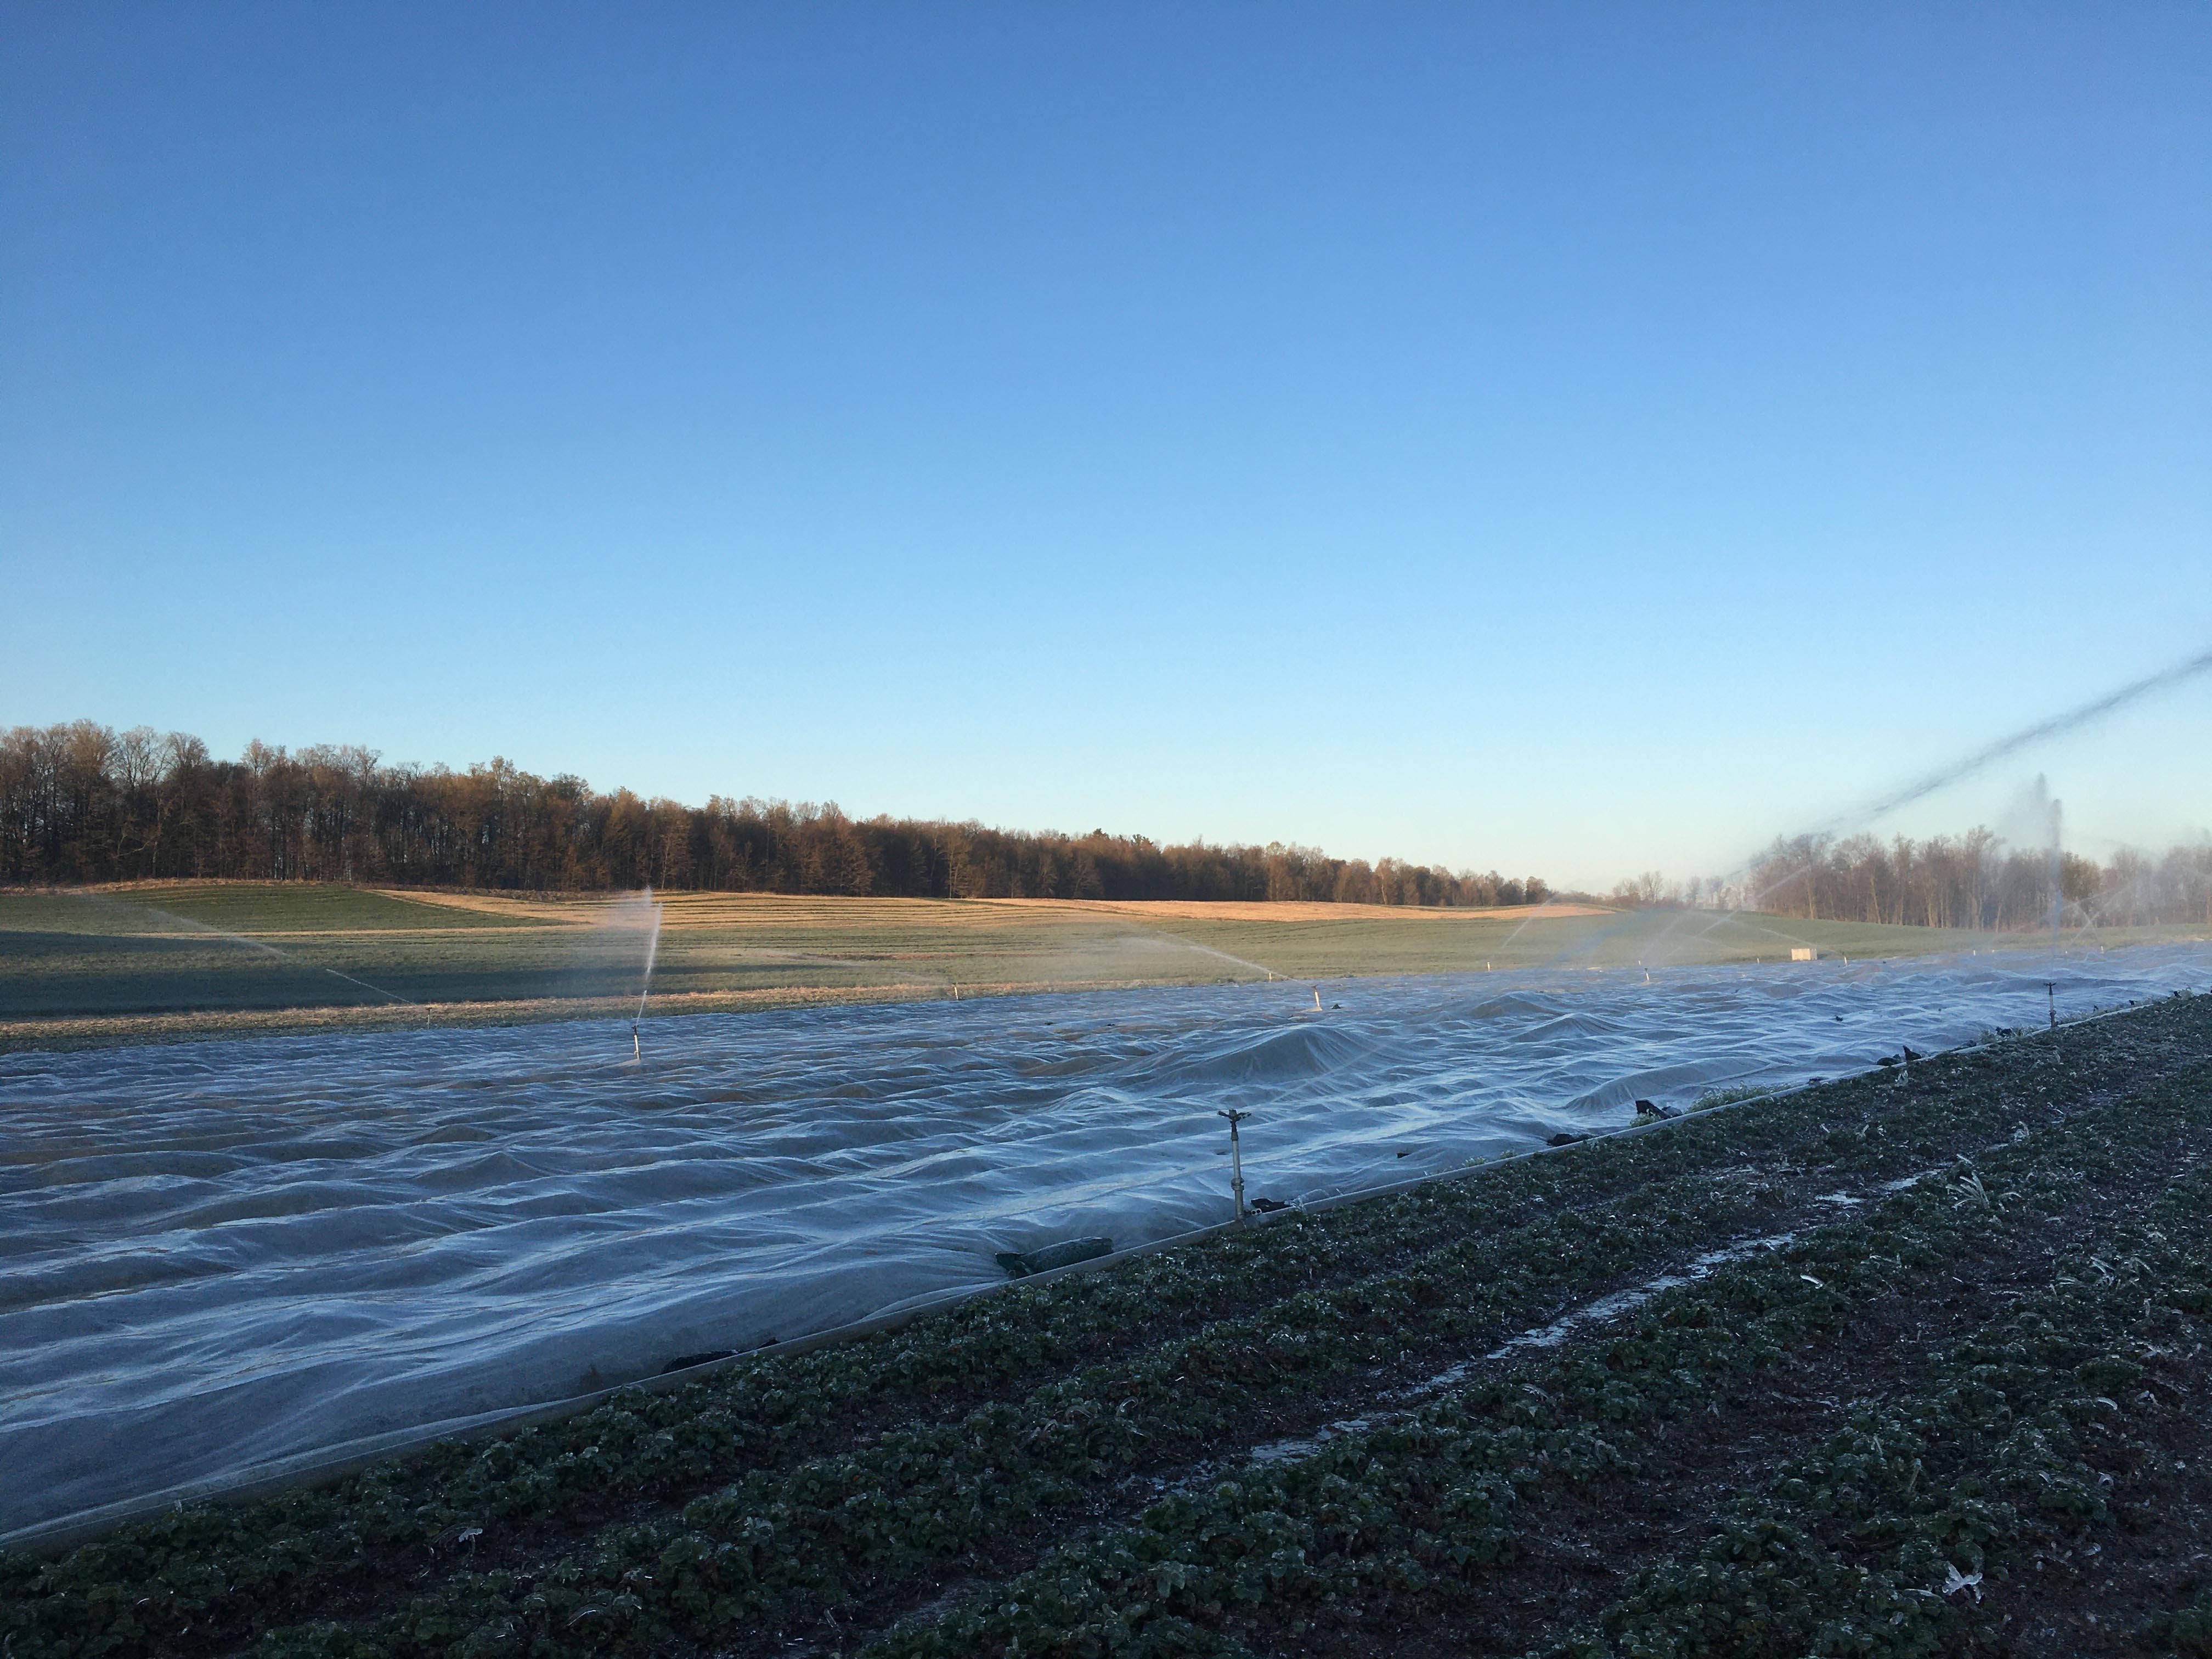
When using irrigation and row covers to protect against frost, it is important to know the plant temperature under the cover. Start when temperatures under the cover drop to 0.6°C–1.1°C. Irrigate right over the cover (Figure 12). Stop when plant temperatures start to climb. Digital thermometers attached to thermocouples inserted in the flower buds before the frost event are necessary for successful protection with covers.
Irrigation and row covers work together very effectively. By using irrigation and row covers it is possible to frost protect in adverse conditions.
Summary
Frost injury can cause significant damage to strawberry plants, especially open bloom, but also to unopened buds if it is cold enough. Strawberry fields are often colder at ground level than the weather forecast suggests.
Irrigation for frost protection works because heat is released as water freezes.
Key conclusions:
- Adjusting irrigation rates to account for evaporative cooling due to winds and relative humidity is key. More water is required on windy nights.
- Failure to apply enough water can result in greater damage than not irrigating at all.
- Where row covers are used, irrigation can take place over the cover.
- When to start up the irrigation system is critical.
Determining optimum time for starting frost protection:
- The start temperature for frost protection is higher when the humidity is low. The start temperature for frost protection is lower when the humidity is high.
- Use the dew point and Table 3 to determine the temperature at which to start irrigation.
- Dew point is also useful for predicting the lowest expected temperature and how quickly the temperature will drop.
- Measure the wet bulb temperature. Irrigation should start before the wet bulb temperature reaches the critical temperature (Figure 1).
Resources
OMAFRA fact sheets:
Perry, Katherine B. Guide to Deciding When to Start and Stop Irrigation for Frost Protection of Fruit Crops. North Carolina State University, Horticulture Information Leaflet, 1998.
Perry, Katherine B., Bradley, Lucy. Frost/Freeze Protection for Horticultural Crops. North Carolina State University Horticulture Information Leaflet 705, 1994.
Poling, Barclay. Strawberry Plasticulture Advisory on Cold Protection (PDF). Vol. 6 No. 11. 2005.
Snyder, Richard L. Principles of Frost Protection. University of California, Davis, 2000.
Snyder, Richard L., Paulo de Melo-Abreu, J., Matulich, Scott. Frost Protection: fundamentals, practice, and economics — Volume 2. Food and Agriculture Organization of the United Nations, 2005.
This fact sheet was written by Rebecca Shortt, P. Eng., water quantity, OMAFRA, Erica Pate, fruit crop specialist, OMAFRA and Patrick Handyside, P. Eng., senior water management engineer, Agriculture and Agri-Food Canada.
Footnotes
- footnote[1] Back to paragraph Perry and Poling. Field observations of frost injury in strawberry buds and blossoms. Adv. Strawberry Prod. 1985. 5:31-38
- footnote[2] Back to paragraph Gerber and Martsolf. Sprinkling for frost and cold protection. In Modification of the aerial environment of crops. Eds. Barfield and Gerber. Amer. Soc. Of Civil Eng., St. Joseph, MO. 1979. pp. 327–333.