Labour market report, April 2017
Employment in Ontario decreased in April. Get the details in this report.
Quick facts
In April 2017, there were 11.6 million people in Ontario aged 15 years or older, 7.5 million, or 65%, were either working or actively looking for work. Of the 11.6 million people, 7.1 million were employed and 81% of them had a full time job.
Ontario’s unemployment rate was 5.8%, with 437,400 people unemployed.
Employment decreased in April
Chart 1 shows employment in Ontario from January 2012 to April 2017.
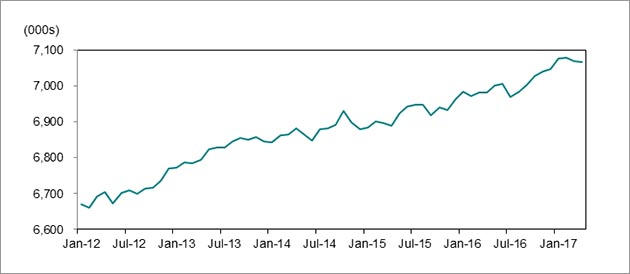
Source: Statistics Canada, Labour Force Survey, Table 282-0087 (seasonally adjusted data).
Employment in Ontario fell by 1,600 jobs in April, following a decrease of 11,200 in March.
In Canada, overall, employment rose by 3,200 jobs in April, following a 19,400 gain in March.
Full-time vs. part-time
Full-time employment in Ontario declined by 13,800 jobs and part-time employment increased by 12,300 jobs.
Employment increase/decrease by age
Ontario’s youth employment, ages 15 to 24 years, gained 1,000 jobs after a decrease in March of 12,700 jobs.
For people ages 25 to 54, employment fell by 24,400 jobs, or 0.5%. For those aged 55 and older, employment increased by 21,800 jobs, or 1.5%.
Unemployment rate decreased to 5.8%
Chart 2 shows unemployment rates, Ontario and Canada, January 2012 to April 2017
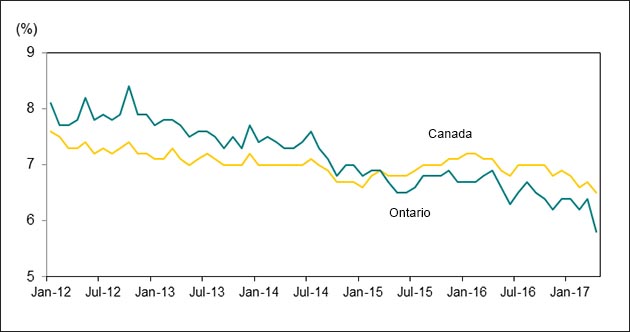
Source: Statistics Canada, Labour Force Survey, Table 282-0087 (seasonally adjusted data).
Ontario’s unemployment rate decreased to 5.8% in April, from 6.4% in March. The unemployment rate has been below 6.5% for seven months.
Canada’s unemployment rate declined to 6.5% in April, from 6.7% in March.
Lower youth unemployment rate
The unemployment rate for youth fell to 12.2% in April, from 14.8% in March.
Unemployment rate for adults
For people aged 25 to 54 years, the unemployment rate was unchanged at 5.0% in April. For those 55 and older the rate fell from 4.9% to 4.2%.
Lowest and highest unemployment rates
Chart 3 shows Census Metropolitan Areas (CMAs) with highest and lowest unemployment rates in Canada, April 2017.
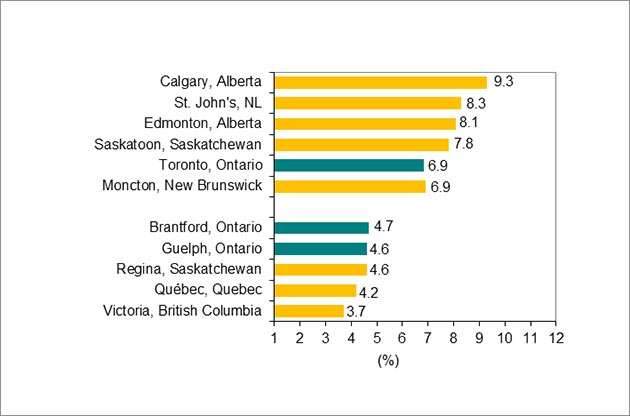
Source: Statistics Canada, Labour Force Survey, Table 282-0135, (seasonally adjusted, 3-month moving average data to reduce volatility caused by small sample size).
Lowest and highest unemployment rates
Guelph, a city in southwestern Ontario, had the lowest unemployment rate for April 2017, at 4.6%. Brantford, Ontario ranked second with an unemployment rate of 4.7%. Not shown in the graph, the highest unemployment rate in Ontario for April 2017 was in Toronto, with a rate of 6.9%.
Victoria, British Columbia recorded the lowest unemployment rate nationally, at 3.7%. Calgary, Alberta recorded the highest rate nationally, at 9.3%.
Year-over-year comparisons
Year-over-year comparisons look at employment for the period January to April of 2017 and the same four-month period in 2016.
Employment increase and decrease by education level
In the first four months of 2017, employment increased by 92,800 for adults 25 years and older compared to the same period in 2016:
- People with a high school level education led gains, with 88,700 net new jobs.
- Individuals with a university degree recorded job gains of 36,400, while those with a postsecondary education (PSE) certificate or diploma gained 900 jobs.
- People with less than high school education and those with some PSE recorded job losses of 12,500 and 20,800, respectively.
Chart 4 shows Ontario employment change by highest level of education attained, aged 25 and older, change between April 2016 and April 2017, year-to-date.
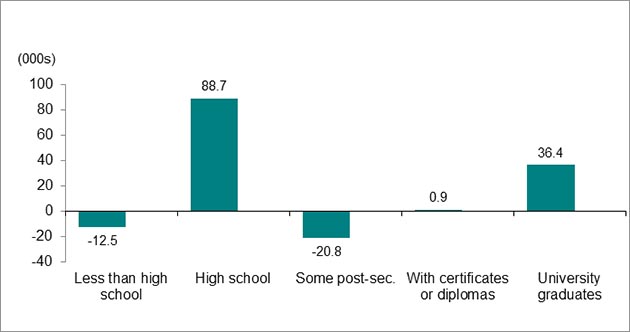
Source: Statistics Canada, Labour Force Survey, Table 282-0003, (unadjusted data).
Unemployment rate and education level
The unemployment rate in the first four months of April 2017, by level of education, was:
- 4.3% for people 25 and older with a post-secondary degree, diploma or certificate, down from 5.0% a year earlier
- 7.3% for people 25 and older without a post-secondary degree, diploma or certificate, down from 7.9% a year earlier
Occupational employment change
Chart 5 shows Ontario employment growth by occupation, between April 2016 and April 2017, year-to-date.
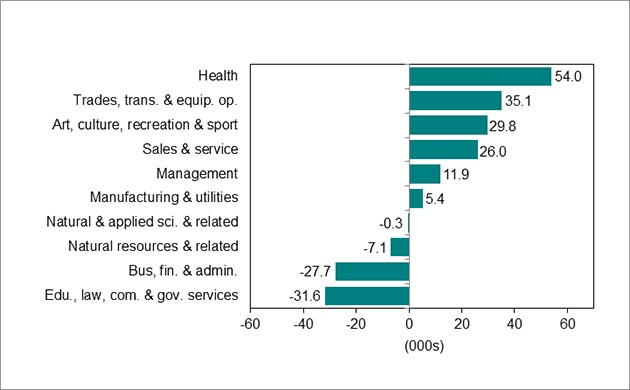
Source: Statistics Canada, Labour Forces Survey, Table 282-0041, (unadjusted data).
Six of the ten major occupational groups in Ontario recorded higher employment in the first four months of 2017 compared to the same period a year earlier.
Learn more about the National Occupation Classification (NOC) system.
These occupations gained the most jobs:
- Health (54,000)
- Trades, transport and equipment operators and related (35,100)
- Art, culture, recreation and sport (29,800)
These occupations lost the most jobs:
- Education, law and social, community and government services (31,600)
- Business, finance and administration (27,700)
- Natural resources, agriculture and related production (7,100).
Long-term unemployment decreased
Chart 6 shows Ontario’s long-term unemployed (27 weeks or more) as a percent of total unemployment, April 2009 to April 2017, year-to-date.
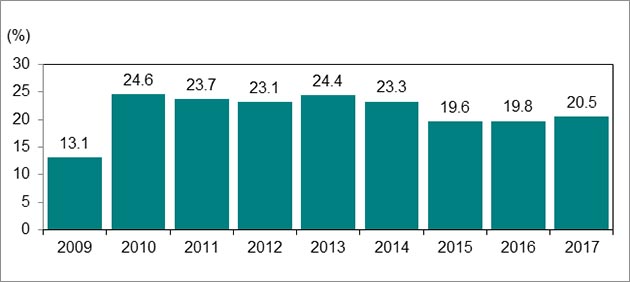
Source: Statistics Canada, Labour Forces Survey, Table 282-0047, unadjusted data.
Over the first four months of 2017, an estimated 97,600 people were unemployed for 27 weeks or more, or in long-term unemployment. This was down from 102,000 in the first four months of 2016 and well above pre-recessionary levels.
The percentage of long-term unemployed people, when taken as a share of all unemployed people, increased to 20.5% in the first four months of 2017, up from 19.8% a year earlier.
The percentage of long-term unemployed people is still high compared to the first four months of 2009, when the long-term unemployment rate was 13.1%.
Average time in long-term unemployment
The average duration of unemployment increased to 20.4 weeks in the first four months of 2017 from 19.8 weeks a year earlier