Labour market report, April 2021
Employment in Ontario decreased by 152,700 in April. Get the details in this report.
Quick facts
In April 2021:
- There were 12.3 million people in Ontario aged 15 years or older
- 7.9 million (64.4%) were in the labour force, including those who had worked, were unemployed and looking for work or did not work at their job, which includes people on temporary layoff because of ongoing COVID-related business closures. The labour force decreased in April (−32,300 or −0.4%) compared to March .
- 7.2 million (58.6%) were employed, down by 152,700 (−2.1%) from March.
- Ontario's unemployment rate increased to 9.0% in April from 7.5% in March and 716,800 people were unemployed, up 20.2% (120,400) from March.
Important note:
This report is based on the Labour Force Survey (LFS), a household survey carried out by Statistics Canada. April’s LFS results covers labour market conditions as of the week of April 11 to 17.
Ontario’s mandatory closure of non-essential businesses and other measures aimed at addressing the impact of COVID‑19 took effect on March 24, 2020.
A new province-wide Stay-at-Home order requiring everyone to remain at home except for essential purposes took effect on April 8, 2021.
The types of businesses that were deemed essential and remained open during the COVID‑19 economic shutdown and the types of businesses that reopened at the different stages of the Ontario government’s plan for reopening the economy should be considered in the context of information provided in this report.
Employment decreased in April
Employment decreased in April (−152,700 or −2.1%) following an increase of 182,300 (2.5%) in March.
In April, employment in Ontario was 7,215,400 and 275,700 (3.7%) below its pre-COVID‑19 February 2020 level.
The total number of hours worked in Ontario in April 2021 (at all jobs) was down by 7.1% compared to February 2020 (data are not seasonally adjusted).
Chart 1 shows employment in Ontario from January 2005 to April 2021.
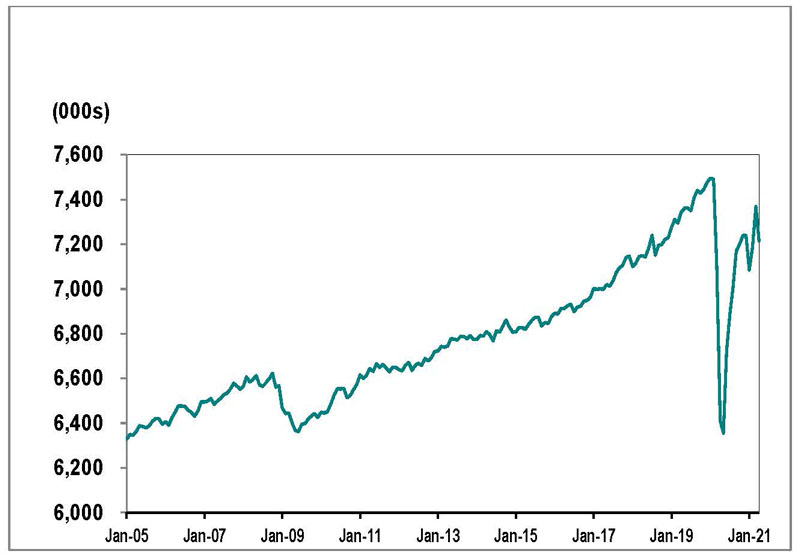
Source: Statistics Canada, Labour Force Survey, Table 14-10-0287-01, (seasonally adjusted data).
Full-time vs. part-time
Full-time jobs fell by 134,000 (−2.2%) and part-time jobs declined by 18,700 (−1.5%).
Employment change by sex and age
April’s employment decline was 2.8% (−95,900) for women compared to 1.5% for men (−56,800).
Employment among women was further behind its pre-COVID February 2020 level (-5.1% or -179,900) than employment among men (-2.4% or -95,800)
Youth (those aged 15 to 24) employment fell by 73,000 (-7.8%) in April, after increasing by 59,000 (6.7%) in March. Employment for people aged 25 to 54 fell to 37,600 (-0.8%) in April following an increase of 61,700 (1.3%) in March. Employment for those aged 55 and older declined by 42,100 (-2.5%) in April, following an increase of 61,600 (3.8%) in March.
In April, youth employment remained further from pre-COVID February 2020 levels (15.6% or 159,600) than employment among those aged 25-54 (-1.8% or -88,600) or those aged 55 and over (−1.6% or −27,500).
Employment in Canada decreased by 207,100 (−1.1%) in April after increasing by 303,100 (1.6%) in March and was 503,100 (-2.6%) below its pre-COVID February 2020 level.
Employment change by industry
The government’s restrictions on the types of businesses that were deemed essential and other measures aimed at addressing the impact of COVID‑19 should be considered in the context of employment change by sector.
In April, employment in accommodation and food services was furthest below its pre-COVID February 2020 level (−135,100 or −30.5%), followed by employment in wholesale and retail trade (−73,000 or −6.6%), business, building and other support services (-45,600 or -14.1%), transportation and warehousing (−27,900 or −7.0%) and educational services (−23,000 or −4.2%).
Employment was above pre-COVID February 2020 levels in professional, scientific and technical services (40,800 or 6.1% ), finance, insurance, real estate, rental and leasing (33,400 or 5.5%), manufacturing (14,700 or 1.9%) and public administration (8,900 or 2.3%).
Chart 2 shows industries by employment change in Ontario, February 2020 to April 2021.
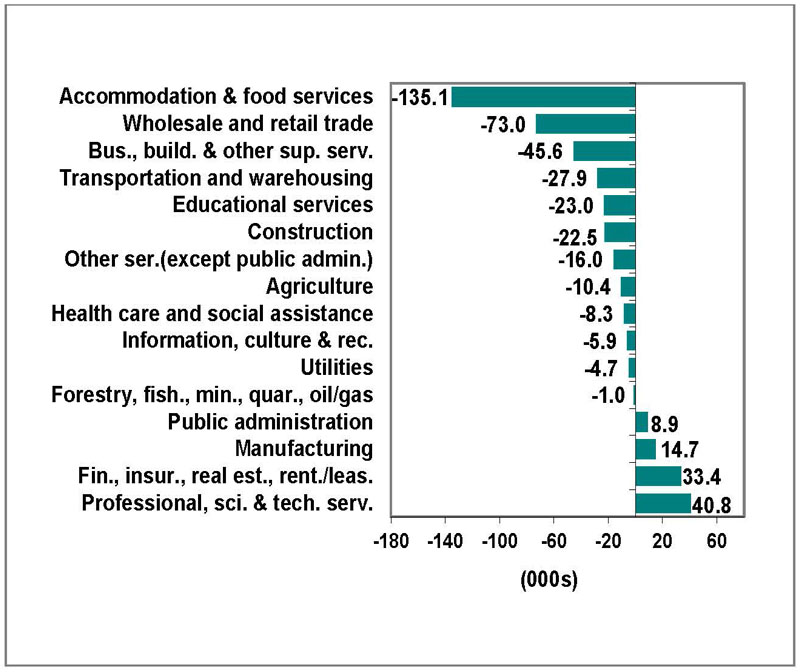
Source: Statistics Canada, Labour Force Survey, Table 14-10-0355-02, (seasonally adjusted data).
Unemployment rate increased to 9.0%
Chart 3 shows unemployment rates, Ontario and Canada, January 2005 to April 2021.
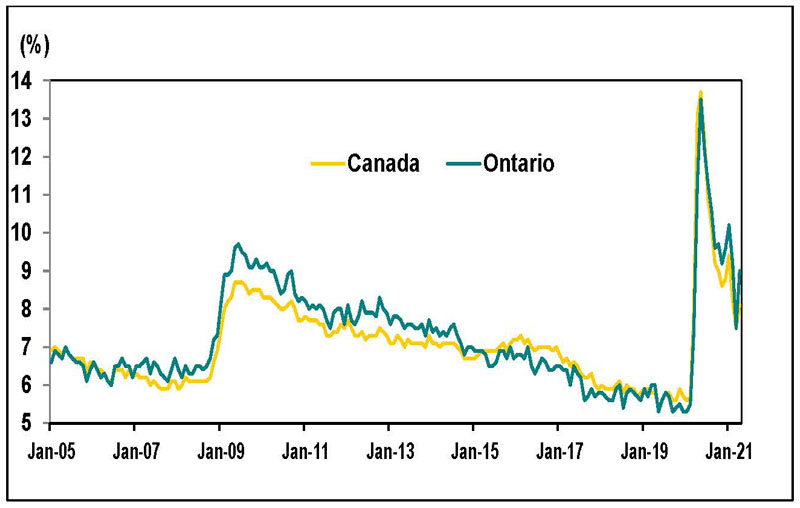
Source: Statistics Canada, Labour Force Survey, Table 14-10-0287-01, (seasonally adjusted data).
Ontario’s unemployment rate in April was 9.0%, up from 7.5% in March. The unemployment rate in February 2020 was 5.5%.
Canada’s unemployment rate increased to 8.1% in April from 7.5% in March. Canada’s unemployment rate in February 2020 was 5.7%.
Unemployment rate by sex and age
The unemployment rate for women was 9.8% in April, up from 7.8% in March, while the rate for men increased to 8.4% from 7.2% during the same period.
In Ontario, the unemployment rate among population groups designated as visible minorities was estimated at 10.6% in April in comparison to an 8.1% rate for non-visible minorities and those that did not identify as Indigenous (data are for the population aged 15 to 69 and are not adjusted for seasonality).
For individuals aged 15 to 24, the unemployment rate increased to 20.4% in April from 15.1% in March. The youth unemployment rate reached a record high of 30.0% in May 2020.
The unemployment rate for individuals aged 25 to 54 was 7.3% in April, up from 6.7% in March, while the rate for those aged 55 and older was increased to 7.2% from 5.0%.
Long-term unemployment
In April, an average of 210,700 Ontarians or 29.4% of all unemployed people were unemployed for 27 weeks or longer (long-term unemployed). This was up from 206,200 in the previous month and three times the pre-COVID February 2020 level of 68,800.
The average time in unemployment increased to 20.7 weeks in April 2021 from 15.9 weeks in February 2020.
Chart 4 shows the number of people unemployed for 27 week or more in Ontario, January 2005 to April 2021.
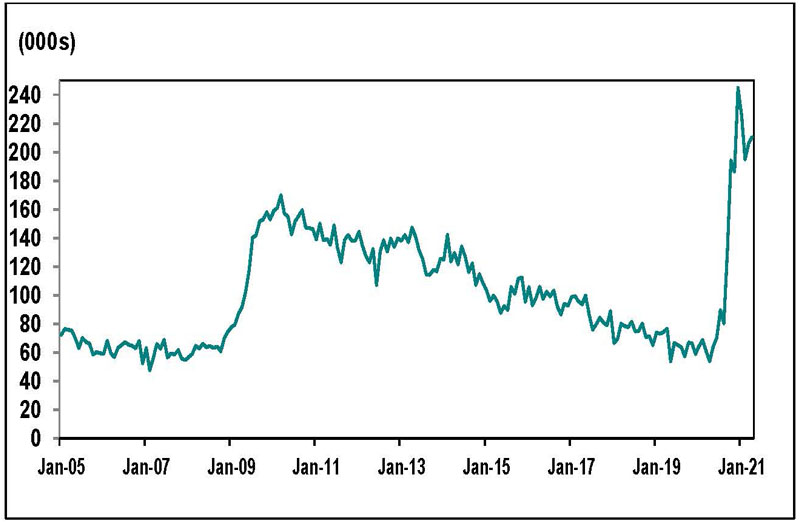
Source: Statistics Canada, Labour Force Survey, Table 14-10-0342-01, (seasonally adjusted data).
Employment and unemployment in urban centres
Employment change in urban centres
Chart 5 shows the rate of employment change for Ontario Census Metropolitan Areas (CMAs) from March 2021 to April 2021.
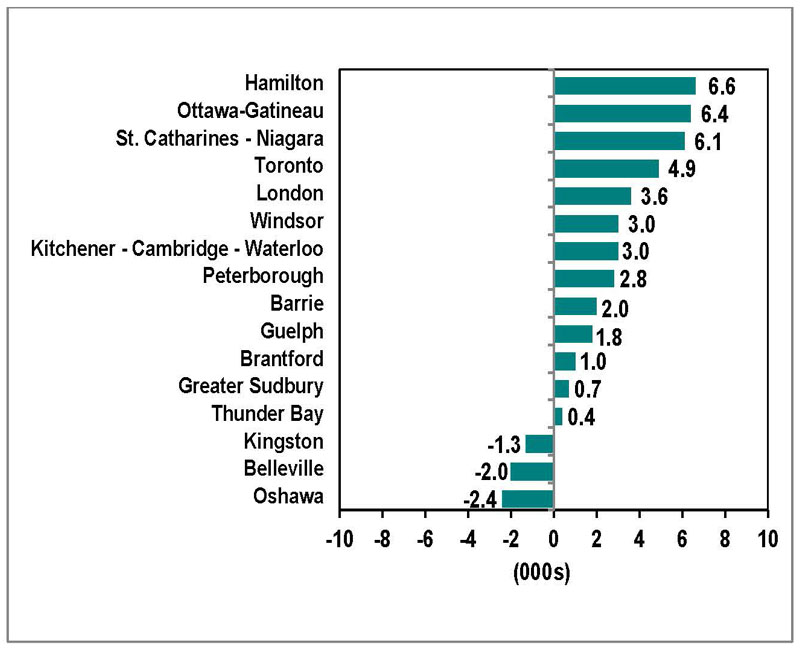
Source: Statistics Canada, Labour Force Survey, Table 14-10-0294-01, (seasonally adjusted data three-month moving average to reduce volatility caused by small sample size).
Employment levels increased in thirteen of the sixteen Ontario Census Metropolitan Areas (CMAs) between March and April, led by Hamilton (6,600 or 1.6%), Ottawa-Gatineau (6,400 or 1.1%), St. Catharines-Niagara (6,100 or 3.3%) and Toronto (4,900 or 0.2%).
Oshawa (-2,400 or -1.2%), Belleville (-2,000 or -3.8%) and Kingston (-1,300 or -1.5%) recorded notable declines in employment.
In April, employment in 11 of the 16 Ontario urban centres remained below pre-COVID February 2020 levels, led by Toronto (-181,000 or -5.2%), Kitchener-Cambridge-Waterloo (-15,400 or -4.6%), Barrie (-15,200 or -12.0%) and St. Catharines-Niagara (-15,100 or -7.3%).
London (6,900 or 2.5%), Peterborough (4,700 or 8.1%), Brantford (2,600 or 2.2%) and Guelph (3,000 or 3.5%), Brantford (2,600 or 3.5%) and Ottawa-Gatineau (2,100 or 0.4%) reported employment that was above pre-COVID February 2020 levels.
Lowest and highest unemployment rates in urban centres
Chart 6 shows Census Metropolitan Areas (CMAs) with highest and lowest unemployment rates in Canada, April 2021.
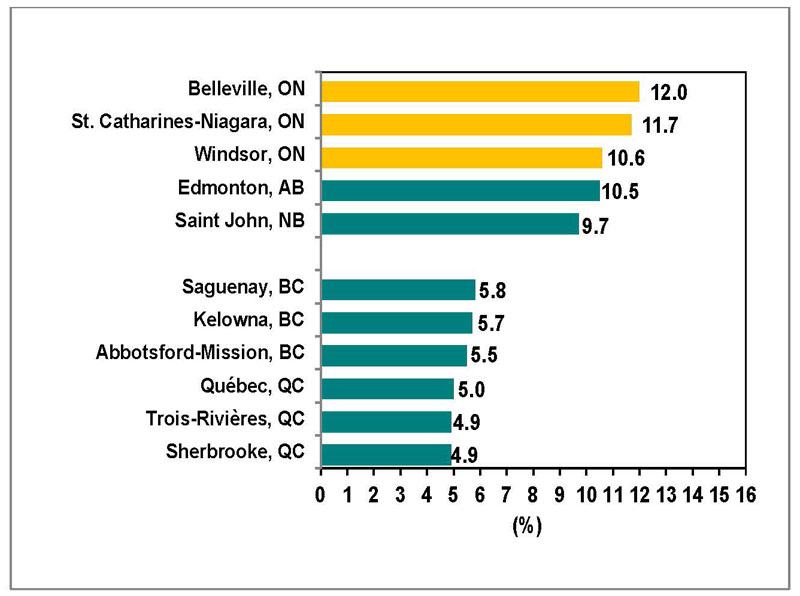
Source: Statistics Canada, Labour Force Survey, Table 14-10-0294-01, (seasonally adjusted data three-month moving average to reduce volatility caused by small sample size).
Ontario Census Metropolitan Areas (CMAs) recorded the three highest unemployment rates in Canada in April, led by Belleville (12.0%) and followed by St. Catharines-Niagara (11.7%) and Windsor (10.6%).
Kitchener-Cambridge-Waterloo recorded the lowest unemployment rate in Ontario in April (6.2%), while Sherbrooke and Trois-Rivières were tied with the lowest unemployment rate in Canada (4.9%).
Download data
Source: Statistics Canada, Labour Force Survey
April 2021 Labour Market Report:
- CSV, Chart 1, employment in Ontario from January 2005 to April 2021, 1 Kb
- CSV, Chart 2, industries with highest and lowest employment change in Ontario, February 2020 to April 2021, 2 Kb
- CSV, Chart 3, unemployment rates, Ontario and Canada, January 2005 to April 2021, 2 Kb
- CSV, Chart 4, number of people unemployed for 27 week or more in Ontario, January 2005 to April 2021, 2 Kb
- CSV, Chart 5, the rate of employment change for Ontario Census Metropolitan Areas (CMAs) from March 2021 to April 2021, 12 Kb
- CSV, Chart 6, , Census Metropolitan Areas (CMAs) highest and lowest unemployment rates, April 2021, 2 Kb