Labour market report, August 2018
Employment in Ontario declined in August. Get the details in this report.
Quick facts
In August 2018:
- There were 11.9 million people in Ontario aged 15 years or older
- 7.7 million (64%) were either working or actively looking for work
- 7.2 million (61%) were employed and 81% of them had a full-time job
- Ontario’s unemployment rate was 5.7% (438,300 unemployed people)
Employment declined in August
Employment in Ontario declined by 80,100 in August, following the largest monthly gain on record in July (60,100).
Chart 1 shows employment in Ontario from January 2013 to August 2018
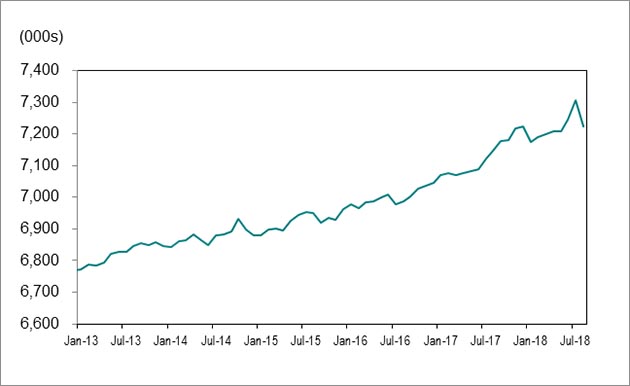
Source: Statistics Canada, Labour Force Survey, Table 14-10-0019-01, (seasonally adjusted data).
Full-time vs. part-time
Part-time (80,100) jobs accounted for all the decline in August. Full-time jobs held steadily.
Generally, monthly changes in part-time employment can be a result of factors such as the movement of workers between part-time and full-time jobs and changes in industries where part-time work is more common.
Employment increase/decrease by age
Youth employment (those aged 15 to 24) decreased by 18,700 jobs in August as many younger workers left the labour force. This follows an increase of 8,200 jobs in July.
Employment for people aged 25 to 54 decreased by 36,100 in August compared to July and those aged 55 and older lost 25,500 jobs.
Employment in Canada declined by 51,600 jobs in August, after increasing by 54,100 jobs in July.
Unemployment rate increased to 5.7%
Chart 2 shows unemployment rates, Ontario and Canada, January 2013 to August 2018.
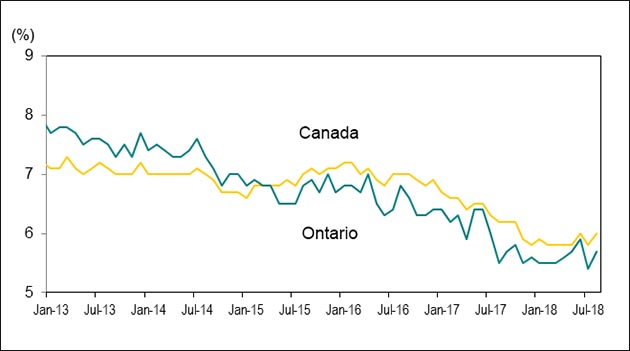
Source: Statistics Canada, Labour Force Survey, Table 14-10-0019-01, (seasonally adjusted data).
Ontario’s unemployment rate increased to 5.7% in August, from 5.4% in July. July’s unemployment rate was the lowest rate since April 1990.
Canada’s unemployment rate increased to 6.0% in August, from 5.8% in July.
Ontario’s unemployment rate has remained below that of Canada’s unemployment rate for more than three years.
Unemployment rate by age
For people aged 15 to 24, the unemployment rate increased to 11.4% in August, from 11.2% in July.
The unemployment rate for people aged 25 to 54 increased to 5.0% in August, from 4.5% in July, and remained at 4.1% for those aged 55 and older.
Lowest and highest unemployment rates
Chart 3 shows Census Metropolitan Areas (CMAs) with highest and lowest unemployment rates in Canada, August 2018.
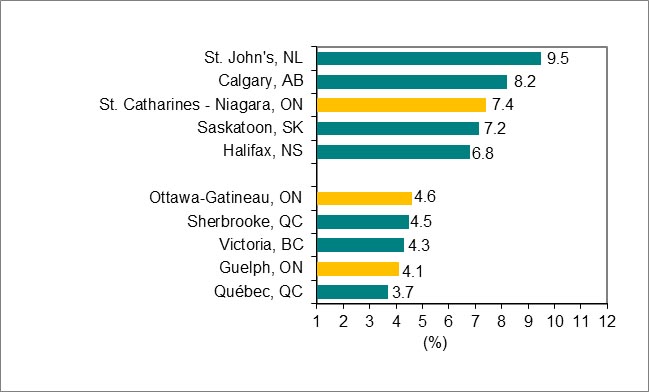
Source: Statistics Canada, Labour Force Survey, Table 14-10-0294-01, (seasonally adjusted data to reduce volatility caused by small sample size).
St. Catharines-Niagara recorded the highest unemployment rate in Ontario (7.4%) in August, while St. John’s, Newfoundland recorded the highest unemployment rate in Canada (9.5%).
Guelph recorded recorded the lowest unemployment rate in Ontario in August (4.1%), and Québec City recorded the lowest rate in Canada (3.7%).
Year-over-year comparisons
Over the first eight months of 2018, employment in Ontario increased by 100,700 net jobs for adults 25 years and older compared to the first eight months of 2017.
Employment increase and decrease by education level
Chart 4 shows Ontario employment change by highest level of education attained, aged 25 and older, August 2017 to August 2018, year-to-date.
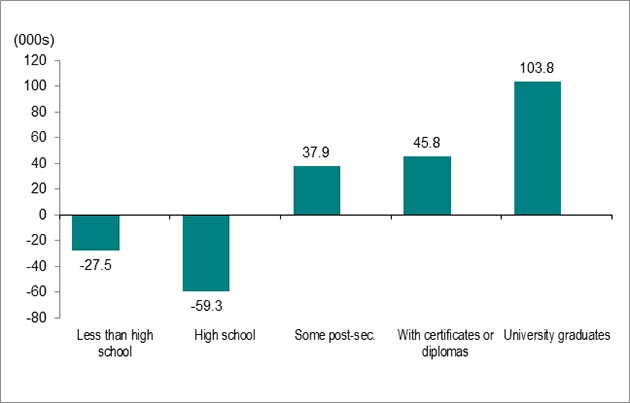
Source: Statistics Canada, Labour Force Survey, Table 14-10-0019-01, unadjusted data
Adults with a university degree led gains with 103,800 net new jobs.
Individuals with some postsecondary education recorded job gains of 37,900, while employment for those with certificates or diplomas increased by 45,800 jobs.
People with less than high school education recorded job losses of 27,500 and those with high school education recorded job losses of 59,300.
Unemployment rate by education level
The unemployment rate for adults aged 25 and older with postsecondary education credentials was 4.3% over the first eight months of 2018, down from 4.5% a year earlier.
The unemployment rate for adults without postsecondary education credentials was 6.0%, down from 6.9% compared to the first eight months of 2017.
Employment increase and decrease by occupation
Chart 5 shows Ontario employment change by occupation, August 2017 to August 2018, year-to-date.
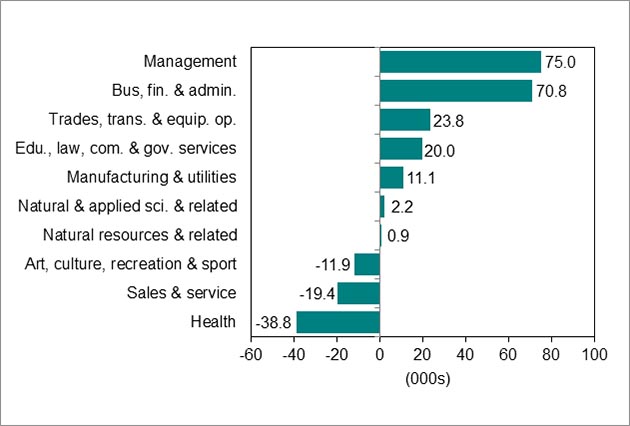
Source: Statistics Canada, Labour Force Survey, Table 14-10-0296-01, unadjusted data.
Seven of the 10 major occupational groups in Ontario had net employment gains over the first eight months of 2018 compared to a year earlier.
Learn more about the National Occupation Classification (NOC) system.
These occupations gained the most jobs:
- management (75,000)
- business, finance and administration (70,800)
- trades, transport and equipment operators and related (23,800)
These occupations lost jobs:
- health (38,800)
- sales and service (19,400)
- art, culture, recreation and sport (11,900)
Long-term unemployment decreased
Chart 6 shows Ontario’s long-term unemployed (27 weeks or more) as a percentage of total unemployment, August 2010 to August 2018, year-to-date.
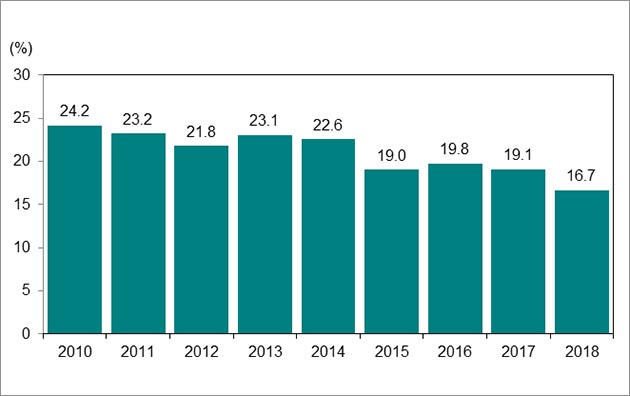
Source: Statistics Canada, Labour Force Survey, Table 14-10-0056-01, unadjusted data.
Over the first eight months of 2018, an average of 75,300 people were long-term unemployed, or unemployed for 27 weeks or longer. This was down from 92,400 a year earlier.
Long-term unemployed individuals accounted for 16.7% of the total number of unemployed people over the first eight months of 2018, compared with 19.1% a year earlier.
The percentage of long-term unemployed individuals is still higher compared with the pre-recession level in August 2008, when 13.2% of all unemployed people were long-term unemployed.
Average time in long-term unemployment
The average time in unemployment decreased to 17.1 weeks over the first eight months of 2018 from 19.1 weeks a year earlier.
Download data
Source: Statistics Canada, Labour Force Survey
August 2018 Labour Market Report:
- CSV, Chart 1, employment in Ontario from January 2013 to August 2018, 1kb
- CSV, Chart 2 unemployment rates, Ontario and Canada, January 2013 to August 2018, 2kb
- CSV, Chart 3 Census Metropolitan Areas (CMAs) highest and lowest unemployment rates, 2kb
- CSV, Chart 4, Ontario employment change by highest level of education, aged 25 and older, 99kb
- CSV, Chart 5, Ontario employment change by occupation 12kb
- CSV, Chart 6, Ontario’s long-term unemployed, 15kb