Labour market report, December 2019
Employment in Ontario increased in December. Get the details in this report.
Quick facts
In December 2019:
- there were 12.2 million people in Ontario aged 15 years or older:
- 8.0 million (65%) were either working or actively looking for work
- 7.5 million (62%) were employed and 82% of them had a full-time job
- Ontario's unemployment rate was 5.3% (423,200 unemployed people)
Employment increased in December
Employment in Ontario increased by 25,100 in December after increasing by 15,400 jobs in November.
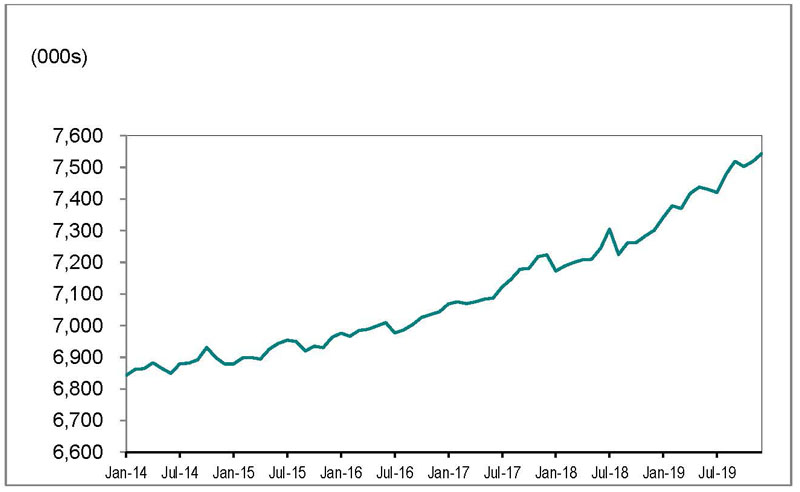
Source: Statistics Canada, Labour Force Survey, Table 14-10-0287-01, (seasonally adjusted data).
Full-time vs. part-time
Full-time employment increased by 43,700 while part-time employment fell by 18,600.
Employment increase/decrease by age
Youth employment (those aged 15 to 24) increased by 10,600 in December, after increasing by 5,900 jobs in November.
Employment for people aged 25 to 54 increased by 7,600 in December, compared to November. Employment for those aged 55 and older increased by 6,900 jobs.
Employment in Canada increased by 35,200 in December, following a decline of 71,200 jobs in November.
Employment in 2019
In 2019, Ontario employment rose by 210,200, compared with 114,400 net new jobs in 2018.
Full-time employment increased by 156,800 in 2019 compared to 2018. Part-time employment also increased (53,400).
Nationally, employment increased by 398,200 net new jobs in 2019.
Unemployment rate decreased to 5.3%
Chart 2 shows unemployment rates, Ontario and Canada, January 2014 to December 2019.
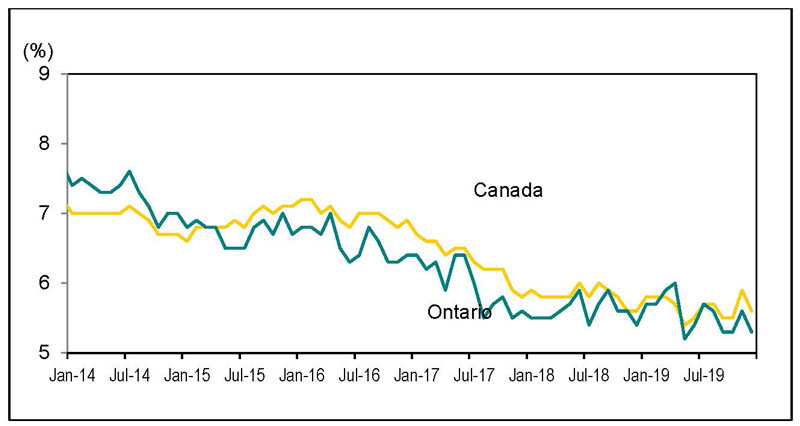
Source: Statistics Canada, Labour Force Survey, Table 14-10-0287-01, (seasonally adjusted data).
Ontario’s unemployment rate decreased to 5.3% in December from 5.6% in November, as less people were looking for work. Ontario’s unemployment rate has remained at or below 6.0% since October 2017.
Canada’s unemployment rate also decreased to 5.6% in December, down from 5.9% in November.
Unemployment rate by age
For people aged 15 to 24, the unemployment rate was 11.6% in December, down from 12.5% in November.
The unemployment rate for people aged 25 to 54 decreased to 4.5% in December from 4.7% in November and increased to 3.7% from 3.6% for those aged 55 and older.
Unemployment rate in 2019
Ontario’s unemployment rate remained unchanged at 5.6% in 2019. Nationally, Canada’s unemployment rate decreased to 5.7% in 2019 from 5.8% in 2018.
Lowest and highest unemployment rates
Chart 3 shows Census Metropolitan Areas (CMAs) with highest and lowest unemployment rates in Canada, December 2019.
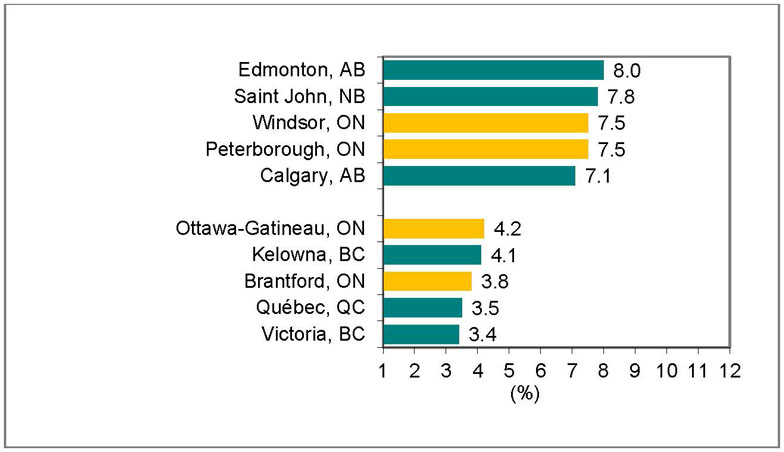
Source: Statistics Canada, Labour Force Survey, Table 14-10-0294-01, (seasonally adjusted data three-month moving average to reduce volatility caused by small sample size).
Windsor and Peterborough were tied for the highest unemployment rate in Ontario in December (7.5%), while Edmonton recorded the highest unemployment rate in Canada (8.0%).
Brantford recorded the lowest unemployment rate in Ontario in December (3.8%), while Victoria recorded the lowest unemployment rate in Canada (3.4%).
2019 and 2018 comparisons
In 2019, employment in Ontario increased by 181,700 net jobs for adults 25 years and older compared to 2018.
Employment increase and decrease by education level
Chart 4 shows Ontario employment change by highest level of education attained, aged 25 and older, 2018 to 2019.
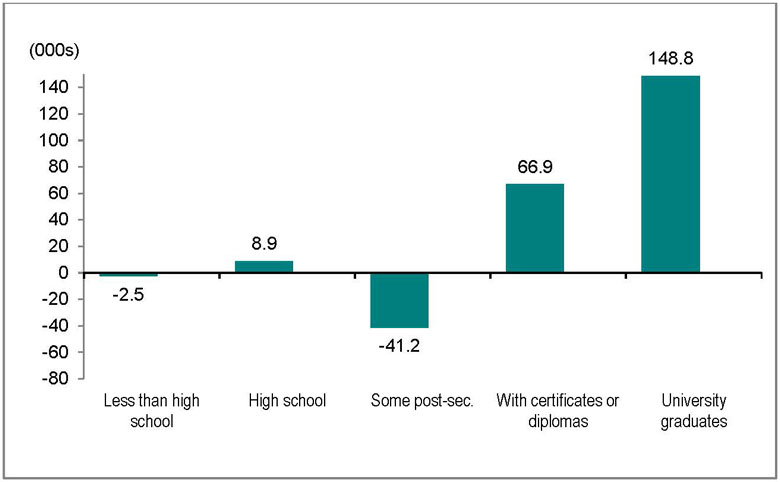
Source: Statistics Canada, Labour Force Survey, Table 14-10-0019-01, unadjusted data
Adults with a university degree led gains with 148,800 net new jobs, followed by those with a postsecondary certificate or diploma, which includes trades-related credentials (66,900).
Individuals with some postsecondary education recorded job losses of 41,200.
People with less than high school education also recorded job losses (2,500), while those with high school education recorded job gains of 8,900.
Unemployment rate by education level
The unemployment rate for adults aged 25 and older with postsecondary education credentials was 4.0% in 2019, down from 4.2% a year earlier.
The unemployment rate for adults without postsecondary education credentials was 5.8%, up from 5.6% compared to 2018.
Employment increase and decrease by occupation
Chart 5 shows Ontario employment change by occupation, 2018 to 2019.
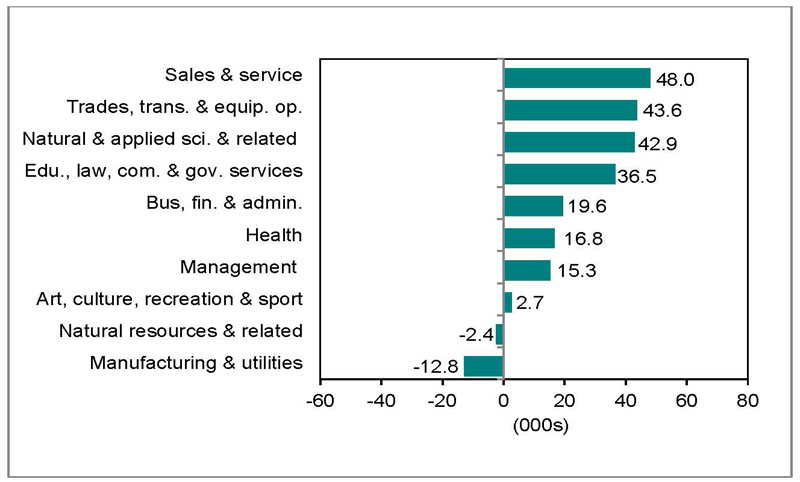
Source: Statistics Canada, Labour Force Survey, Table 14-10-0297-01, unadjusted data.
Eight of the ten major occupational groups in Ontario had net employment gains in 2019 compared to 2018.
Learn more about the National Occupational Classification (NOC) system.
These occupations gained the most jobs:
- sales and service (48,000)
- trades, transport and equipment operators (43,600)
- natural and applied sciences and related (42,900)
These occupations lost jobs:
- manufacturing and utilities (12,800)
- natural resources, agriculture and related production occupations (2,400)
Long-term unemployment decreased
Chart 6 shows Ontario's long-term unemployed (27 weeks or more) as a percentage of total unemployment, 2010 to 2019
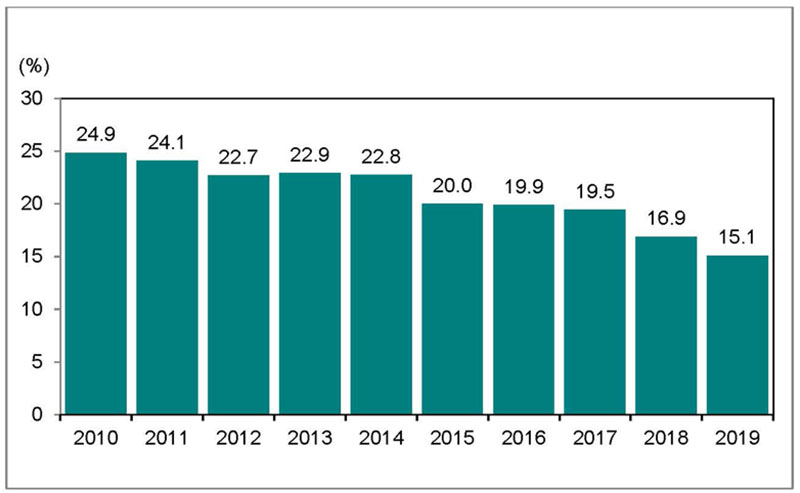
Source: Statistics Canada, Labour Force Survey, 14-10-0342-01, unadjusted data.
In 2019, an average of 66,000 people were unemployed for 27 weeks or longer, or long-term unemployed. This was down from 72,800 a year earlier.
Long-term unemployed individuals accounted for 15.1% of the total number of unemployed people in 2019. This compared with 16.9% a year earlier.
Average time in long-term unemployment
The average time in unemployment decreased to 15.9 weeks in 2019, down from 17.2 weeks in 2018.
Download data
Source: Statistics Canada, Labour Force Survey
December 2019 Labour Market Report:
- CSV, Chart 1, employment in Ontario from January 2014 to December 2019, 1 Kb
- CSV, Chart 2 unemployment rates, Ontario and Canada, January 2014 to December 2019, 2 Kb
- CSV, Chart 3 Census Metropolitan Areas (CMAs) highest and lowest unemployment rates, 2 Kb
- CSV, Chart 4, Ontario employment change by highest level of education, aged 25 and older, 99 Kb
- CSV, Chart 5, Ontario employment change by occupation 12 Kb
- CSV, Chart 6, Ontario's long-term unemployed, 15 Kb