Labour market report, December 2021
Employment in Ontario increased by 46,900 in December. Get the details in this report.
Quick facts
In December 2021:
- There were 12.4 million people in Ontario aged 15 years or older
- 8.1 million (65.6%) were in the labour force. The labour force increased in December (19,800 or 0.2%) compared to November.
- 7.7 million (61.6%) were employed, up by 46,900 (0.6%) from November.
- Ontario's unemployment rate decreased to 6.0% in December from 6.4% in November and 491,900 people were unemployed, down 5.2% (-27,200) from November.
Important note:
This report is based on the Labour Force Survey (LFS), a household survey carried out by Statistics Canada. December’s LFS results cover labour market conditions during the week of December 5 to 11.
Public health measures in place during the reference week were generally the same as those in place in November and were among the least restrictive during the COVID‑19 pandemic. The spread of the Omicron variant, and associated adjustments to public health measures, occurred after the December reference week.
Employment increased in December
Employment in Ontario increased for the seventh consecutive month in December (46,900 or 0.6%), following an increase of 68,100 (0.5%) in November.
In December, employment in Ontario was 160,600 (2.1%) above its pre-COVID‑19 February 2020 level.
Chart 1 shows employment in Ontario from January 2005 to December 2021.
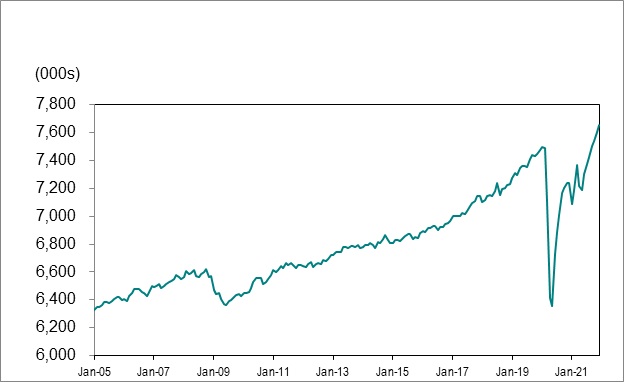
Source: Statistics Canada, Labour Force Survey, Table 14-10-0287-01, (seasonally adjusted data).
Full-time vs. part-time
Full-time jobs increased by 39,700 (0.6%) in December, while part time employment increased by 7,400 (0.5%).
Employment change by sex and age
December’s employment increase was 36,200 (0.9%) for men and 10,800 (0.3%) for women. Employment among men was 2.3% (91,900) above its pre-COVID February 2020 level and employment among women was 1.9% (68,800) above.
Youth (ages 15-24) employment increased by 18,800 (1.9%) in December, following a decline in November (-11,600 or -1.1%). Employment for people aged 25 to 54 increased by 28,500 (0.6%) in December, following an increase of 63,800 (1.3%) in November. Employment for those aged 55 and older was virtually unchanged, after increasing by 15,900 (1.0%) in November.
In December, youth employment was 1.6% (16,200) above its pre-COVID February 2020 level and employment among those aged 25-54 was 3.3% (158,900) above. Employment among those aged 55 and over was 0.9% (-14,400) below.
Employment in Canada increased by 54,700 (0.3%) in December after increasing by 157,300 (0.8%) in November.
Employment change by industry
The government’s restrictions on the types of businesses that were deemed essential and other measures aimed at addressing the impact of COVID‑19 should be considered in the context of employment change by sector.
Wholesale and retail trade (17,900 or 1.6%), manufacturing (16,200 or 2.1% and educational services (10,000 or 1.8%) led job gains in December. Information, culture and recreation (-7,300 or -2.1%), healthcare and social assistance (-5,400 or -0.6%), and agriculture (-2,800 or -4.1%) had the most net employment losses.
In December, ten of the 16 major industry groups had employment levels that were above pre-COVID February 2020 levels, led by professional, scientific and technical services (96,000 or 14.3%), wholesale and retail trade (59,200 or 5.4%) and information, culture and recreation (39,200 or 13.0%).
Employment in accommodation and food services (-50,500 or -11.4%) was furthest below its pre-COVID February 2020 level, followed by other services, excluding public administration (-45,900 or -15.1%) and business, building and other services (-31,300 or -9.7%).
Chart 2 shows industries by employment change in Ontario, February 2020 to December 2021.
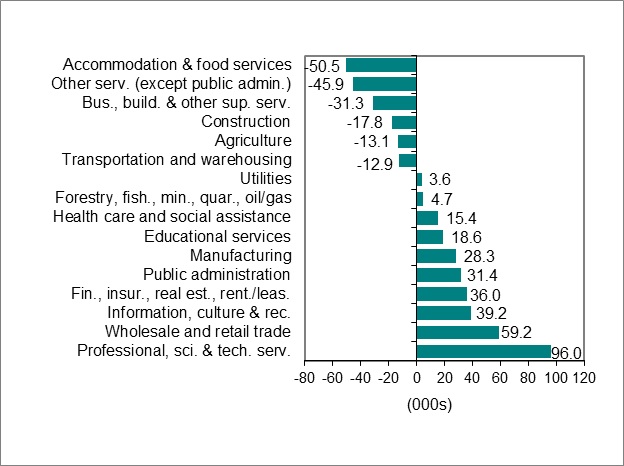
Source: Statistics Canada, Labour Force Survey, Table 14-10-0355-02, (seasonally adjusted data).
Employment in 2021
On an annual basis, employment in Ontario increased by 344,800 (4.9%) in 2021, the largest employment increase on record. This compared to a decline of 355,300 (-4.8%) net jobs in 2020.
Full-time jobs increase by 273,400 (4.7%) and part-time jobs increased by 71,300 (5.8%) in 2021.
On an annual basis, Ontario’s employment in 2021 was still below its 2019 pre-pandemic level, at 7,366,400 in 2021 compared to 7,376,900 in 2019.
Nationally, employment in Canada grew by 866,200 (4.8%) in 2021, the largest annual increase on record. The increase followed an employment decline of 986,400 (5.2%) in 2020.
Unemployment rate decreased to 6.0 %
Chart 3 shows unemployment rates, Ontario and Canada, January 2005 to December 2021.
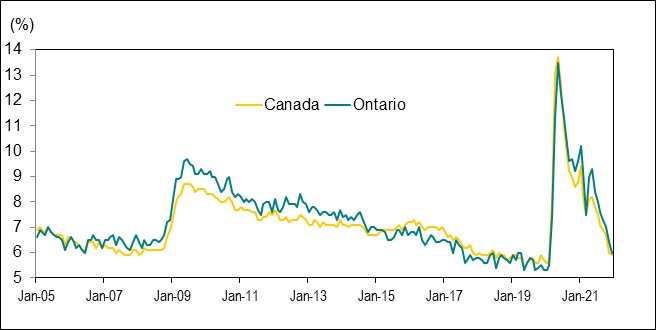
Source: Statistics Canada, Labour Force Survey, Table 14-10-0287-01, (seasonally adjusted data).
Ontario’s unemployment rate in December was 6.0%, down from 6.4% in November and was at its lowest rate since February 2020 (5.5%).
Canada’s unemployment rate fell to 5.9% in December from 6.0% in November. Canada’s unemployment rate in February 2020 was 5.7%.
Unemployment rate by sex and age
The unemployment rate for women was 5.6% in December, down from 6.2% in November, while the rate for men fell to 6.5% from 6.6% during the same period.
In Ontario, the unemployment rate among population groups designated as visible minorities was estimated at 7.4% in December in comparison to a 4.0% rate for non-visible minorities and those that did not identify as Indigenous (data are for the population aged 15 to 69 and are not adjusted for seasonality).
For individuals aged 15 to 24, the unemployment rate fell to 10.8% in December from 11.4% in November. The youth unemployment rate reached a record high of 30.0% in May 2020.
The unemployment rate for individuals aged 25 to 54 was 5.0% in December, down from 5.1% in November. The unemployment rate for those aged 55 and older decreased to 6.0% from 6.9%, driven by a decline in their labour force (-17,600 or -1.0%).
Unemployment rate in 2021
On an annual basis, Ontario’s unemployment rate was 8.0% in 2021, down from 9.6% in 2020 and well above the pre-pandemic rate of 5.6% in 2019.
Canada’s unemployment rate was 7.5% in 2021, down from 9.5% in 2020 and well above the pre-pandemic rate of 5.7% in 2019.
Long-term unemployment
In December, an average of 125,700 Ontarians or 25.6% of all unemployed people were unemployed for 27 weeks or longer (long-term unemployed). This compared to 129,500 or 24.9% of all unemployed people in November, and much higher than the pre-COVID February 2020 level of 68,800.
The average time in unemployment was 22.7 weeks in December 2021 compared to 15.9 weeks in February 2020.
Chart 4 shows the number of people unemployed for 27 week or more in Ontario, January 2005 to December 2021.
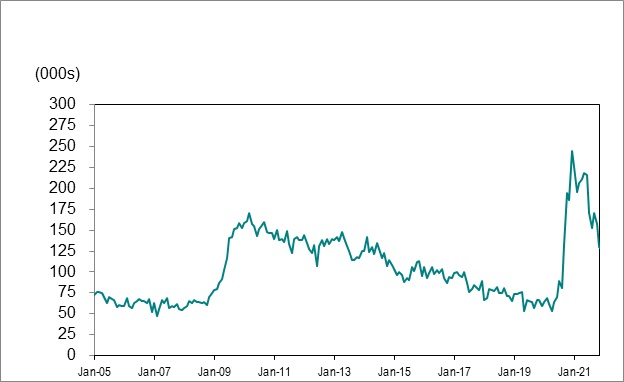
Source: Statistics Canada, Labour Force Survey, Table 14-10-0342-01, (seasonally adjusted data).
Employment and unemployment in urban centres
Employment change in urban centres
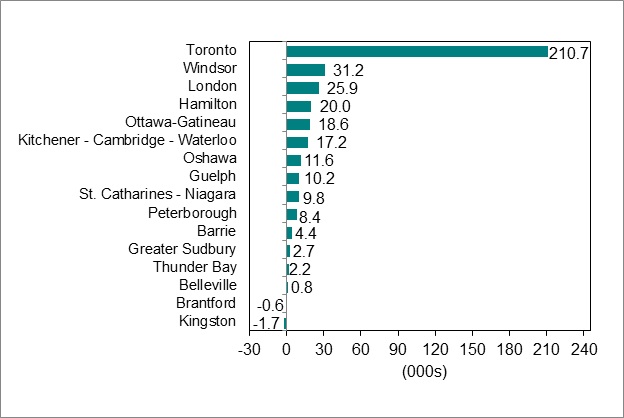
Chart 5 shows employment change for Ontario Census Metropolitan Areas (CMAs) from December 2020 to December 2021.
Source: Statistics Canada, Labour Force Survey, Table 14-10-0380-01, (seasonally adjusted data three-month moving average to reduce volatility caused by small sample size).
In December 2021, employment in most of the sixteen Ontario Census Metropolitan Areas (CMAs) was above December 2020 levels, led by Toronto (210,700 or 6.3%) and followed by Windsor (31,200 or 20.5%) and London (25,900 or 9.7%). The employment level fell in Kingston (-1,700 or 2.0%) and was unchanged in Brantford and Belleville during the period.
Employment in most of the 16 Ontario CMAs had reached pre-COVID February 2020 levels, led by Toronto (102,400 or 3.0%), London (20,900 or 7.7%) and Windsor (15,000 or 8.9%).
Ottawa-Gatineau (-15,700 or -2.7%), Barrie (-10,300 or -8.1%) and Hamilton (-4,700 or -1.1%) had employment levels that were notably below pre-COVID February 2020 levels.
Lowest and highest unemployment rates in urban centres
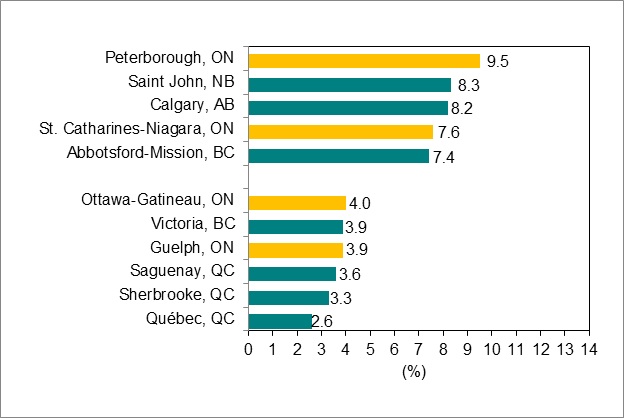
Chart 6 shows Census Metropolitan Areas (CMAs) with highest and lowest unemployment rates in Canada, December 2021.
Source: Statistics Canada, Labour Force Survey, Table 14-10-0380-02, (seasonally adjusted data three-month moving average to reduce volatility caused by small sample size).
Peterborough recorded the highest unemployment rate in Canada in December (9.5%), followed by Saint John, New Brunswick (8.3%).
Guelph recorded the lowest unemployment rate in Ontario in December (3.9%), while Quebec City recorded the lowest unemployment rate in Canada (2.6%).
Download data
Source: Statistics Canada, Labour Force Survey
December 2021 Labour Market Report:
- CSV, Chart 1, employment in Ontario from January 2005 to December 2021, 1KB
- CSV, Chart 2, industries with highest and lowest employment change in Ontario, February 2020 to December 2021, 2KB
- CSV, Chart 3, unemployment rates, Ontario and Canada, January 2005 to December 2021, 2KB
- CSV, Chart 4, number of people unemployed for 27 week or more in Ontario, January 2005 to December 2021, 2KB
- CSV, Chart 5, employment change for Ontario Census Metropolitan Areas (CMAs) from December 2020 to December 2021, 2KB
- CSV, Chart 6, Census Metropolitan Areas (CMAs) highest and lowest unemployment rates, December 2021, 2KB