Labour market report, February 2020
Employment in Ontario changed little in February. Get the details in this report.
Quick facts
In February 2020:
- There were 12.3 million people in Ontario aged 15 years or older
- 8.0 million (65%) were either working or actively looking for work
- 7.6 million (62%%) were employed and 82% of them had a full-time job
- Ontario's unemployment rate was 5.5% (436,400 unemployed people)
Employment little changed in February
Employment in Ontario was little changed in February after increasing by 15,900 jobs in January.
Chart 1 shows employment in Ontario from February 2015 to February 2020.
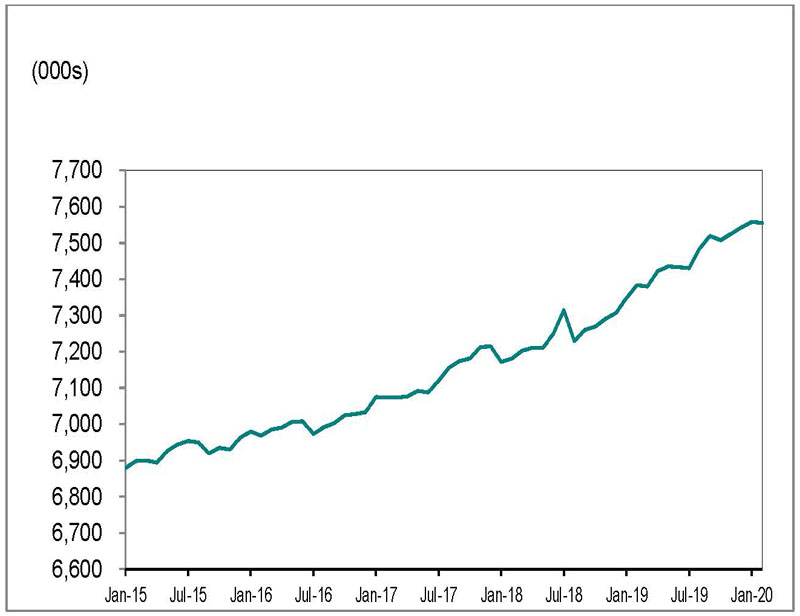
Source: Statistics Canada, Labour Force Survey, Table 14-10-0287-01, (seasonally adjusted data).
Full-time vs. part-time
Full-time employment increased by 20,300, while part-time employment declined by 23,500.
Employment increase/decrease by age
Youth employment (those aged 15 to 24) declined by 7,600 in February, after increasing by 17,200 jobs in January.
Employment for people aged 25 to 54 declined by 7,000 in February, compared to January. Employment for those aged 55 and older increased by 11,400 jobs.
Employment in Canada increased in February (30,300), following an increase of 34,500 jobs in January.
Unemployment rate increased to 5.5%
Chart 2 shows unemployment rates, Ontario and Canada, January 2015 to February 2020.
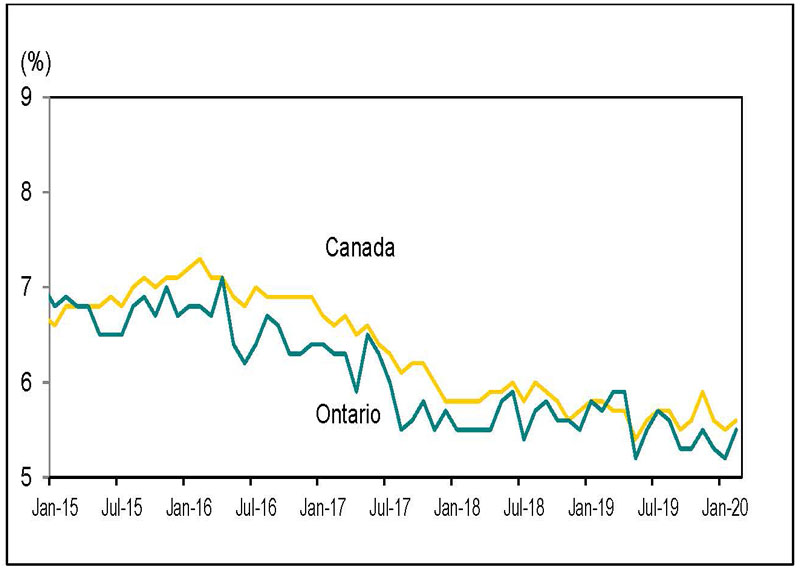
Source: Statistics Canada, Labour Force Survey, Table 14-10-0287-01, (seasonally adjusted data).
Ontario’s unemployment rate increased to 5.5% in February from 5.2% in January. The unemployment rate in Ontario has been below 6% since August 2017.
Canada’s unemployment rate increased to 5.6% in February from 5.5% in January.
Unemployment rate by age
For individuals aged 15 to 24, the unemployment rate was 11.0% in February, up from the lowest youth unemployment rate in close to 30 years of 10.2% in January.
The unemployment rate for individuals aged 25 to 54 increased to 4.8% in February from 4.7% in January and to 3.9% from 3.6% for those aged 55 and older.
Lowest and highest unemployment rates
Chart 3 shows Census Metropolitan Areas (CMAs) with highest and lowest unemployment rates in Canada, February 2020.
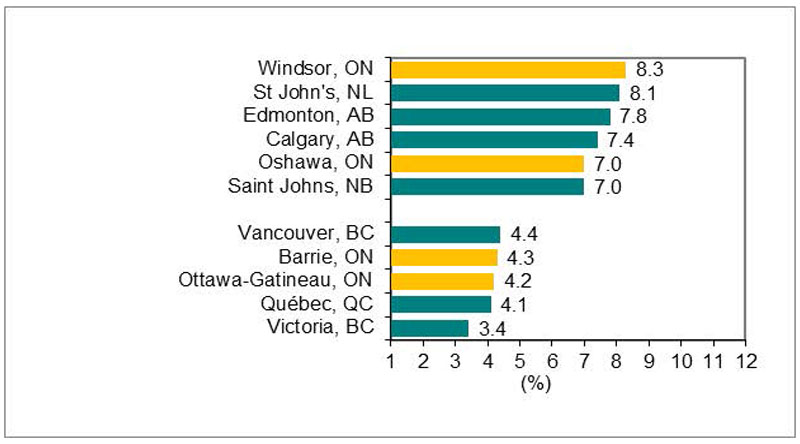
Source: Statistics Canada, Labour Force Survey, Table 14-10-0294-01, (seasonally adjusted data three-month moving average to reduce volatility caused by small sample size).
Windsor recorded the highest unemployment rate in Canada in February (8.3%), while Oshawa was tied with Saint John, New Brunswick for the fifth highest rate (7.0%).
Ottawa-Gatineau recorded the lowest unemployment rate in Ontario in February (4.2%), while Victoria recorded the lowest unemployment rate in Canada (3.4%)
Year-over-year comparisons
Over the first two months of 2020, employment in Ontario increased by 154,500 net jobs for adults 25 years and older compared to the first two months of 2019.
Employment increase and decrease by education level
Chart 4 shows Ontario employment change by highest level of education attained, aged 25 and older, February 2019 year-to-date to February 2020 year-to-date.
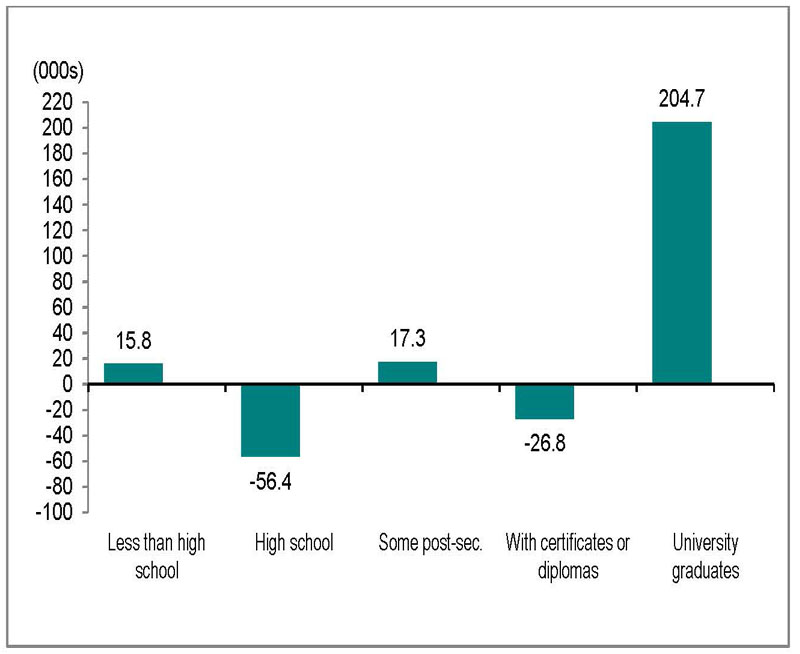
Source: Statistics Canada, Labour Force Survey, Table 14-10-0019-01, unadjusted data.
Adults with a university degree led gains with 204,700 net new jobs.
Individuals with less than high school and some postsecondary education recorded job gains of 15,800 and 17,300, respectively.
People with high school education recorded job losses of 56,400, as did those with a postsecondary certificate or diploma (26,800).
Unemployment rate by education level
The unemployment rate for adults aged 25 and older with postsecondary education credentials was 4.3% in the first two months of 2020, up from 4.2% a year earlier. The unemployment rate for adults without postsecondary education credentials was 5.6%, down from 6.3% compared to a year ago.
Employment increase and decrease by occupation
Chart 5 shows Ontario employment change by occupation, February 2019 year-to-date to February 2020 year-to-date.
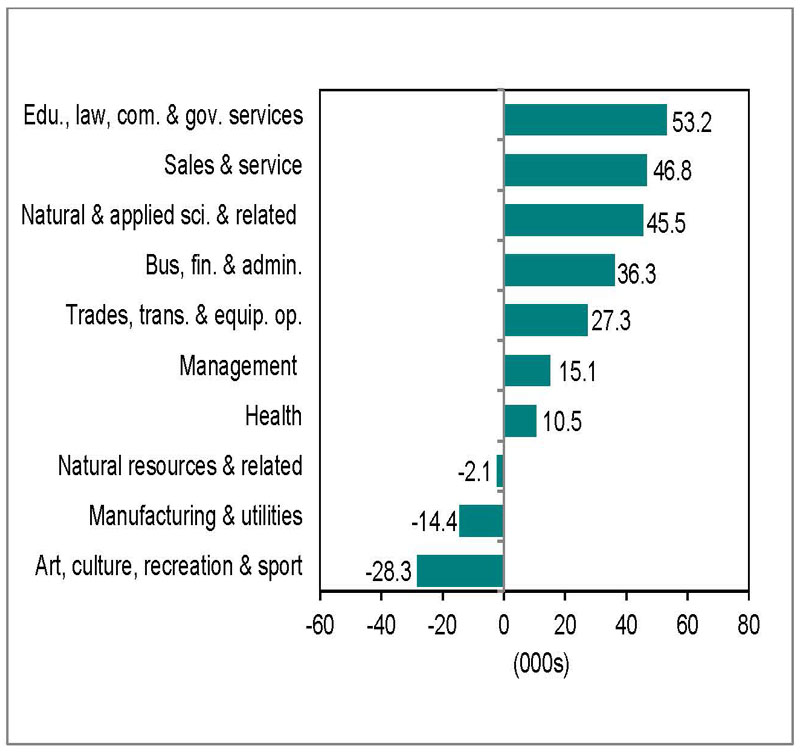
Source: Statistics Canada, Labour Force Survey, Table 14-10-0297-01, unadjusted data.
Seven of the ten major occupational groups in Ontario had net employment gains in first two months of 2020 compared to a year ago.
Learn more about the National Occupational Classification (NOC) system.
These occupations gained the most jobs:
- education, law and social, community and government services (53,200)
- sales and service (46,800)
- natural and applied sciences and related (45,500)
These occupations lost jobs:
- art, culture, recreation and sport (28,300)
- manufacturing and utilities (14,400)
- natural resources, agriculture and related production occupations (2,100)
Long-term unemployment share decreased
Chart 6 shows Ontario's long-term unemployed (27 weeks or more) as a percentage of total unemployment, February 2011 year-to-date February 2020 year-to-date
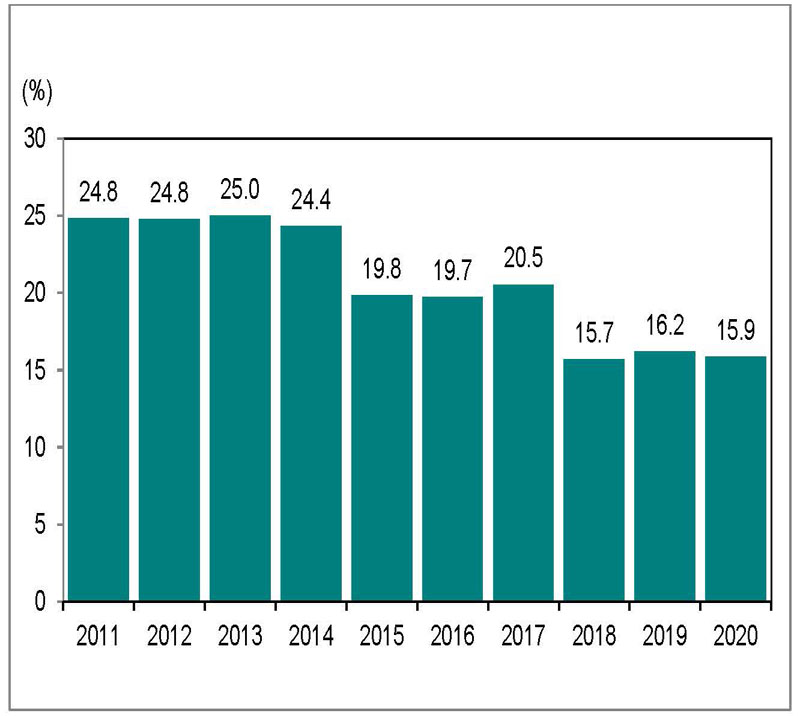
Source: Statistics Canada, Labour Force Survey, 14-10-0342-01, unadjusted data.
Over the first two months of 2020, an average of 67,200 people were unemployed for 27 weeks or longer, or long-term unemployed. This was down from 72,000 a year earlier.
Long-term unemployed individuals accounted for 15.9% of the total number of unemployed people in first two months of 2020. This compared with 16.2% a year earlier.
Average time in long-term unemployment
The average time in unemployment increased to 16.5 weeks over the first two months of 2020 from 16.3 weeks a year earlier.
Download data
Source: Statistics Canada, Labour Force Survey
February 2020 Labour Market Report:
- CSV, Chart 1, employment in Ontario from January 2015 to February 2020, 1 Kb
- CSV, Chart 2, unemployment rates, Ontario and Canada, January 2015 to February 2020, 2 Kb
- CSV, Chart 3, Census Metropolitan Areas (CMAs) highest and lowest unemployment rates, 2 Kb
- CSV, Chart 4, Ontario employment change by highest level of education, aged 25 and older, 99 Kb
- CSV, Chart 5, Ontario employment change by occupation 12 Kb
- CSV, Chart 6, Ontario's long-term unemployed, 15 Kb