Labour Market Report, July 2017
Employment in Ontario increased in July. Get the details in this report.
Employment increased in July
Employment in Ontario increased by 25,500 jobs in July, following a decrease of 6,100 jobs in June.
Chart 1 shows employment in Ontario from January 2012 to July 2017.
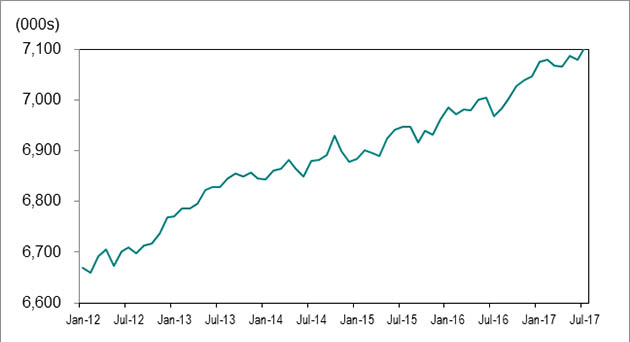
Source: Statistics Canada, Labour Force Survey, Table 282-0087, (seasonally adjusted data).
Full-time vs. part-time
There were 17,600 new full-time jobs in July. Part-time employment increased by 7,900.
Employment increase/decrease by age
Youth employment (those aged 15 to 24) increased by 8,600 jobs in July, after decreasing by 9,100 jobs in June.
People aged 25 to 54 had job losses of 8,900, while those 55 and older gained 26,000 jobs.
Employment in Canada rose by 10,900 jobs in July and was little changed. This follows a gain of 45,300 jobs the previous month.
Unemployment rate declined to 6.1%
Chart 2 shows unemployment rates, Ontario and Canada, January 2012 to July 2017.
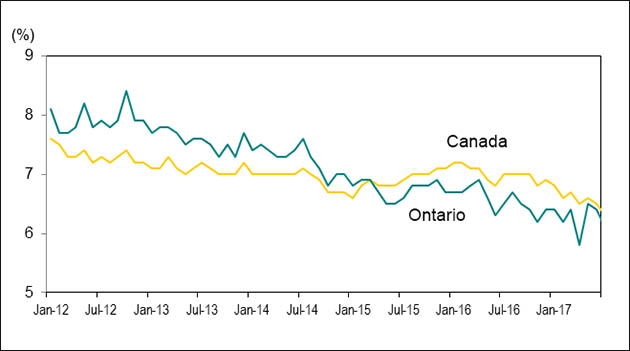
Source: Statistics Canada, Labour Force Survey, Table 282-0087, (seasonally adjusted data).
Decline in unemployment rate for youth
The unemployment rate for youth (those aged 15 to 24) declined to 11.9% in July from 13.1% in June.
Unemployment rate for adults
The unemployment rate for people aged 25 to 54 increased to 5.4% in July from 5.2% in June. For those 55 and older, the unemployment rate fell to 4.7% from 5.3%.
Ontario’s unemployment rate declined to 6.1% in July from 6.4% in June.
Canada’s unemployment rate decreased to 6.3% in July from 6.5% in June.
Lowest and highest unemployment rates
Chart 3 shows Census Metropolitan Areas (CMAs) with highest and lowest unemployment rates in Canada, July 2017.
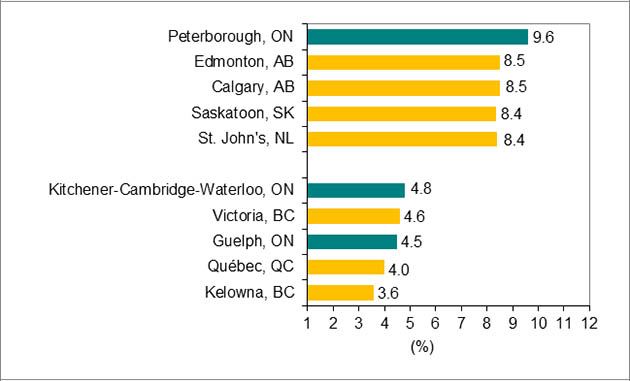
Source: Statistics Canada, Labour Force Survey, Table 282-0135, (seasonally adjusted data to reduce volatility caused by small sample size).
Guelph, in southwestern Ontario, had the lowest unemployment rate (4.5%) for July in Ontario. Kelowna, British Columbia had the lowest rate (3.6%) in Canada.
Peterborough, Ontario had the highest unemployment rate in July in Canada, at 9.6%.
Year-over-year comparisons
In the first seven months of 2017, employment in Ontario increased by an estimated 90,100 jobs for adults 25 years and older compared to the first seven months of 2016.
Employment increase and decrease by education level
Chart 4 shows Ontario employment change by highest level of education attained, aged 25 and older, July 2016 and July 2017, year-to-date.
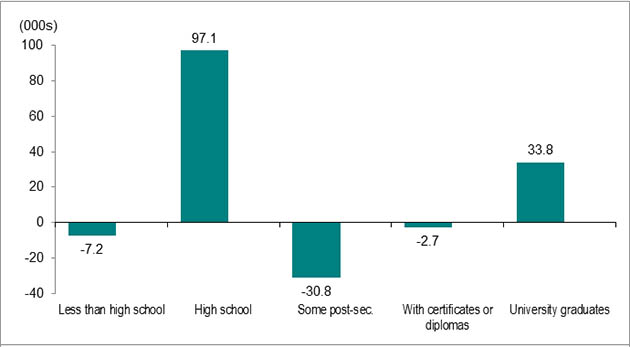
Source: Statistics Canada, Labour Force Survey, Table 282-0003, unadjusted data.
People with a high school level education gained the most jobs, with 97,100 net new jobs.
Those with a university degree had job gains of 33,800, while those with a postsecondary education (PSE) certificate or diploma lost 2,700 jobs.
People with less than high school education had job losses of 7,200 and those with some PSE had job losses of 30,800.
Unemployment rate by education level
The unemployment rate for adults aged 25 and older with PSE credentials was 4.5% over the first seven months of 2017, down from 4.8% a year earlier.
The unemployment rate for adults without PSE credentials was 7.4%, up from 7.3% a year earlier.
Employment increase and decrease by occupation
Chart 5 shows Ontario employment change by occupation, between July 2016 and July 2017, year-to-date.
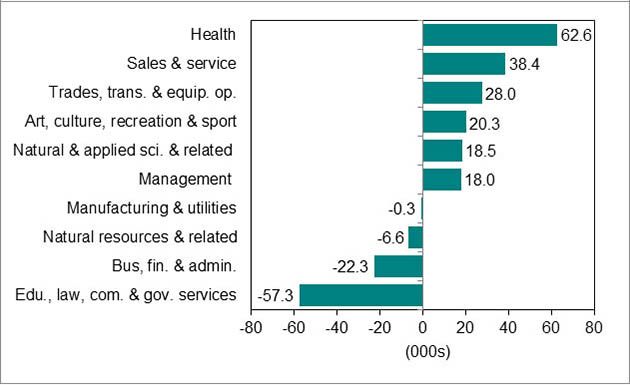
Source: Statistics Canada, Labour Force Survey, Table 282-0041, unadjusted data.
Six of the ten major occupational groups in Ontario had employment growth over the first seven months of 2017 compared to a year earlier.
Learn more about the National Occupation Classification (NOC) system.
These occupations gained the most jobs:
- Health (62,600)
- Sales and service (38,400) occupations
- Trades, transport and equipment operators and related (28,000)
These occupations lost jobs:
- Education, law and social, community and government services (57,300)
- Business, finance and administration (22,300)
- Natural resources, agriculture and related production (6,600) occupations
Long-term unemployment percentage increased
Chart 6 shows Ontario’s long-term unemployed (27 weeks or more) as a percent of total unemployment, July 2009 to July 2017, year-to-date.
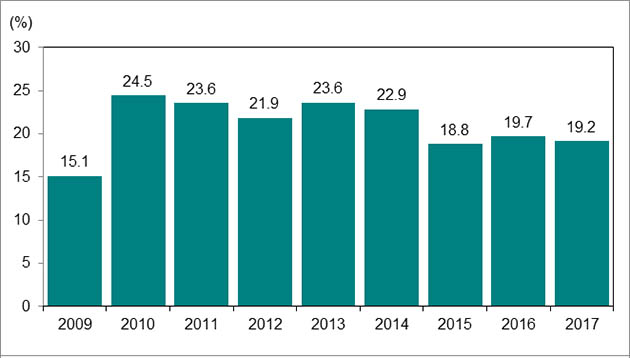
Source: Statistics Canada, Labour Force Survey, Table 282-0047, unadjusted data.
Over the first seven months of 2017, an estimated 92,500 people were unemployed for 27 weeks or more, or in long-term unemployment. This was down from 100,100 in the first seven months of 2016 and well above pre-recessionary levels.
Long-term unemployed individuals accounted for 19.2% of the total number of unemployed people in the first seven months of 2017. Compare this with 19.7% a year earlier and a long-term unemployment rate of 15.1% in the first seven months of 2009.
Average time in long-term unemployment
The average time in unemployment decreased to 19.1 weeks over the first seven months of 2017 from 19.9 weeks a year earlier.
Download data
Source: Statistics Canada, Labour Force Survey
July 2017 Labour Market Report:
- CSV, Chart 1, employment in Ontario from January 2012 to July 2017, 1Kb
- CSV, Chart 2 unemployment rates, Ontario and Canada, January 2012 to July 2017, 2Kb
- CSV, Chart 3 Census Metropolitan Areas (CMAs) highest and lowest unemployment rates, 2Kb
- CSV, Chart 4, Ontario employment change by highest level of education, aged 25 and older, 99Kb
- CSV, Chart 5, Ontario employment change by occupation, 12Kb
- CSV, Chart 6, Ontario’s long-term unemployed, 15Kb