Labour market report, September 2017
Employment in Ontario increased in September. Get the details in this report.
Quick facts
In September 2017, there were 11.7 million people in Ontario aged 15 years or older, 7.6 million, or (65%), were either working or actively looking for work. Of this population, 7.2 million, or 61%, were employed and 80% of them had a full time job.
Ontario’s unemployment rate was 5.6%, with 428,900 unemployed people.
Employment increased in September
Employment in Ontario increased by 34,700 jobs in September, following an increase of 31,100 jobs in August.
Chart 1 shows employment in Ontario from January 2012 to September 2017.
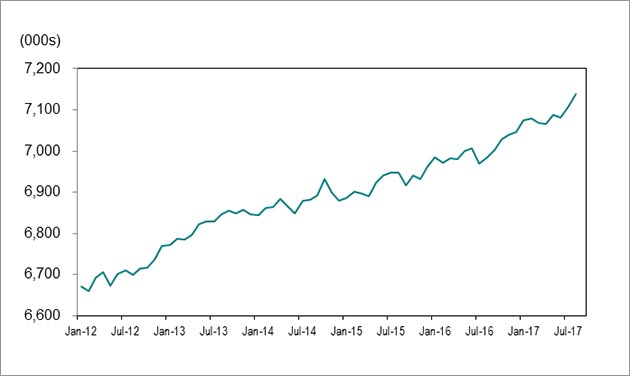
Source: Statistics Canada, Labour Force Survey, Table 282-0087, (seasonally adjusted data).
Full-time vs. part-time
There were 77,800 new full-time jobs in September. Part-time employment declined by 43,300.
Employment increase/decrease by age
Youth employment (those aged 15 to 24) increased by 8,800 jobs in September, following an increase of 8,000 jobs in August.
People aged 25 to 54 had job gains of 1,700, while those 55 and older gained 24,200 jobs.
Employment in Canada was little change in September (10,100), following an increase of 22,200 jobs in August.
Unemployment rate declined to 5.6%
Chart 2 shows unemployment rates, Ontario and Canada, January 2012 to September 2017.
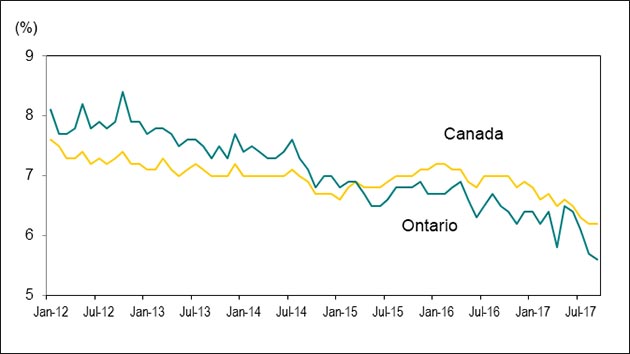
Source: Statistics Canada, Labour Force Survey, Table 282-0087, (seasonally adjusted data).
No change in unemployment rate for youth
The unemployment rate for youth (those aged 15 to 24) remained at 10.6% in September.
Unemployment rate for adults
Ontario’s unemployment rate declined to 5.6% in September from 5.7% in August.
Canada’s unemployment rate remained at 6.2% in September.
The unemployment rates for people aged 25 to 54 was 5.1% and for those 55 and older, it was 4.0%, both unchanged in September, compared to August.
Lowest and highest unemployment rates
Chart 3 shows Census Metropolitan Areas (CMAs) with highest and lowest unemployment rates in Canada, September 2017.
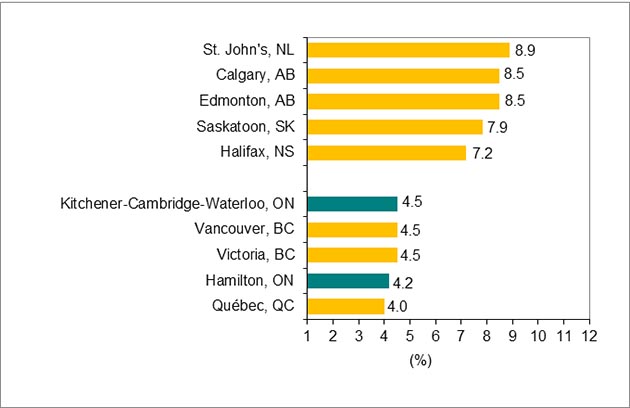
Source: Statistics Canada, Labour Force Survey, Table 282-0135, (seasonally adjusted data to reduce volatility caused by small sample size).
Hamilton (4.2%) recorded the lowest unemployment rate in Ontario in September and the second lowest rate in Canada (behind Québec City).
St. John’s, Newfoundland (8.9%) recorded the highest unemployment rate in Canada, while Peterborough (7.1%) had the highest rate in Ontario.
Year-over-year comparisons
In the first nine months of 2017, employment in Ontario increased by an estimated 98,800 jobs for adults 25 years and older compared to the first nine months of 2016.
Employment increase and decrease by education level
Chart 4 shows shows Ontario employment change by highest level of education attained, aged 25 and older, September 2016 and September 2017, year-to-date.
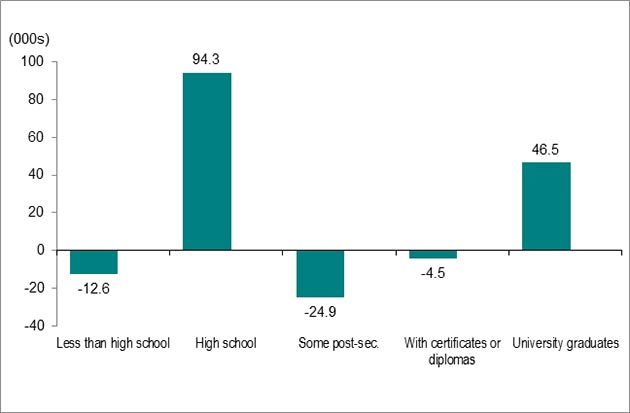
Source: Statistics Canada, Labour Force Survey, Table 282-0003, unadjusted data.
People with a high school level education gained the most jobs, with 94,300 net new jobs.
Those with a university degree had job gains of 46,500, while those with a postsecondary education (PSE) certificate or diploma lost 4,500 jobs.
People with less than high school education had job losses of 12,600 and those with some PSE had job losses of 24,900.
Unemployment rate by education level
The unemployment rate for adults aged 25 and older with PSE credentials was 4.5% over the first nine months of 2017, down from 4.9% a year earlier.
The unemployment rate for adults without PSE credentials was 6.7%, down from 7.0% a year earlier.
Employment increase and decrease by occupation
Chart 5 shows Ontario employment change by occupation, between September 2016 and September 2017, year-to-date.
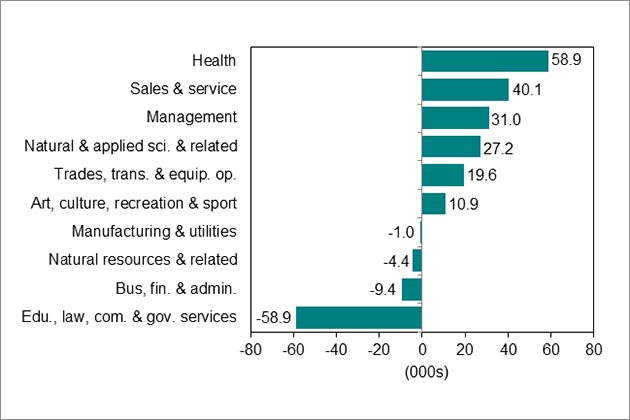
Source: Statistics Canada, Labour Force Survey, Table 282-0041, unadjusted data.
Six of the ten major occupational groups in Ontario had employment growth over the first eight months of 2017 compared to a year earlier.
Learn more about the National Occupation Classification (NOC) system.
These occupations gained the most jobs:
- Health (58,900)
- Sales and service (40,100)
- Management (31,100)
These occupations lost jobs:
- Education, law and social, community and government services (58,900)
- Business, finance and administration (9,400)
- Natural resources, agriculture and related production (4,400) occupations
Long-term unemployment decreased
Chart 6 shows Ontario’s long-term unemployed (27 weeks or more) as a percent of total unemployment, September 2009 to September 2017, year-to-date.
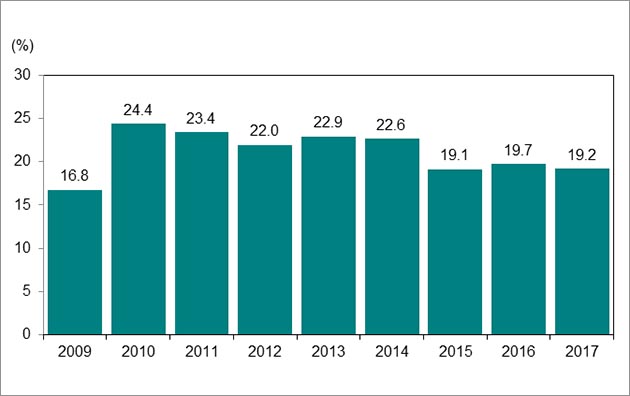
Source: Labour Force Survey, Table 282-0047, unadjusted data.
Over the first eight months of 2017, an estimated 91,000 people were unemployed for 27 weeks or more, or in long-term unemployment. This was down from 100,700 in the first eight months of 2016 and well above pre-recessionary levels.
Long-term unemployed individuals accounted for 19.2% of the total number of unemployed people in the first nine months of 2017. Compare this with 19.7% a year earlier and a long-term unemployment rate of 16.8% in the first nine months of 2009.
Average time in long-term unemployment
The average time in unemployment decreased to 19.1 weeks over the first nine months of 2017 from 19.9 weeks a year earlier.
Download data
Source: Statistics Canada, Labour Force Survey
September 2017 Labour Market Report:
- CSV, Chart 1, employment in Ontario from January 2012 to September 2017, 1Kb
- CSV, Chart 2 unemployment rates, Ontario and Canada, January 2012 to September 2017, 2Kb
- CSV, Chart 3 Census Metropolitan Areas (CMAs) highest and lowest unemployment rates, 2Kb
- CSV, Chart 4, Ontario employment change by highest level of education, aged 25 and older, 99Kb
- CSV, Chart 5, Ontario employment change by occupation 12Kb
- CSV, Chart 6, Ontario’s long-term unemployed, 15Kb