Labour market report, September 2021
Employment in Ontario increased by 73,600 in September. Get the details in this report.
Quick facts
In September 2021:
- There were 12.4 million people in Ontario aged 15 years or older
- 8.1 million (65.4%) were in the labour force. The labour force increased in September (57,700 or 0.7%) compared to August.
- 7.5 million (60.6%) were employed, up by 73,600 (1.0%) from August.
- Ontario's unemployment rate decreased to 7.3% in September from 7.6% in August and 591,600 people were unemployed, down 2.6% (-15,900) from August.
Important note:
This report is based on the Labour Force Survey (LFS), a household survey carried out by Statistics Canada. September’s LFS results cover labour market conditions during the week of September 12 to 18.
Ontario’s mandatory closure of non-essential businesses and other measures aimed at addressing the impact of COVID‑19 took effect on March 24, 2020.
Ontario moved to Step 3 of the province’s reopening plan on July 16, which includes the resumption of indoor dining, entertainment and recreational activities. Public health and workplace safety measures are in place for specific sectors and settings in Step 3.
Effective September 25, capacity limits were increased in many indoor venues (e.g., movie theatres and concert venues) where proof of vaccination is required, as well as in certain outdoor event venues
The types of businesses that were deemed essential and remained open during the COVID‑19 economic shutdown and the types of businesses that reopened at the different stages of the Ontario government’s plan for reopening the economy should be considered in the context of information provided in this report.
Employment increased in September
Employment in Ontario increased for the fourth consecutive month in September (73,600 or 1.0%) in September, following an increase of 53,000 (0.7%) in August.
In September, employment in Ontario was above (0.1% or 8,600) its pre-COVID-19 February for the first time since the pandemic.
Chart 1 shows employment in Ontario from January 2005 to September 2021.
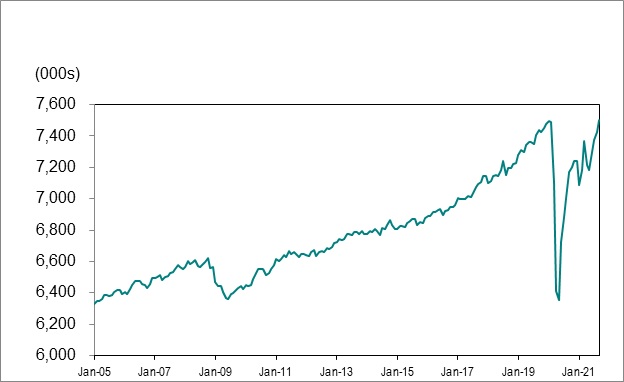
Source: Statistics Canada, Labour Force Survey, Table 14-10-0287-01, (seasonally adjusted data).
Full-time vs. part-time
Full-time jobs (135,500 or 2.2%) accounted for all of the job increase in September. Part-time jobs (-61,900 or -4.4%) decreased.
Employment change by sex and age
September’s employment increase was 39,700 (1.1%) for women and 34,000 (0.9%) for men. With September’s gains, employment among women was 0.6% (22,800) above its pre-COVID February 2020 level and employment among men was behind (-0.4% or 14,100).
Youth employment (ages 15-24) increased by 18,800 (1.9%) in September, following an increase of 26,500 (2.7%) in August. Employment for people aged 25 to 54 increased by 53,700 (1.1%) in September, following an increase of 8,500 (0.2%) in August. Employment for those aged 55 and older was virtually unchanged in September, following a decrease of 18,200 (1.1%) in August.
In September, youth employment remained behind (-0.9% or -9,100) its pre-COVID February 2020 level. Employment among those aged 25-54 was above its pre-COVID February 2020 level (1.0% or 48,500), while employment among those aged 55 and over was 1.8% (-30,800) behind.
Employment in Canada increased by 157,100 (0.8%) in September after increasing by 90,200 (0.5%) in August and was at its pre-COVID February 2020 level.
Employment change by industry
The government’s restrictions on the types of businesses that were deemed essential and other measures aimed at addressing the impact of COVID‑19 should be considered in the context of employment change by sector.
Information, culture and recreation (33,800 or 11.3%) and financial, insurance, real estate, rental and leasing (20,100 or 3.3%) led job gains in September. Accommodation and food services (-15,200 or -3.7%) and other services, except public administration (-7,500 or -2.8%) reported the most job losses.
In September, half of the 16 major industry groups reported employment level that were above pre-COVID February 2020 levels, led by professional, scientific and technical services (98,800 or 14.7%), public administration (34,000 or 8.7%) and information, culture and recreation (29,600 or 9.8%).
Employment in other services (except public administration) was furthest behind its pre-COVID February 2020 level (-46,700 or -15.3%), followed by accommodation and food services (-44,800 or -10.1%) and construction (-29,700 or -5.3%).
Chart 2 shows industries by employment change in Ontario, February 2020 to September 2021.
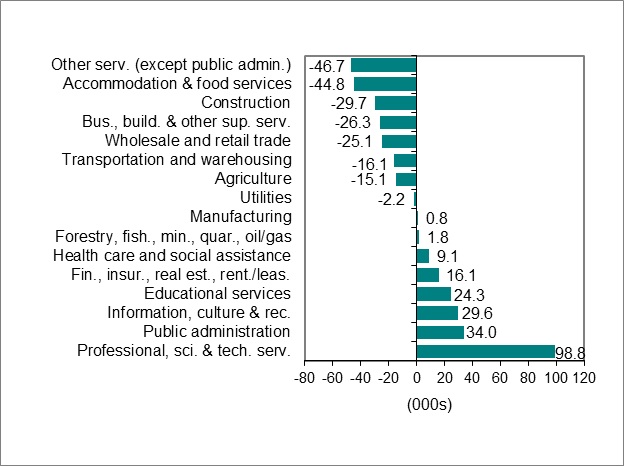
Source: Statistics Canada, Labour Force Survey, Table 14-10-0355-02, (seasonally adjusted data).
Unemployment rate decreased to 7.3%
Chart 3 shows unemployment rates, Ontario and Canada, January 2005 to September 2021
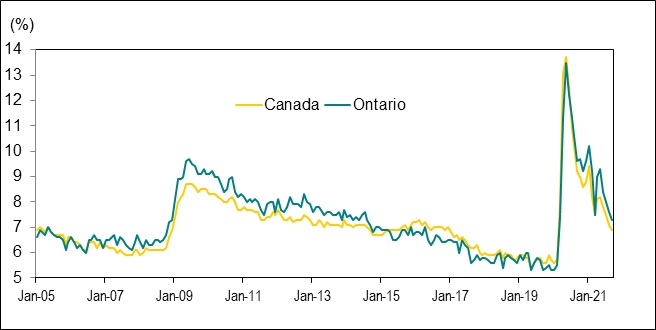
Source: Statistics Canada, Labour Force Survey, Table 14-10-0287-01, (seasonally adjusted data).
Ontario’s unemployment rate in September was 7.3%, down from 7.6% in August and was at its lowest rate since March 2020 (7.4%). The unemployment rate in February 2020 was 5.5%.
Canada’s unemployment rate fell to 6.9% in September from 7.1% in August. Canada’s unemployment rate in February 2020 was 5.7%.
Unemployment rate by sex and age
The unemployment rate for women was 6.8% in September, down from 7.1% in August, while the rate for men fell to 7.8% from 8.0% during the same period.
In Ontario, the unemployment rate among population groups designated as visible minorities was estimated at 8.5% in September in comparison to a 6.1% rate for non-visible minorities and those that did not identify as Indigenous (data are for the population aged 15 to 69 and are not adjusted for seasonality).
For individuals aged 15 to 24, the unemployment rate decreased to 12.5% in September from 13.8% in August. The youth unemployment rate reached a record high of 30.0% in May 2020.
The unemployment rate for individuals aged 25 to 54 was 6.4% in September, up from 6.3% in August, while the rate for those aged 55 and older decreased to 6.6% from 7.1%.
Long-term unemployment
In September, an average of 169,800 Ontarians or 28.7% of all unemployed people were unemployed for 27 weeks or longer (long-term unemployed). This was up from 152,900 or 25.2% in August and about two and a half times the pre-COVID February 2020 level of 68,800.
The average time in unemployment was 24.9 weeks in September 2021 compared to 15.9 weeks in February 2020.
Chart 4 shows the number of people unemployed for 27 week or more in Ontario, January 2005 to September 2021.
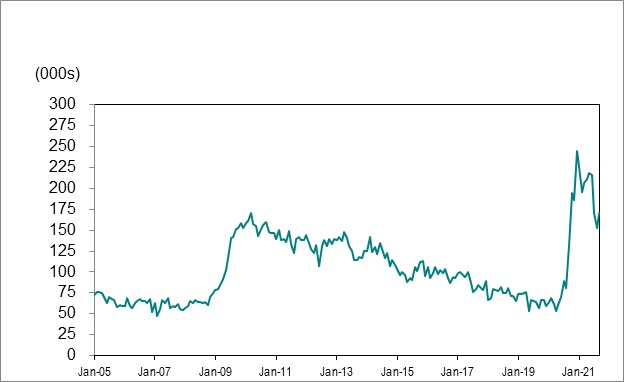
Source: Statistics Canada, Labour Force Survey, Table 14-10-0342-01, (seasonally adjusted data).
Employment and unemployment in urban centres
Employment change in urban centres
Chart 5 shows employment change for Ontario Census Metropolitan Areas (CMAs) from August 2021 to September 2021.
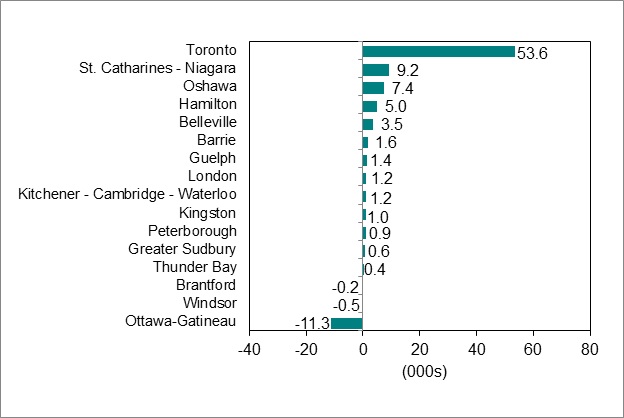
Source: Statistics Canada, Labour Force Survey, Table 14-10-0380-01, (seasonally adjusted data three-month moving average to reduce volatility caused by small sample size).
Toronto (53,600 or 1.6%) led employment gains among the sixteen Ontario Census Metropolitan Areas (CMAs) between August and September, followed by St. Catharines-Niagara (9,200 or 4.6%) and Oshawa (7,400 or 3.6%). Employment level notably fell in Ottawa-Gatineau (Ontario part) (-11,300 or -1.9%).
In September, employment in most of the 16 Ontario CMAs was close to or above pre-COVID February 2020 levels, led by London (12,100 or 4.5%), Guelph (8,300 or 9.6%) and Peterborough (6,300 or 10.9%).
Kitchener-Cambridge-Waterloo (-12,400 or -3.7%), Barrie (-7,800 or -6.2%), Belleville (-7,700 or -13.2%) and Greater Sudbury (-5,400 or -6.2%) reported employment estimates that were notably behind pre-COVID February 2020 levels.
Lowest and highest unemployment rates in urban centres
Chart 6 shows Census Metropolitan Areas (CMAs) with highest and lowest unemployment rates in Canada, September 2021.
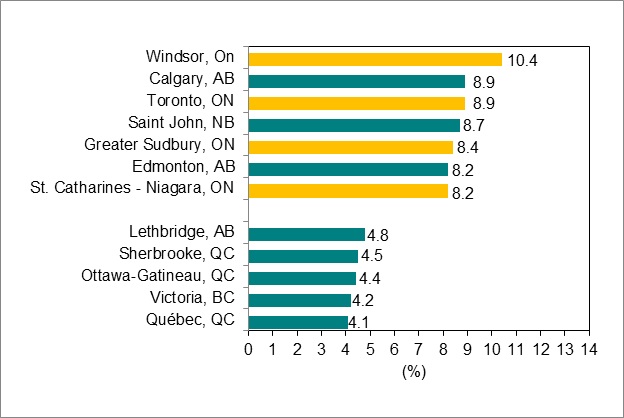
Source: Statistics Canada, Labour Force Survey, Table 14-10-0380-02, (seasonally adjusted data three-month moving average to reduce volatility caused by small sample size).
Windsor recorded the highest unemployment rate in Canada in September (10.4%), followed by Toronto and Calgary, both at 8.9%.
Ottawa-Gatineau (Ontario part) recorded the lowest unemployment rate in Ontario in September (5.9%), while Quebec City recorded the lowest unemployment rate in Canada (4.1%).
Download data
Source: Statistics Canada, Labour Force Survey
July 2021 Labour Market Report:
- CSV, Chart 1, employment in Ontario from January 2005 to September 2021, 1Kb
- CSV, Chart 2, industries with highest and lowest employment change in Ontario, February 2020 to September 2021, 2Kb
- CSV, Chart 3, unemployment rates, Ontario and Canada, January 2005 to September 2021, 2Kb
- CSV, Chart 4, number of people unemployed for 27 week or more in Ontario, January 2005 to September 2021, 2Kb
- CSV, Chart 5, employment change for Ontario Census Metropolitan Areas (CMAs) from August 2021 to September 2021, 2Kb
- CSV, Chart 6, Census Metropolitan Areas (CMAs) highest and lowest unemployment rates, September 2021, 2Kb