Ontario Economic Accounts
Learn about Ontario's economic performance and outlook for the first quarter of 2026.
View the related data tables at Ontario's Open Data Catalogue.
Highlights
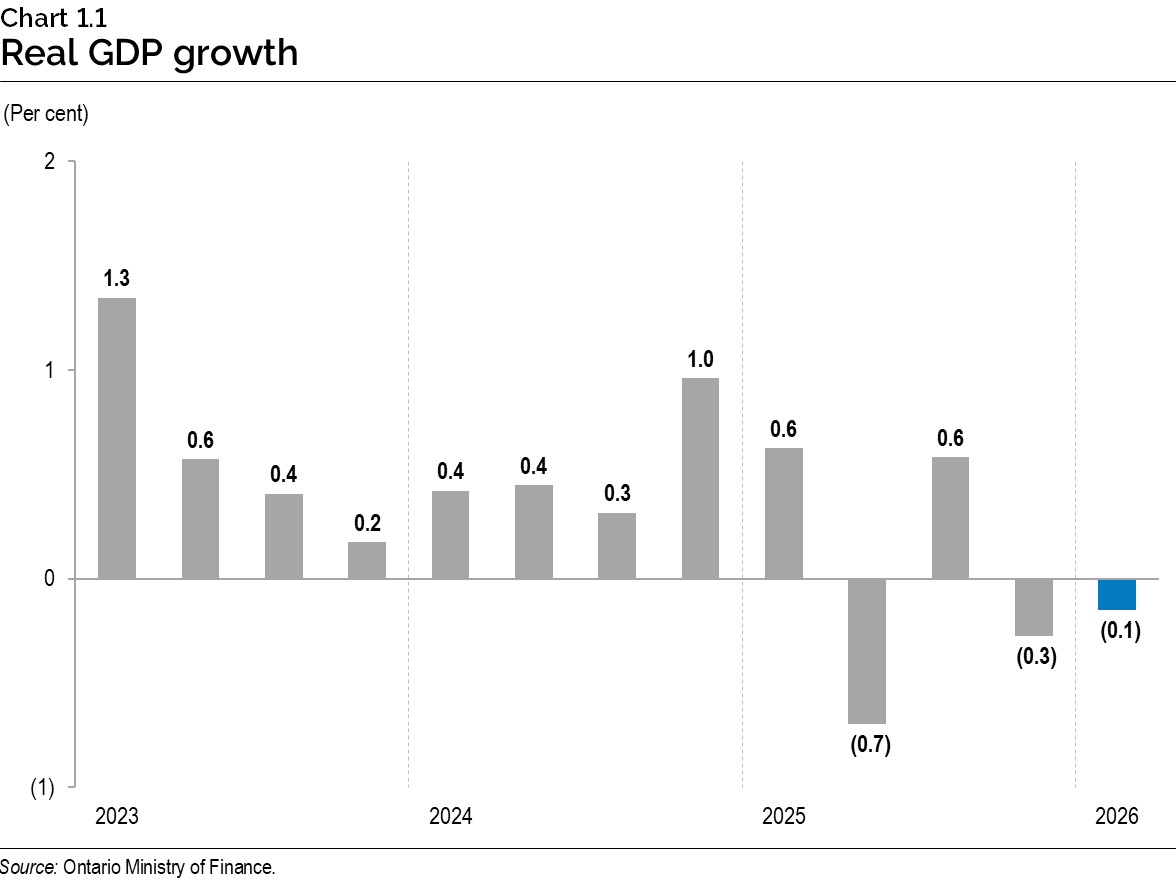
- Ontario’s real gross domestic product (GDP) declined 0.1% in the first quarter (January, February, March) of 2026, following a 0.3% decrease in the previous quarter.
- The first quarter decline was largely due to weaker net trade. An accumulation of inventories and higher household spending partially offset the decline.
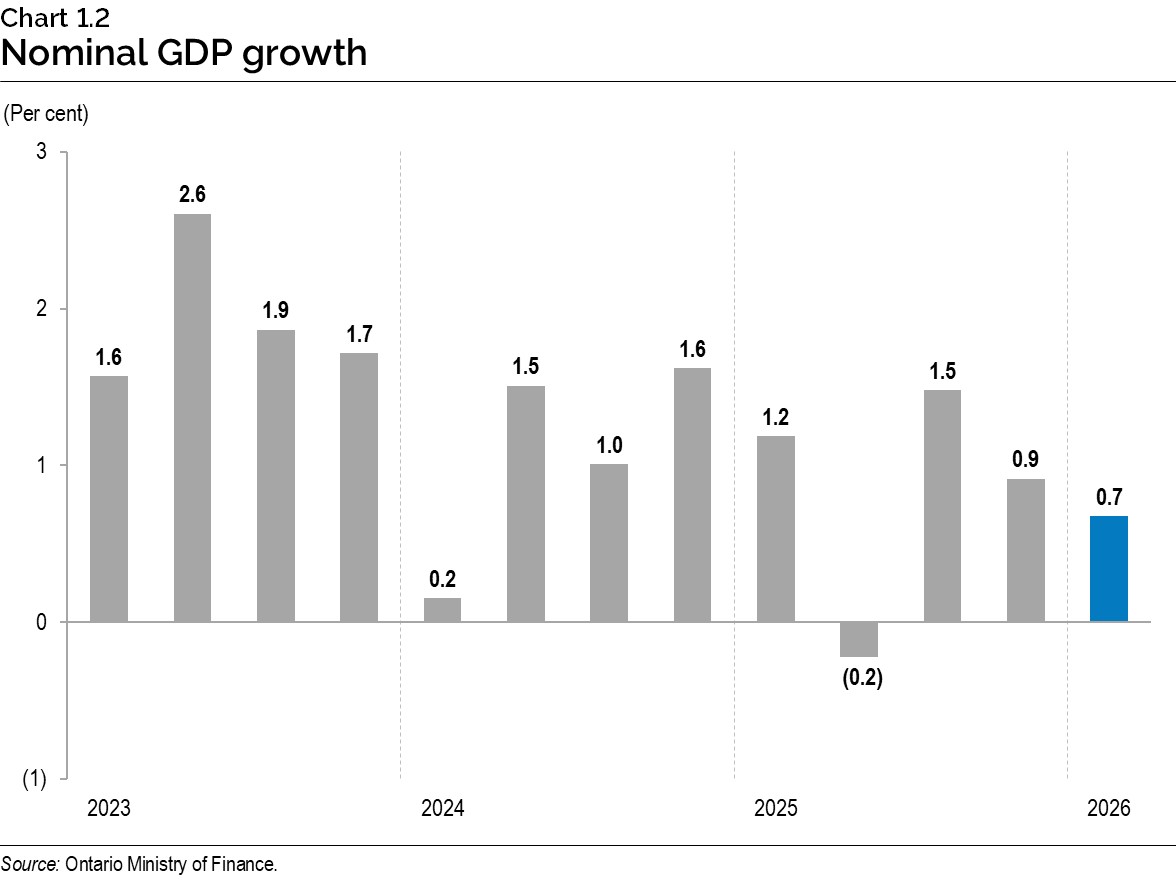
- Nominal GDP rose 0.7%, following a 0.9% increase in the previous quarter.
- Economy-wide prices, as measured by the implicit price index for GDP, increased 0.8% in the first quarter.
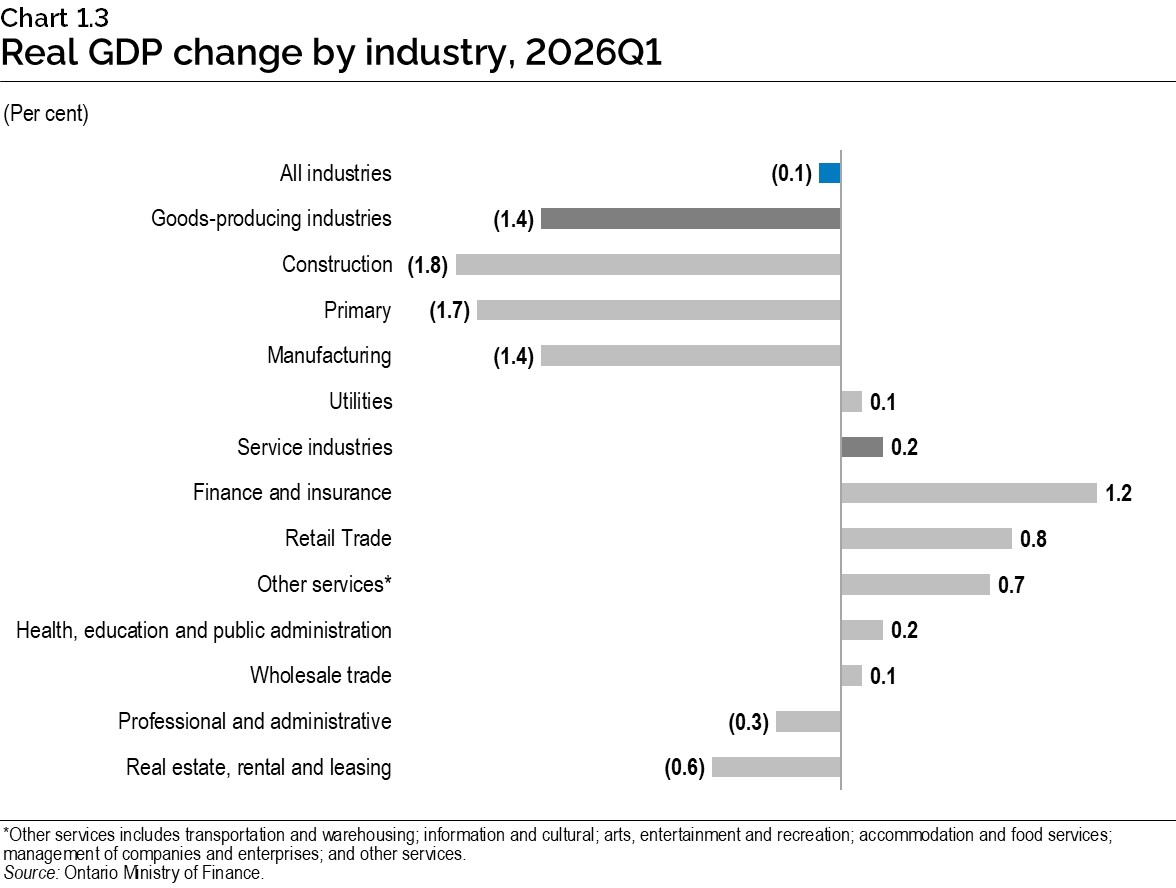
- Economic production, measured on an industry basis, declined 0.1% in the first quarter, due to lower goods sector output (-1.4%). Service sector production rose 0.2% in the quarter.
| Component | 2024 | 2025 | 2025 Q2 | 2025 Q3 | 2025 Q4 | 2026 Q1 |
|---|---|---|---|---|---|---|
| Real GDP | 1.6 | 1.3 | (0.7) | 0.6 | (0.3) | (0.1) |
| Nominal GDP | 5.1 | 4.1 | (0.2) | 1.5 | 0.9 | 0.7 |
Sources: Statistics Canada and Ontario Ministry of Finance.
Expenditure details
Ontario’s real GDP declined 0.1% in the first quarter of 2026, following a 0.3% decrease in the previous quarter.
Household consumption spending rose 0.1%, led by consumption of services (+0.4%) and non-durables (+0.8%). Consumption of durables (-2.0%) and semi-durables (-0.9%) declined in the quarter.
Total business investment declined 0.7%, due to declines in residential (-3.8%) and non-residential (-1.4%) investment. Investment in machinery and equipment (+3.3%) and intellectual property products (+3.2%) rose in the quarter.
Spending at all three levels of government combined declined 0.8% in the first quarter, after increasing 1.1% in the previous quarter.
Exports declined 0.4% while imports rose 1.6% in the quarter. International exports declined (-0.8%) and international imports rose (+2.4%). Interprovincial exports increased (+0.4%) and interprovincial imports declined (-0.8%) in the quarter.
Businesses accumulated inventories of $3.8 billion, following a draw down of $5.9 billion in the previous quarter.
| Component | 2024 | 2025 | 2025 Q2 | 2025 Q3 | 2025 Q4 | 2026 Q1 |
|---|---|---|---|---|---|---|
| Real GDP | 1.6 | 1.3 | (0.7) | 0.6 | (0.3) | (0.1) |
| Household consumption | 2.2 | 2.5 | 0.7 | (0.2) | 0.9 | 0.1 |
| Business investment | (1.2) | (1.1) | (1.2) | 0.0 | (1.3) | (0.7) |
| Government | 4.5 | 3.6 | 1.7 | (0.0) | 1.1 | (0.8) |
| Exports | (0.6) | (0.6) | (4.0) | 0.8 | 1.7 | (0.4) |
| Imports | (0.3) | 1.2 | 0.2 | (1.7) | 0.4 | 1.6 |
| Investment in inventories ($ billions) | 0.8 | 3.3 | 12.1 | 5.2 | (5.9) | 3.8 |
Sources: Statistics Canada and Ontario Ministry of Finance.
Income details
Ontario’s nominal GDP increased 0.7% in the first quarter of 2026, following a 0.9% increase in the previous quarter.
Compensation of employees, which includes both wages and salaries and supplementary labour income, rose 0.8%, after increasing 0.9% in the previous quarter.
Net operating surplus of corporations advanced 0.9%, after increasing 1.8% in the previous quarter.
Net mixed income, which is comprised of farm income, unincorporated business income and rental income, declined 1.5%, following a 2.0% increase in the previous quarter.
| Component | 2024 | 2025 | 2025 Q2 | 2025 Q3 | 2025 Q4 | 2026 Q1 |
|---|---|---|---|---|---|---|
| Nominal GDP | 5.1 | 4.1 | (0.2) | 1.5 | 0.9 | 0.7 |
| Compensation of employees | 6.4 | 3.7 | 0.0 | 1.1 | 0.9 | 0.8 |
| Net operating surplus | (1.1) | 6.2 | (2.4) | 6.4 | 1.8 | 0.9 |
| Net mixed income | 12.1 | 7.9 | 1.8 | 2.5 | 2.0 | (1.5) |
Sources: Statistics Canada and Ontario Ministry of Finance.
Price details
Economy-wide prices, as measured by the implicit price index for GDP, increased 0.8% in the first quarter, following a 1.2% increase in the fourth quarter of 2025.
Prices for household consumption expenditures rose 0.5%, after increasing 0.7% in the previous quarter.
Business investment prices declined 0.2%, after remaining unchanged in the previous quarter. Residential construction (-0.5%) and machinery and equipment (-0.2%) prices were lower in the quarter. Prices for non-residential construction (+1.0%) and intellectual property products (+0.1%) were higher in the quarter.
Export prices (+1.8%) and import prices (+1.7%) both increased in the quarter.
| Component | 2024 | 2025 | 2025 Q2 | 2025 Q3 | 2025 Q4 | 2026 Q1 |
|---|---|---|---|---|---|---|
| GDP | 3.4 | 2.8 | 0.5 | 0.9 | 1.2 | 0.8 |
| Household consumption | 2.4 | 2.0 | 0.1 | 0.9 | 0.7 | 0.5 |
| Business investment | 3.3 | 0.5 | 0.2 | (0.2) | 0.0 | (0.2) |
| Exports | 3.5 | 4.3 | (1.0) | 0.4 | 2.7 | 1.8 |
| Imports | 2.7 | 2.9 | (1.9) | 0.4 | 1.0 | 1.7 |
Sources: Statistics Canada and Ontario Ministry of Finance.
Industry details
Ontario real GDP, measured as value-added by industry, decreased 0.1% in the first quarter of 2026. Output in goods-producing industries declined 1.4% in the quarter, while output in the service sector increased 0.2%.
Manufacturing output declined 1.4% in the first quarter, following a 2.0% decline in the previous quarter.
Construction output decreased 1.8% in the first quarter, following a 2.1% decline in the fourth quarter.
Primary industry output declined 1.7%, following a 0.4% increase in the fourth quarter.
Utilities output edged up 0.1%, following an increase of 1.6% in the previous quarter.
Service industry output rose 0.2% in the quarter, led by gains in finance and insurance (+1.2%) and retail trade (+0.8%). These increases were partially offset by declines in professional and administrative (-0.3%) and real estate, rental and leasing services (-0.6%).
| Component | 2024 | 2025 | 2025 Q2 | 2025 Q3 | 2025 Q4 | 2026 Q1 |
|---|---|---|---|---|---|---|
| Total output | 1.7 | 1.3 | (0.2) | 0.7 | (0.2) | (0.1) |
| Total goods producing industries | (2.3) | 0.1 | (1.3) | 1.1 | (1.4) | (1.4) |
| Primary | 2.9 | 3.2 | 1.0 | 1.8 | 0.4 | (1.7) |
| Utilities | 3.4 | 3.8 | (1.7) | 1.0 | 1.6 | 0.1 |
| Construction | (2.2) | 0.2 | (0.2) | 1.0 | (2.1) | (1.8) |
| Manufacturing | (4.6) | (1.6) | (2.5) | 0.9 | (2.0) | (1.4) |
| Total service industries | 2.8 | 1.6 | 0.1 | 0.6 | 0.1 | 0.2 |
| Wholesale trade | 0.8 | 1.1 | (1.4) | 1.1 | (1.0) | 0.1 |
| Retail trade | 1.2 | 3.0 | 0.9 | 0.3 | (0.5) | 0.8 |
| Transportation and warehousing | 3.5 | 0.8 | 0.7 | 0.5 | 0.4 | 0.8 |
| Information and culture | 2.8 | 2.7 | 1.0 | 2.2 | 2.4 | 1.8 |
| Finance and insurance | 5.2 | 5.0 | 1.3 | 2.1 | 1.1 | 1.2 |
| Real estate, rental and leasing | 3.5 | 1.3 | (0.2) | 0.8 | 0.0 | (0.6) |
| Management of companies and enterprises | (30.0) | (22.0) | (3.3) | (4.0) | (5.8) | (3.8) |
| Professional and administrative services | 1.9 | (0.3) | (0.5) | 0.4 | 0.1 | (0.3) |
| Education | 4.2 | (0.3) | (0.8) | (0.5) | (2.4) | 0.4 |
| Health care and social services | 3.7 | 2.3 | 0.4 | 0.5 | 0.7 | 0.2 |
| Arts, entertainment and recreation | 2.4 | 3.1 | 1.5 | 0.3 | 0.3 | (1.5) |
| Accommodation and food | 0.8 | 2.0 | 0.6 | (0.2) | 0.6 | (0.6) |
| Other services | (0.3) | (1.2) | (0.5) | (0.4) | 0.2 | 0.3 |
| Public administration | 2.7 | 1.1 | 0.1 | (0.8) | 0.4 | 0.1 |
Sources: Statistics Canada and Ontario Ministry of Finance.
Jurisdictional comparison
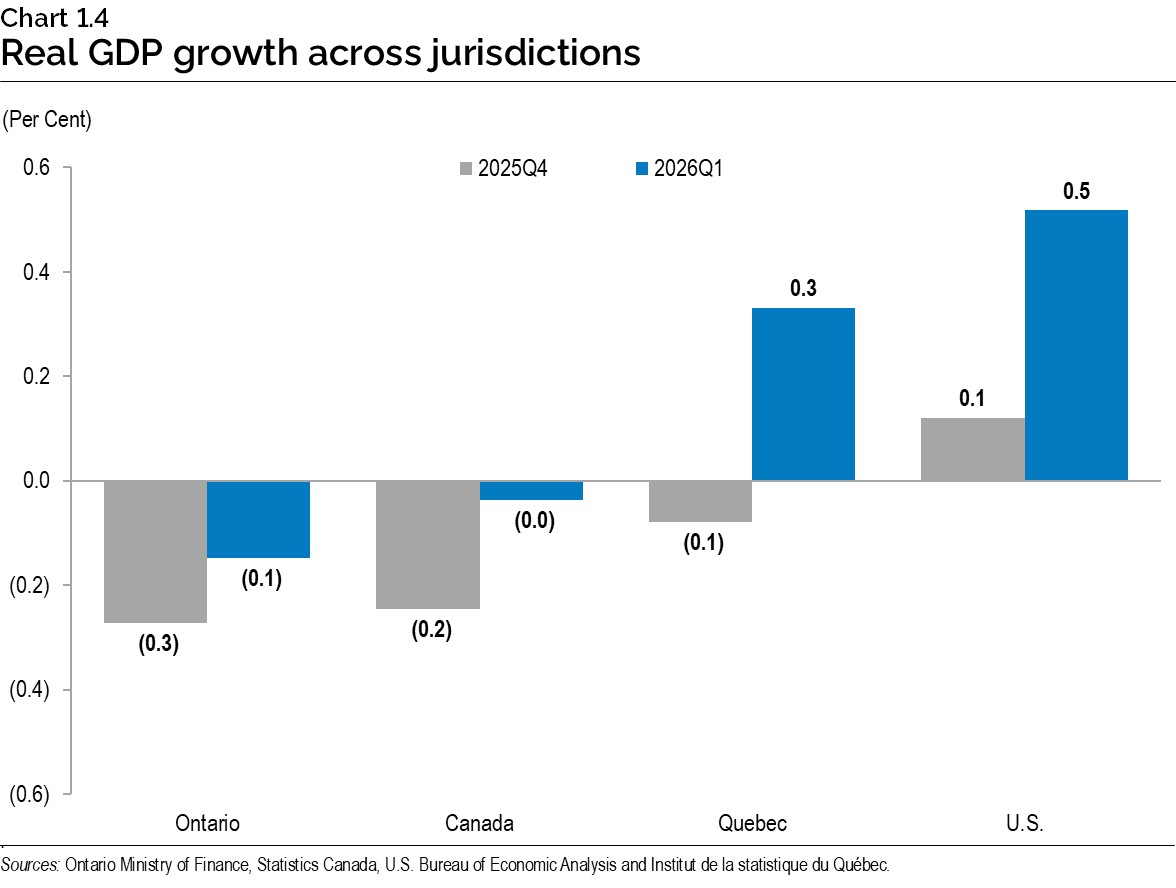
Canadian real GDP was unchanged in the first quarter, following a decline of 0.2% in the previous quarter. Higher goods imports were offset by inventory accumulation. Household spending rose in the quarter while exports, business investment and government investment declined.
Quebec’s real GDP rose 0.3% in the first quarter after edging down 0.1% in the previous quarter. First quarter growth was largely driven by an increase in inventories. Business investment also rose in the quarter, while household consumption, government spending and net trade declined.
In the U.S., real GDP advanced 0.5% in the first quarter, after edging up 0.1% in the previous quarter. The increase in the first quarter was driven by exports, investment, consumer spending and government spending. Gains were partially offset by an increase in imports.
Global economic environment
Real GDP in the U.S. increased by 0.5% in the first quarter of 2026 after edging up 0.1% in the fourth quarter of 2025. The first quarter increase primarily reflected stronger exports, investment, consumer spending, and government spending, which was partly offset by gains in imports.
Euro area real GDP declined 0.2% in the first quarter, following a 0.2% increase in the fourth quarter of 2025. The decline in real GDP reflected weaker gross fixed capital formation, inventories and net exports. The decrease was partly offset by stronger household and government final consumption expenditures.
U.K. real GDP increased 0.6% in the first quarter, after rising 0.1% in the fourth quarter of 2025. The first quarter gain was driven by higher inventory accumulation and stronger household and government spending. The gains were offset by weaker net trade and gross fixed capital formation.
Real GDP in Japan increased by 0.5% in the first quarter, following 0.2% growth in the previous quarter. China’s real GDP increased by 1.3% in the first quarter, up slightly from growth of 1.2% in the fourth quarter of 2025.
The Bank of Canada held its target for the overnight rate at 2.25% at its June policy meeting. The Bank has held the rate steady for five consecutive meetings since a 25 basis point rate cut in October 2025. The Bank expects Canadian real GDP growth to resume in the second quarter following a small decline in the first quarter. The conflict in the Middle East and resulting elevated energy prices as well as ongoing U.S. trade policy uncertainty continue to weigh on the economic outlook. The Bank is expecting that recently higher energy prices will not result in a persistent increase in inflation but the Bank notes that it will respond as needed if there is a broad-based pass through of higher energy prices to other consumer prices.
The U.S. Federal Reserve maintained the target range for the federal funds rate at 3.5% to 3.75% at its June meeting. This is the fourth consecutive pause in 2026 and comes after three rate reductions in late 2025. According to the Federal Open Market Committee’s statement, U.S. economic activity continues to grow at a solid pace despite uncertainty partly related to the conflict in the Middle East. Meanwhile, U.S. job gains have kept pace with workforce growth and the unemployment rate has been little changed in recent months.
The yield on short‑term Canadian government bonds edged up in the second quarter of 2026. The Government of Canada three‑month treasury bill yield averaged 2.3% in the second quarter, up from 2.2% in the first quarter. The Government of Canada 10‑year bond yield increased to 3.5% in the second quarter from 3.4% in the previous quarter.
The Canadian dollar averaged 72.3 cents US in the second quarter of 2026, down from 72.9 cents US in the first quarter.
Oil prices increased amid geopolitical tensions that continue to contribute to elevated oil price uncertainty and restricted oil supply. The West Texas Intermediate (WTI) crude oil price averaged US$96 per barrel in the second quarter of 2026, up from US$73 per barrel in the first quarter.
| Component | 2024 | 2025 | 2024 Q4 | 2025 Q1 | 2025 Q2 | 2025 Q3 | 2025 Q4 | 2026 Q1 |
|---|---|---|---|---|---|---|---|---|
| U.S. real GDP growth (per cent) | 2.8 | 2.1 | (0.2) | 0.9 | 1.1 | 0.1 | 0.5 | – |
| West Texas Intermediate (WTI) crude oil (US$ per barrel) | 77 | 65 | 72 | 65 | 66 | 60 | 73 | 96 |
| Canadian dollar (cents US) | 73.0 | 71.6 | 69.7 | 72.3 | 72.6 | 71.7 | 72.9 | 72.3 |
| Three-month treasury bill rate1 (per cent) | 4.4 | 2.6 | 2.9 | 2.6 | 2.6 | 2.2 | 2.2 | 2.3 |
| 10-year government bond rate (per cent) | 3.3 | 3.2 | 3.1 | 3.2 | 3.4 | 3.2 | 3.4 | 3.5 |
[1] Government of Canada interest rates.
Sources: U.S. Bureau of Economic Analysis; U.S. Energy Information Administration, and Bank of Canada.
Appendix A: OEA release dates
The Fiscal Sustainability, Transparency and Accountability Act, 2019 states that the quarterly Ontario Economic Accounts should be released within 45 days of the Statistics Canada release of the National Income and Expenditure Accounts.
In compliance with the legislation, the OEA will be released according to the following schedule:
| Reference Period | Expected Statistics Canada release of National Income and Expenditure Accounts | Corresponding deadline for the release of Ontario Economic Accounts |
|---|---|---|
| Second quarter (April-June) 2026 | August 28, 2026 | By October 13, 2026 |
| Third quarter (July-September) 2026 | November 30, 2026 | By January 14, 2027 |
| Fourth quarter (October-December) 2026 | March 1, 2027 | By April 15, 2027 |
Appendix B: Structure of the Ontario economy
Appendix C: How GDP is measured
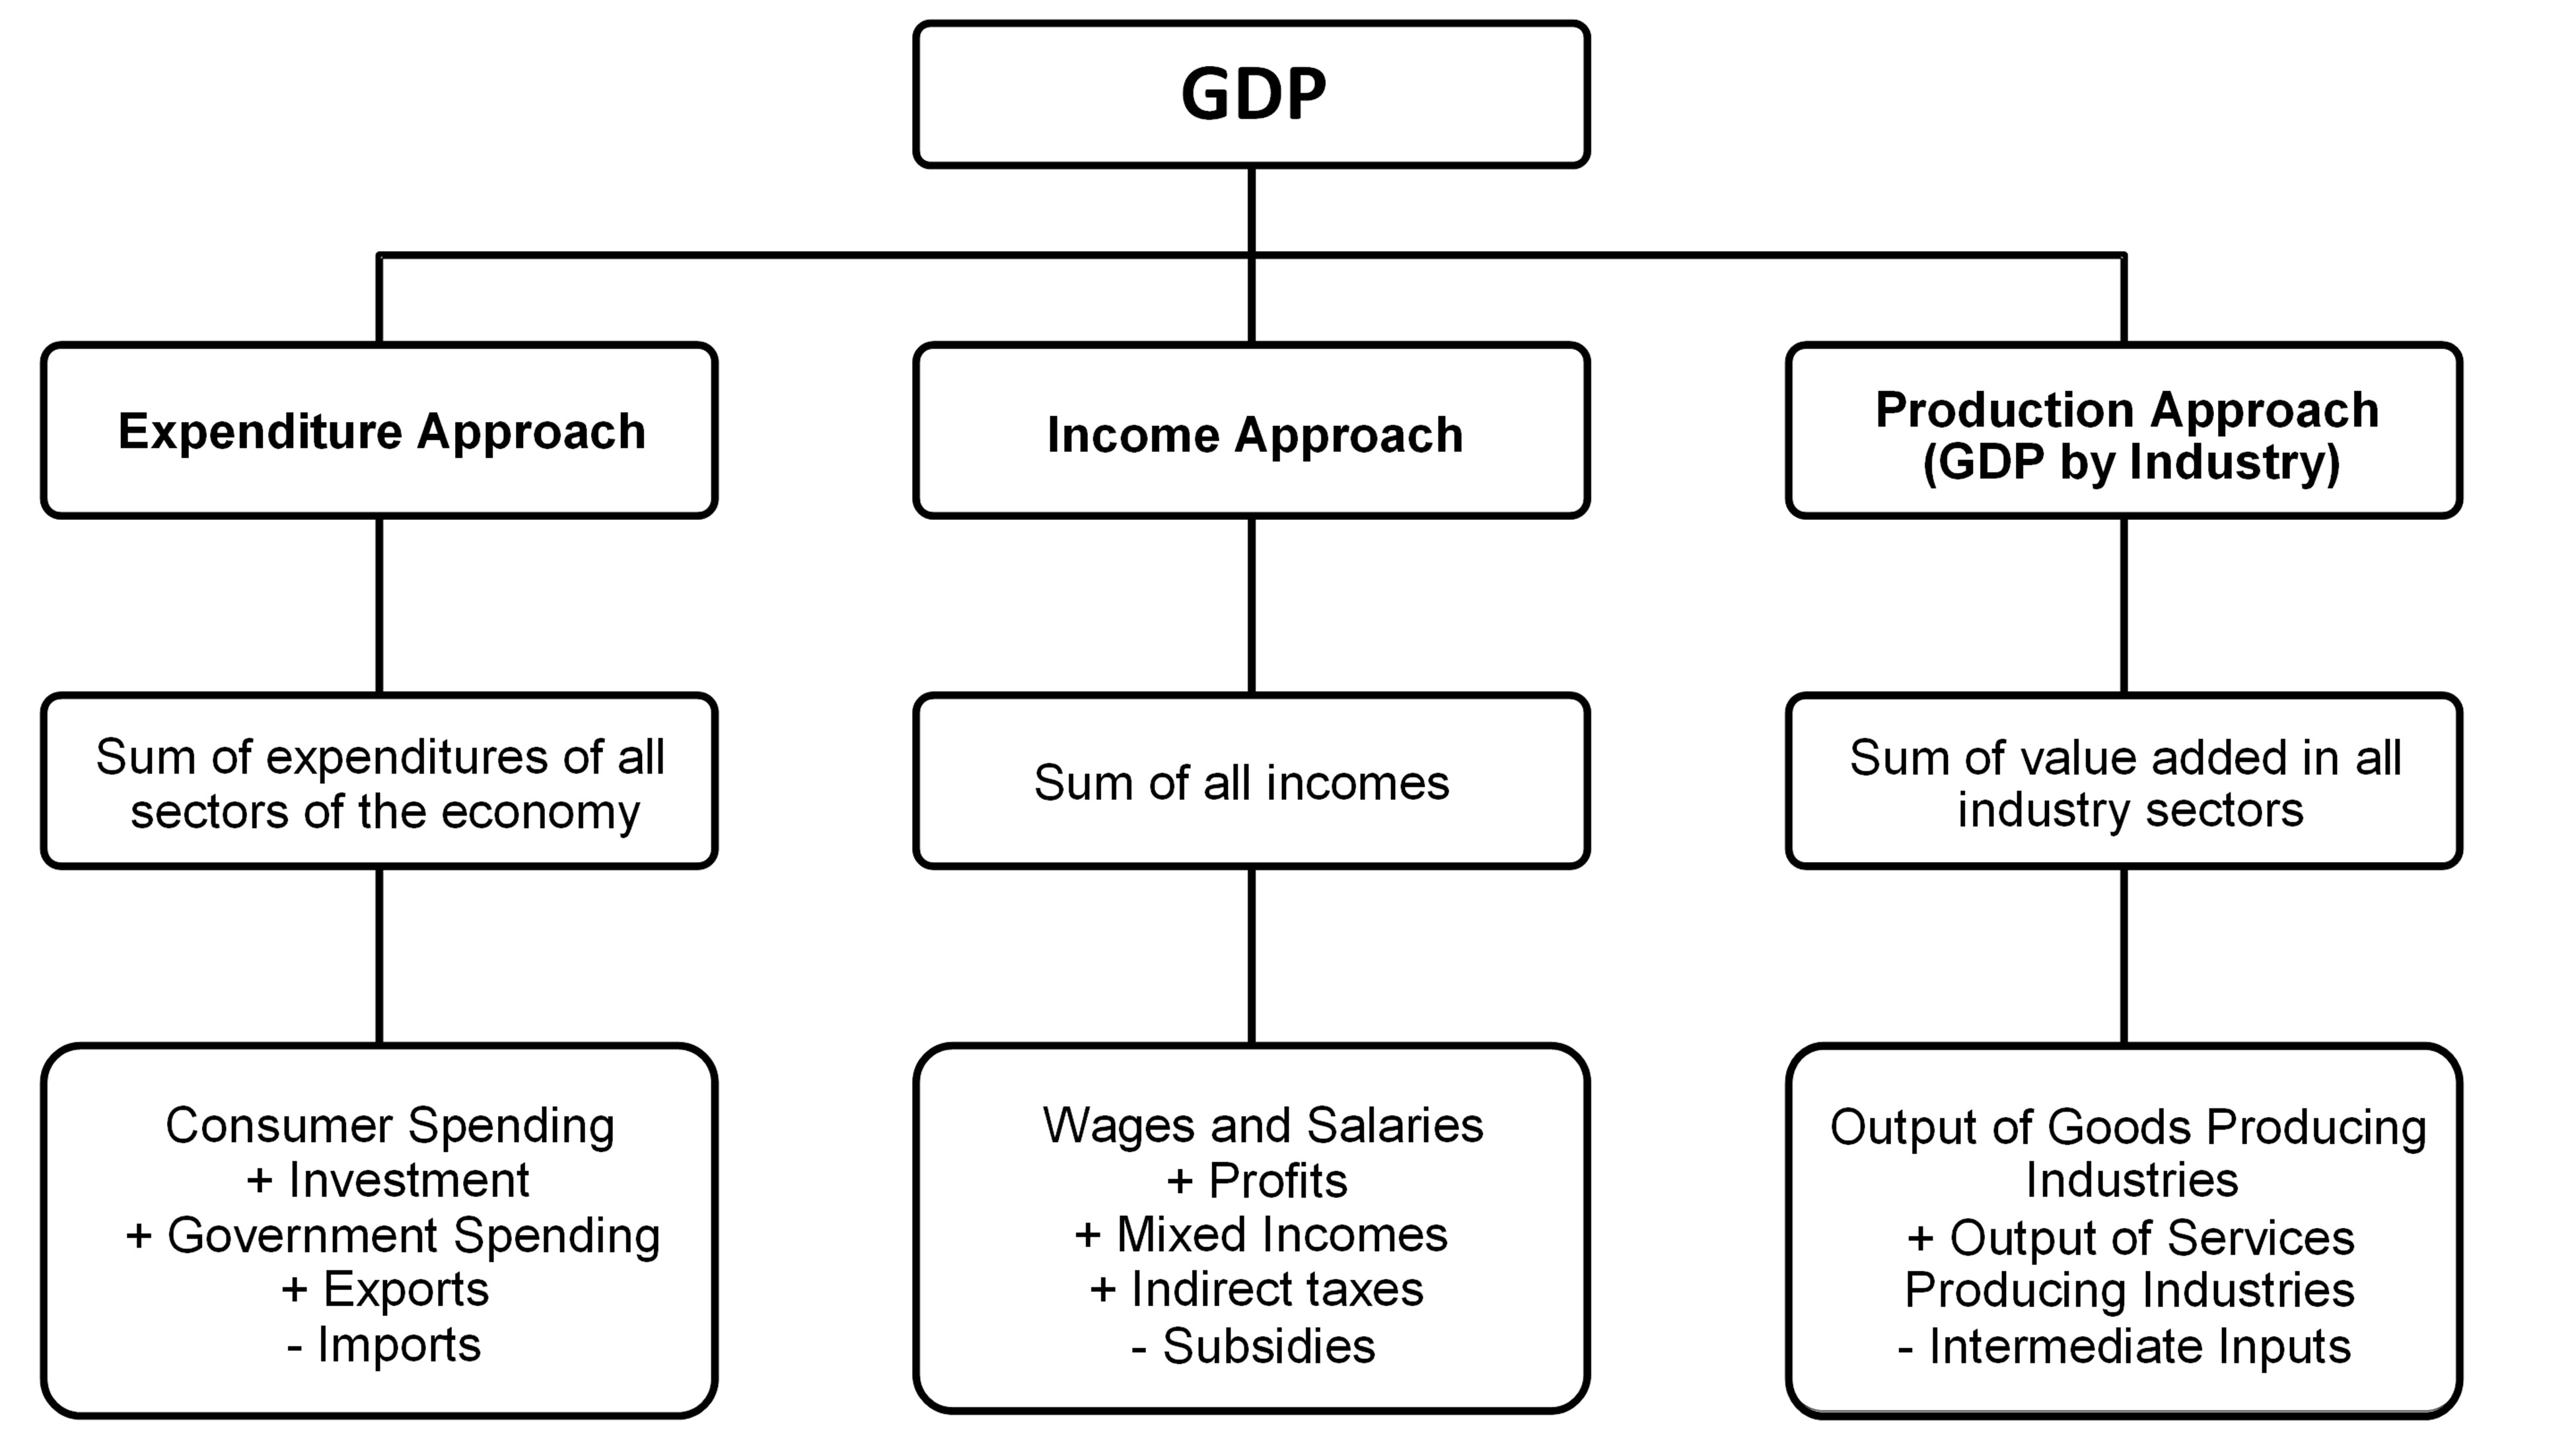
The Ontario Economic Accounts provide measurements of GDP using three different methodologies, by expenditure, income and industry.
The GDP by expenditure approach defines GDP as the aggregate of all expenditures on final consumption, gross capital formation and net trade by consumers, governments and businesses that occur within Ontario’s economy over a given time period. This measurement of GDP can also be defined as the sum of consumer spending, gross investment, government spending and net trade.
The GDP by income approach equates GDP to the total income earned through contributions to production within Ontario’s economy by labour and capital over a given time period. That is, GDP is the sum of all wages and salaries paid to employees, the gross operating surplus of businesses, gross mixed income and indirect taxes less subsidies.
The GDP by industry approach measures GDP by calculating the total output of the goods and services producing industries within Ontario’s economy and subtracting the cost of intermediate inputs used in final production. This approach can also be referred to as the value-added approach as it quantifies the additional value generated by industries through the production of final products within the economy.
For a full list of definitions used in the Ontario Economic Accounts, please see Statistics Canada’s System of Macroeconomic Accounts Glossary at https://www150.statcan.gc.ca/n1/pub/13-605-x/gloss/gloss-a-eng.htm.
Accessible chart descriptions
Chart 1.1: Real GDP growth
The bar chart illustrates Ontario’s quarterly per cent real GDP growth from the first quarter of 2023 to the first quarter of 2026. In the four quarters of 2023, real GDP growth was 1.3%, 0.6%, 0.4% and 0.2%, respectively. In the four quarters of 2024, real GDP growth was 0.4%, 0.4%, 0.3% and 1.0%, respectively. In the four quarters of 2025, real GDP growth was 0.6%, -0.7%, 0.6% and -0.3%, respectively. In the first quarter of 2026, real GDP declined 0.1%.
Source: Ontario Ministry of Finance.
Chart 1.2: Nominal GDP growth
The bar chart illustrates Ontario’s quarterly per cent nominal GDP growth from the first quarter of 2023 to the first quarter of 2026. In the four quarters of 2023, GDP growth was 1.6%, 2.6%, 1.9% and 1.7%, respectively. In the four quarters of 2024, GDP growth was 0.2%, 1.5%, 1.0% and 1.6%, respectively. In the four quarters of 2025, GDP growth was 1.2%, -0.2%, 1.5% and 0.9%, respectively. In the first quarter of 2026, nominal GDP increased 0.7%.
Source: Ontario Ministry of Finance.
Chart 1.3: Real GDP Change by Industry, 2026 Q1
The horizontal bar chart illustrates the per cent change in real GDP by industry for the first quarter of 2026. The output of all industries declined 0.1% in the quarter. Output decreased in goods-producing industries (-1.4%), with industry changes as follows: construction (-1.8%); primary (-1.7%); manufacturing (-1.4%); and utilities (+0.1%). Output in the service industries increased 0.2%, including industry changes as follows: finance and insurance (+1.2%); retail trade (+0.8%); other services* (+0.7%); health, education and public administration (+0.2%); wholesale trade (+0.1%); professional and administrative services (-0.3%); and real estate, rental and leasing (-0.6%).
*Other services include transportation and warehousing; information and cultural; arts, entertainment, and recreation; accommodation and food services; management of companies and enterprises; and other services.
Source: Ontario Ministry of Finance.
Chart 1.4: Real GDP growth across jurisdictions
This bar chart shows quarterly percentage changes in real GDP for Ontario, Canada, Quebec and the U.S. for the fourth quarter of 2025 and first quarter of 2026. Ontario real GDP decreased 0.3% in the fourth quarter and declined 0.1% in the first quarter. Canadian real GDP decreased 0.2% in the fourth quarter and was unchanged in the first quarter. Quebec real GDP decreased 0.1 % in the fourth quarter and increased 0.3% in the first quarter. U.S. real GDP increased 0.1% in the fourth quarter and increased 0.5% in the first quarter.
Sources: Ontario Ministry of Finance, Statistics Canada, U.S. Bureau of Economic Analysis and Institut de la statistique du Québec.
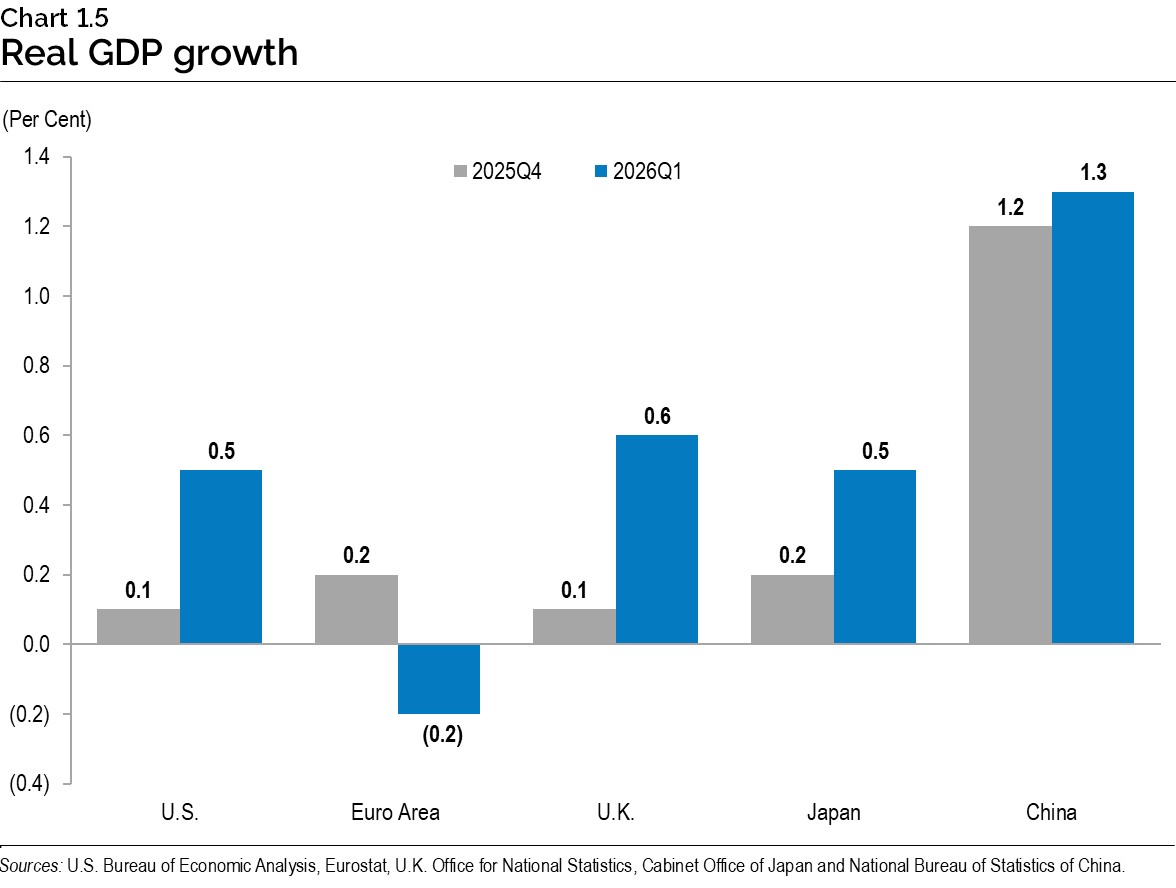
Chart 1.5: Real GDP growth
This bar chart shows quarterly percentage changes in real GDP for the U.S., the euro area, the United Kingdom, Japan and China, for the fourth quarter of 2025 and first quarter of 2026. U.S. real GDP increased 0.1% in the fourth quarter and 0.5% in the first quarter. Euro area real GDP increased 0.2% in the fourth quarter and declined 0.2% in the first quarter. Real GDP in the United Kingdom increased 0.1% in the fourth quarter and 0.6% in the first quarter. Japan’s real GDP increased 0.2% in the fourth quarter and 0.5% in the first quarter. China’s real GDP increased 1.2% in the fourth quarter and 1.3% in the first quarter.
Sources: U.S. Bureau of Economic Analysis, Eurostat, U.K. Office for National Statistics, Cabinet Office of Japan, and National Bureau of Statistics of China.
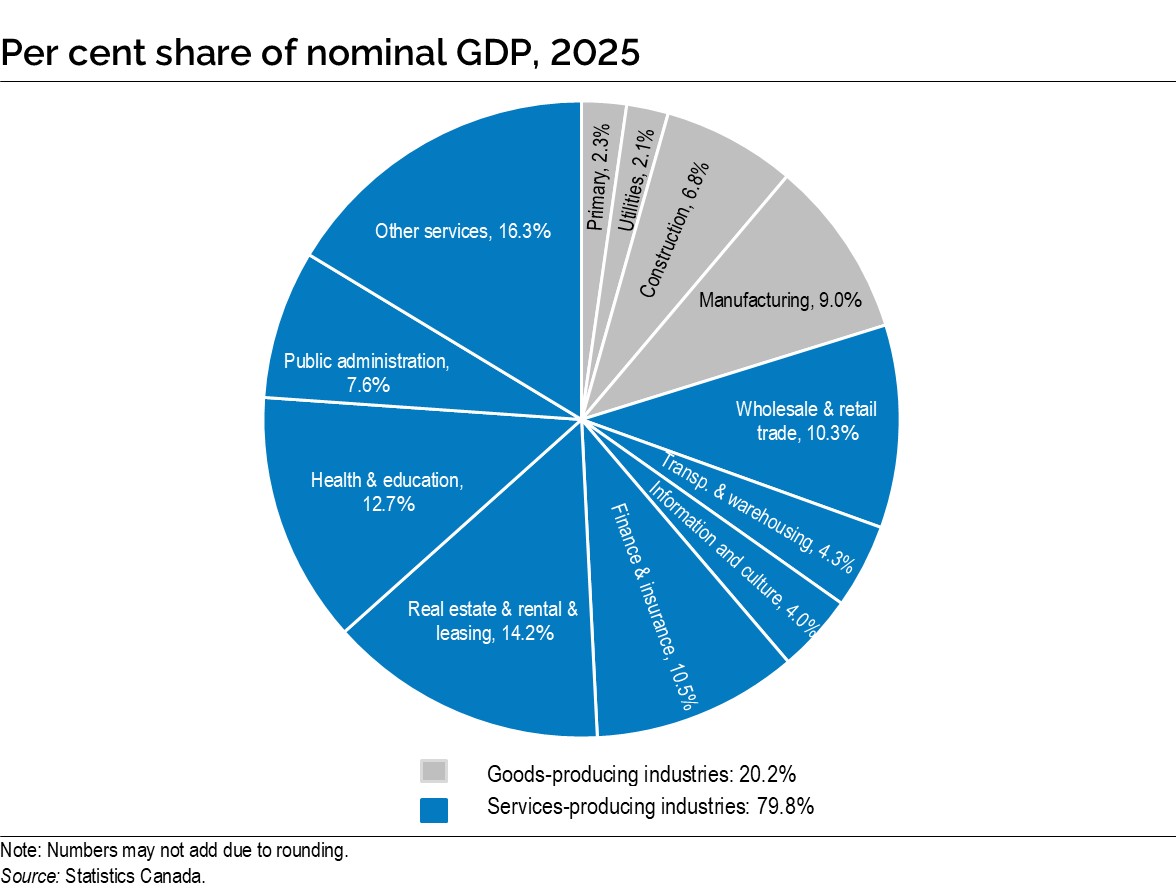
Chart: Appendix B, Per Cent Share of Nominal GDP, 2025
This pie chart shows the percent share of nominal GDP by industry for 2025. Goods-producing industries accounted for 20.2% of Ontario’s nominal GDP with industry shares as follows: manufacturing (9.0%); construction (6.8%); primary industries (2.3%); and utilities (2.1%). Services-producing industries accounted for 79.8% of Ontario’s nominal GDP with industry shares as follows: wholesale and retail trade (10.3%); transportation and warehousing (4.3%); information and culture (4.0%); finance and insurance (10.5%); real estate, rental and leasing (14.2%); health and education (12.7%); public administration (7.6%); and other services (16.3%).
Note: Numbers may not add due to rounding.
Source: Statistics Canada.
Chart : Appendix C, GDP measurement methods
- Expenditure Approach
- Sum of expenditures of all sectors of the economy
- Consumer Spending + Investment + Government Spending + Exports − Imports
- Income Approach
- Sum of all incomes
- Wage and Salaries + Profits + Mixed Incomes + Indirect taxes − Subsidies
- Production Approach (GDP by Industry)
- Sum of value added in all industry sectors
- Output of Goods Producing Industries + Output of Services Producing Industries − Intermediate Inputs