State of Ontario’s Natural Resources - Forests 2016
We report on the state of Ontario’s forests every 5 years. Read the 2016 report now.
Minister’s message
It is my pleasure to present the State of Ontario’s Natural Resources – Forests 2016 Report. This report summarizes important information about the health and well-being of our forests, communities and industry. This is the fourth assessment of Ontario’s forests, which helps to promote public knowledge of forests and sustainable forest management.
This report features themes that reflect current topics of interest to Ontarians: climate change, working together, and economic benefits. These themes also reflect the ecological, social and economic pillars of sustainability.
Overall, this report shows that Ontario’s forests are healthy and continue to meet the needs of Ontarians.
Over the past five years, Ontario continued to improve our understanding of the vulnerability of forests to climate change, which will help to develop options for adaptation. We know that Ontario’s forests play an important role in storing carbon and may play a role in mitigating climate change.
While the forest sector continued to face challenging market conditions, there are encouraging signs of recovery, particularly in the value-added sector. Ontario is committed to developing and implementing long-term strategies that will encourage innovation, engage Indigenous Peoples, and foster new markets.
I look forward to continuing to work with partners, stakeholders, Indigenous communities and the public to deliver sustainable forest management that promotes healthy and diverse forests, which provide a wide range of ecosystem services, are more resilient to the impacts of climate change, and support employment in communities across the province.
Kathryn McGarry
Minister of Natural Resources and Forestry
Introduction
Ontario’s forests provide a variety of environmental, economic, and social benefits to the people of Ontario. The Ministry of Natural Resources and Forestry (MNRF) is responsible for ensuring that Crown forests are healthy and continue to meet the needs of Ontarians. The Minister has a legal obligation to report on the state of Ontario’s forests at least once every five years. This report is the fourth assessment of the state of Ontario’s forests.
To assess the state of the forest, Ontario uses a set of 7 criteria and 63 indicators that was adapted from national and international systems. Criteria reflect long-term goals of sustainable forest management, while indicators measure progress in achieving these goals.
This report summarizes indicator results to provide an overview of the state of Ontario’s forests during 2009–2013. The themes of this report are climate change, working together and economic benefits. These themes reflect current topics of interest and also reflect the ecological, social, and economic pillars of sustainability. Themes draw from indicators across all criteria. Highlights from selected indicators are grouped under these themes. The last section provides a summary of the entire criteria and indicator framework.
What is Ontario’s approach for reporting on forests?
This report is supported by a website that provides details for each indicator. This report provides highlights about the state of Ontario’s forests, while the website enables interested readers to find more information about each indicator. Readers can view and download indicator data from the website (ontario.ca/forestindicators) to the forest. Indicators will be updated as new information becomes available.
MNRF also produces other reports related to forests, including the Forest Resources of Ontario, and the Forest Health Conditions Report. The Ministry also supports the Ontario Biodiversity Council in producing the State of Ontario’s Biodiversity Report.
Purpose of this report
This report provides the public with an overview of the state of Ontario’s forests, based on indicator assessments. Individually, indicators assess the state and trend of specific forest values. Collectively, indicator results are useful in informing policy development and identifying priorities for research and monitoring. MNRF is committed to continually improving sustainable forest management policy and programs in response to the information and priorities revealed by indicators.
Ontario’s forests
There are four main forest regions in Ontario, each with unique characteristics: the Hudson Bay Lowlands in the Far North, the boreal forest region in northern Ontario, the Great Lakes–St. Lawrence forest in southern and central Ontario, and the deciduous forest in southern Ontario. Each forest region is characterized by its climate, forest ecosystems, and wildlife species. For more information about Ontario’s forest types, see the Forest Resources of Ontario report.
Ontario has 71 million hectares of forest—an area that is equal to Germany, Italy and the Netherlands combined. Most of Ontario’s forests are publicly owned. Managed forests make up about half of Ontario’s Crown lands.
Forest regions in Ontario
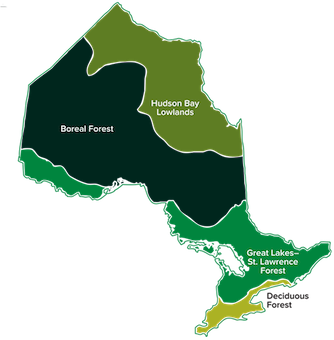
Hudson Bay Lowlands
- Characteristic ecosystems: Dominated by wetland, with many bogs and fens; includes sparse slow-growing forest and tundra
- Dominant tree species: Tamarack, black spruce, white birch, dwarf birch, willow
- Typical animals: Polar bear, woodland caribou, arctic fox, arctic hare, snow geese


Boreal Forest
- Characteristic ecosystems: forest-region dominated by coniferous and mixed-wood forests that are heavily influenced by natural disturbances such as fire
- Dominant tree species: Black spruce, white spruce, jack pine, balsam fir, tamarack, eastern white cedar, poplar, white birch
- Typical animals: Black bears, wolves, lynx, woodland caribou, moose, great horned owl, American marten, red fox


Great Lakes–St. Lawrence Forest
- Characteristic ecosystems: Dominated by hardwood and mixed-wood forests
- Dominant tree species: Sugar maple, red oak, yellow birch, white pine, red pine, hemlock, beech, basswood, red maple
- Typical animals: Black bear, wolves, deer, moose, beaver, muskrat, pileated woodpecker


Deciduous Forest
- Characteristic ecosystems: Dominated by agriculture and urban areas, with scattered pockets of highly-diverse forests and woodlots
- Dominant tree species: Maple, oak, birch, ash, black walnut, hemlock, cedar, hickory, sassafras, chestnut, tulip tree
- Typical animals: Southern flying squirrel, milksnake, red-bellied woodpecker, gray treefrog


Forest policy in Ontario
The Crown Forest Sustainability Act (CFSA) regulates the harvest and renewal of Ontario’s forests. The purpose of the act is to ensure the long-term health of Crown forests while meeting the social, economic and environmental needs of present and future generations.
Forest management in Ontario is also subject to the Environmental Assessment Act. MNRF has approval under this act (Declaration Order MNR-75) to conduct forest management on Crown lands in central and northern Ontario.
Managed Crown forests are divided into administrative areas known as forest management units. Forest management activities on each unit are planned and approved through forest management plans.
The planning process requires consultation with the public and Indigenous communities. Forest management plans are posted online to enable easier access. Annual work schedules and related reports can also be found online. In addition, Ontario produced a guide, Help Shape the Future of our Forests (2012), to encourage involvement in the development of forest management plans. Further, MNRF also posts information notices on the Environmental Registry to let the public know about opportunities to participate in forest management planning.
By law, forest managers must renew and maintain harvested areas to provide for the sustainability of Crown forests. All harvested areas must be regenerated. MNRF, industry and independent third parties monitor and assess the implementation of sustainable forest management practices, including renewal activities. Compliance inspections and independent forest audits conducted at the management unit level ensure that forest operations follow the guidelines, standards and requirements of forest policy in Ontario.
MNRF regularly collects information about Ontario’s forests using a combination of ground surveys, aerial surveillance and research programs. The ongoing collection of forest information is essential for continuous learning and adaptive management.
Legal requirements
The Minister of Natural Resources and Forestry prepares this report in compliance with section 22 of the Crown Forest Sustainability Act. In addition, the web-based presentation of criteria and indicators fulfills a condition of MNRF's approval under the Environmental Assessment Act.
Adaptive management cycle
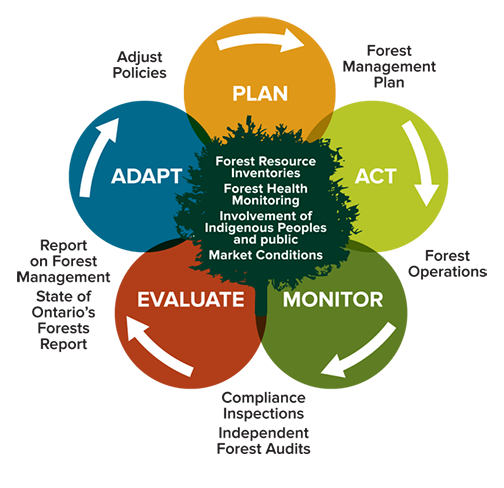
Policy framework for sustainable forest management

Managed Crown forest area

- Managed crown forest area: 43 million hectares
- In 2014, Ontario had 25.5 million hectares of Crown land independently certified
- During 2009–2013 an average of 1,400 hectares were afforested annually, while an average of 470 hectares were deforested annually
- The forest sector supported an annual average of 51,660 direct jobs between 2009-2013
- In 2010, about 60% of lands and 90% of larger lakes within the managed Crown forest area were classified as accessible for forest-based recreation
- During 2009–2013, over 30 protected areas have been expanded or created
- Approximately 10% of Ontario is currently protected, within over 630 protected areas
Forest disturbances during 2009-2013
- 71 million hectares of forest
- 43 million hectares of managed Crown forest area
- 1.1 million hectares damaged by natural weather disturbances (annual average)
- 0.45 million hectares damaged by insects and disease (annual average)
- 0.18 million hectares burned by forest fires (annual average)
- 0.11 million hectares of forest harvested (annual average)
Climate change
Climate change and human activities can significantly affect global ecological cycles, like nutrients, water and carbon. Forests play a unique and important role by directly contributing to these ecological cycles. Growing trees absorb carbon from the atmosphere through photosynthesis. When trees die and decompose, they release carbon into the atmosphere. If climate change causes more frequent and severe natural disturbances that result in tree mortality, forests could release more carbon into the atmosphere than they absorb. Healthy forests provide a wide range of ecosystem services, including carbon storage, and are more resilient to the impacts of climate change.
This theme describes the state of selected indicators that are related to climate change. For more detail or a complete list of indicators, refer to the summary at the end of this report or see ontario.ca/forestindicators.
Forest carbon

Forests may act as either a sink (i.e. store) or a source (i.e. release) for atmospheric carbon, depending on their age, growing conditions and how much they are affected by natural disturbances like forest fires, drought, or insect outbreaks. Forests and wetlands store large amounts of carbon in living trees, dead wood and soil. In addition, many types of wood products provide long-term carbon storage. As forests age, more carbon is stored. Eventually, carbon is released back to the atmosphere when trees are burned in wildfires or when dead trees or wood products decompose. This indicator uses computer models to estimate how much carbon is stored in forests and wood products over the long-term.
In 2015, managed Crown land stored 4.3 billion tonnes of carbon. Another 170.5 million tonnes of carbon were stored in harvested wood products. Total carbon storage in forests and wood products is projected to rise steadily through this century.
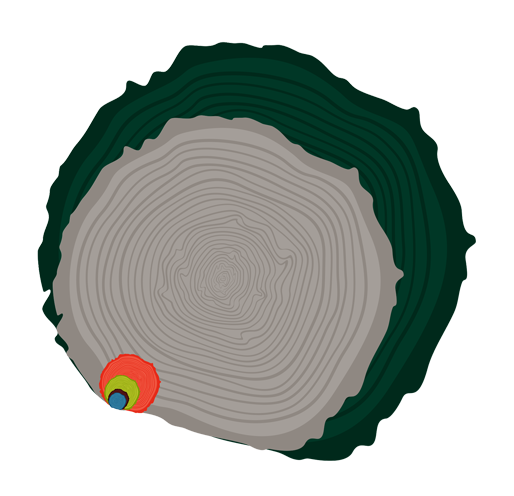
Forest carbon cycle

Weather

Weather refers to short-term atmospheric conditions, including temperature, humidity, wind and rain. Weather patterns influence forest growth and renewal. Severe weather events, such as drought, freezing rain, and wind can damage large areas of forest and may cause tree mortality. Damaged forest areas are at increased risk of fire, insect infestations and outbreaks of disease, which can affect wood supply and increase carbon emissions. Weather events are highly variable and unpredictable, causing large expanses of damage in some years and little to none in others. This indicator monitors the area of forest affected by weather events.
During 2009–2013, drought and wind events affected more than 5.3 million hectares of forest. Drought affected 65% of this area.
Wildland fire

Forests have adapted to regular cycles of natural disturbances, such as fire. Accordingly, fire is a natural influence on the structure, growth and renewal of Ontario’s forests. However, fire also releases carbon into the atmosphere and can threaten communities. Therefore, Ontario’s fire management program aims to manage fire in a way that protects public safety and human values while still allowing fire to play its ecological role in maintaining healthy forests. Ontario monitors the number of fires and area burned to alert us of trends that may affect sustainable forest management.
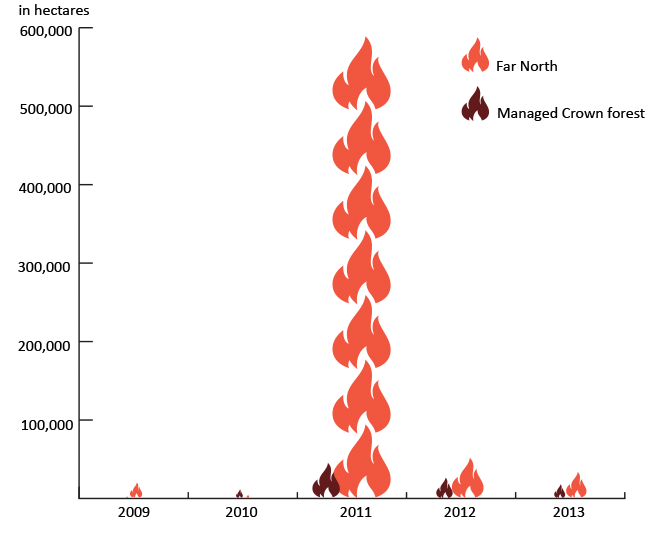
Approximately 876,000 hectares were burned in 4,776 fires. More than half of the area burned was in the Far North in 2011. Average area burned and annual number of fires have been generally decreasing over the last 10 years.
Area burned
Native insects and disease

In addition to fire, forests are also adapted to disturbance from periodic outbreaks of insects and disease. By causing old or weak trees to die, these disturbances help to make stored nutrients available for new growth. However, major forest disturbances caused by insects and diseases can increase fire hazards or affect wood supply and cultural values. Further, if climate change causes more frequent and severe outbreaks of insects and disease that result in tree mortality, forests could release more carbon into the atmosphere. High value areas may require protection through Ontario’s pest management programs, which aim to reduce tree mortality and fire hazards.
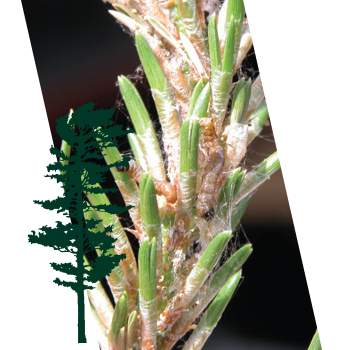
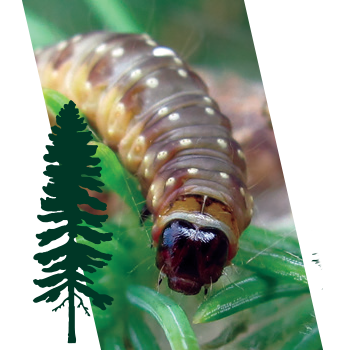
Outbreaks of insects and diseases were at relatively low levels within the expected range of variation during 2009–2013. Spruce budworm activity was low. An outbreak of jack pine budworm began to subside, but it caused significant areas of tree mortality in the northwest. In total, insects affected about 2.2 million hectares of Ontario’s forests.
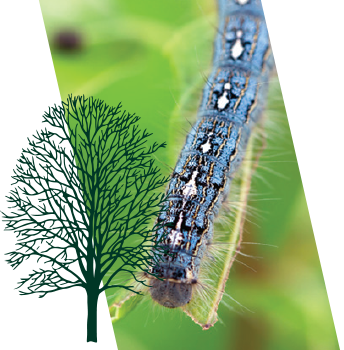
Area disturbed by native insects during 2009–2013
- Jack pine budworm damaged an average of approximately 84,500 hectares per year
- Spruce budworm damaged an average of approximately 151,000 hectares per year
- Forest tent caterpillar damaged an average of approximately 68,000 hectares per year
Common host trees of insects
Land use change - afforestation and deforestation

The amount of carbon stored in Ontario’s forests can be affected by changes in land use that increase or decrease forest area. Deforestation is a permanent change in land use from forest to non-forest. Deforestation decreases forest area, which reduces the carbon storage capacity of the land base over time because fewer trees are absorbing carbon from the atmosphere. In contrast, converting land to forest through afforestation increases the ability of those lands to store carbon in trees and soils. It is important to note that areas harvested under a sustainable forest management system are not considered deforested because the forest must be regenerated, thus there is no change in land use. These indicators measure changes in land use by estimating rates of afforestation and deforestation in Ontario.
During this reporting period, a small amount of Ontario’s forests were deforested for the construction of permanent forest access roads (as distinct from operational roads that regenerate) and for development and agriculture. The area and type of forests were stable from 2009 to 2013.

Reducing forest sectors use of fossil fuels

Ontario’s forest sector uses large amounts of energy to harvest and process wood products. Fossil fuels have a high carbon footprint and are not renewable. However, the forest sector has been sourcing more of its energy from waste wood materials from manufacturing forest products. By replacing fossil fuel energy with waste wood energy, the forest sector is reducing greenhouse gas emissions while increasing the use of wood fibre. This indicator monitors changes in energy sources for Ontario’s forest sector.
Overall, substitutions of fossil fuels with waste wood have shown continuous improvements. In 2011, the pulp and paper industry generated 55.8% of their energy from wood—a record high, up from just under 50% in 2009.

Working together
The responsibility for maintaining long-term forest health is shared among government, industry, Indigenous Peoples and local communities. Ontario collaborates with others in developing provincial policy and setting broad objectives, preparing forest management plans, and acquiring the science and information needed to support decisions. Ontario’s sustainable forest management system is responsive to a wide range of influences, including public perspectives, current science, and fluctuating markets.
This theme describes the state of selected indicators that demonstrate how Ontario works with partners, stakeholders, Indigenous communities and the public to make decisions about sustainable forest management. For more detail or a complete list of indicators, refer to the summary at the end of this report or see ontario.ca/forestindicators.
New laws and policies

Forests are always changing in response to a range of influences that occur at various scales. Therefore, it makes sense that forest policy responds to emerging issues while continuing to enable progress in achieving long-term, provincial objectives. Ontario works with others to ensure that forest policy adapts to public input, new information, and market conditions. This indicator examines changes to laws, policies and regulations to assess the responsiveness of the legal framework for sustainable forest management.
Since 2009, Ontario has passed the Far North Act (2010), the Ontario Forest Tenure Modernization Act (2011), and the Invasive Species Act (2015), among others. These laws highlight the importance of working together to:
- develop economic and conservation opportunities for First Nations communities in the Far North;
- support the restructuring of the forest industry; and,
- find, prevent, detect, and manage invasive species that affect Ontario’s natural environment.
Feedback from Local Citizens Committees

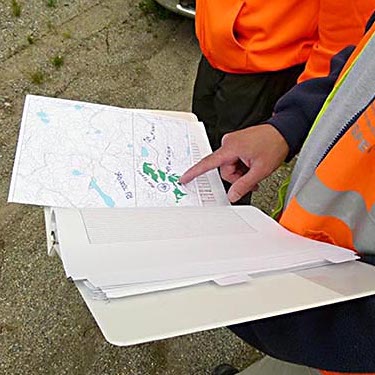
According to legal requirements in Ontario, forest management planning is collaborative and invites participation from local stakeholders, interested public and Indigenous communities. Local Citizens Committees are one way for the public to participate in forest management planning. This indicator collects and evaluates feedback from people who participated in Local Citizens Committees.
Members of the public who served on Local Citizens Committees during this reporting period were satisfied that the forest management planning process was fair, that it considered a full spectrum of public interests and was effective at influencing local decisions.
Indigenous participation in forest management planning

Ontario is committed to increasing opportunities for Indigenous Peoples to participate in forest management planning. The Forest Management Planning Manual requires that Ontario provide opportunities for Indigenous communities in or adjacent to forest management units to have representation on planning teams and Local Citizens Committees. Participation by Indigenous communities helps to incorporate Indigenous values and traditional ecological knowledge into forest management decisions.
The number of Indigenous representatives on planning teams has notably increased since 2004–2008. Almost half of forest management plans prepared during 2009–2013 had an Indigenous representative on Local Citizens Committees, which is consistent with levels of participation during 2004–2008. The increased participation on planning teams may be a result of better awareness of Indigenous consultation requirements. However, with limited capacity, it appears that some communities are choosing to have representation on planning teams rather than Local Citizens Committees.
Indigenous participation during 2009–2013
- 46% of Forest Management Plans prepared had an Indigenous member on the Local Citizens Committee
Indigenous values in forest management planning

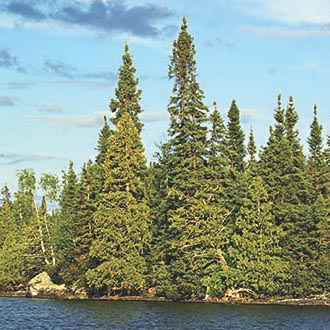
The consideration of Indigenous interests and values in decision-making is an integral part of the forest management planning process. The Forest Management Planning Manual requires that Indigenous values are identified so that prescriptions can be developed to protect those values during forest management activities. Indigenous communities in or adjacent to forest management units may choose to prepare background information reports to identify and map current and historic uses of the forest, along with recent forest management-related concerns. Indigenous communities may also choose to produce reports on the protection of identified values, which outline strategies for protecting values or mitigating adverse effects.
This indicator revealed that Indigenous communities chose to produce fewer reports during 2009–2013. The number of these reports may have decreased due to hesitation by communities to share values information because of concerns related to privacy (e.g. Freedom of Information Protection and Privacy Act requirements). Indigenous communities may also be unable to contribute to the development of these reports due to limited consultation and engagement capacity. Ontario is committed to working with Indigenous Peoples to build capacity through culturally appropriate engagement.
Economic benefits
The sustainable harvest of renewable wood fibre plays an important role in Ontario’s economy by supporting employment in communities and providing revenue to the government. To stay competitive, the forest sector requires predictable and economical access to wood and markets. The prolonged economic downturn, unfavourable market conditions, and decreased global demand for traditional forest products continued to affect the forest sector during this reporting period. However, there are encouraging signs of recovery in the value-added sector.
This theme describes the state of selected indicators that examine the economic performance of the forest sector. For more detail or a complete list of indicators, refer to the summary at the end of this report or see ontario.ca/forestindicators.
Area available for harvest

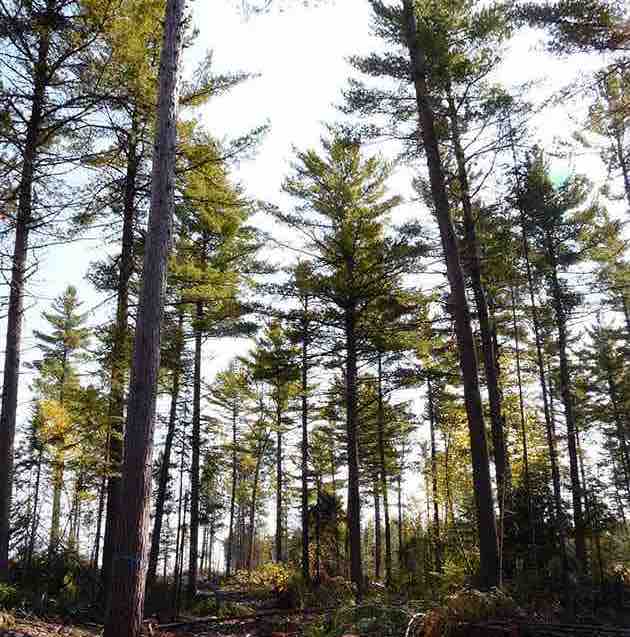
Managed Crown forests support a continuous and predictable flow of environmental, social, and economic benefits. The total area of Crown production forest may change over time. Periodically, decisions to withdraw forested areas for other uses, such as for parks and protected areas, will decrease the area available. From 2009–2013, over 30 protected areas were expanded or created; increasing Ontario’s protected area system by about 1.2 million hectares.
The total area of production forest may also increase as forest management expands into new areas. For example, a new forest management unit, the Whitefeather Forest, was created in the Far North in 2009, which added 630,500 hectares to the production forest. After remaining stable for more than a decade, the total managed Crown forest area available for timber production increased from 26.3 to 27.8 million hectares.
Harvest area and harvest volume by product


Sustainable forest management determines a planned level of harvest area to balance social, economic, and environmental objectives. While the amount of area available for harvest in Ontario is regulated, the actual harvest may vary from year to year. Forest managers report annually on the level of forest harvesting activities.
Market conditions, including a high Canadian dollar, increased electricity costs, and a decline in the U.S. housing market continued to affect the forest sector during 2009–2013. Annual harvest levels declined from a high of 224,000 hectares in 2004, to a low of 99,000 in 2009. Between 2010 and 2013, harvest area stabilized at around 115,000 hectares per year, or about 40% of the allowable harvest area.
Harvest volume averaged 13 million m3 per year, down from 17 million m3 per year during 2004–2008. Most of the wood harvested from 2009–2013 was used to produce lumber (48%) and paper products (37%). There was a 10% increase in pulp production.
Area harvested

- Area harvested in 2009–2013 was approximately half of area harvested in 2004–2008
Volume harvested by product in 2009-2013

- Sawlogs represented 48% of volume harvested
- Pulp and paper represented 37% of volume harvested
- Composite wood represented 11% of volume harvested
Crown stumpage

Ontario receives direct payments from the forest sector in the form of stumpage charges. Forest companies pay stumpage charges to the Crown for every cubic metre of timber harvested.
Less wood volume was harvested during 2009–2013, so stumpage payments declined compared to 2004–2008. Stumpage payments were lowest in 2009 at around $67 million and highest in 2012 at $98 million. In total, the forest sector paid more than $442 million in stumpage payments from 2009–2013.
Forest-related employment

Ontario’s forest sector is an important source of employment for many communities. The forest sector supported an annual average of 51,660 direct jobs, which is a 33% decrease from 2004–2008. During 2009–2013, employment in the forest sector declined because of lower harvest levels. In total, the forest sector supports about 170,000 direct and indirect jobs across more than 260 Ontario communities.

Rate of return by sector

To achieve sustainable growth, the forest sector must generate positive returns on their investments to maintain long-term profitability. Information about the rate of return (i.e. profit data) for Ontario’s forest sector is not readily available. Operating surplus is used as a proxy to estimate profitability. Operating surplus is calculated using information about the costs of production, and the value of products and inventory.
Since 2004, there has been a significant decline in operating surplus for the entire wood products sector. However, Ontario’s wood product manufacturing and paper sectors as a whole performed better than the national average between 2009-2012.
Value-added wood products

Value-added wood products involve processing primary commodities (e.g. lumber, plywood, and veneer) to create a product with greater value (e.g. furniture, flooring, and cabinets). This sector was in decline from 2004 to 2010, but it is beginning to recover. In 2012, only 8.3% of the total Canadian harvest volume was from Ontario, but the province produced 34% of Canada’s value-added products.

What is the state of Ontario’s forests?
Overall, indicator results confirm that Ontario’s approach to sustainable forest management continued to provide for the long-term health of forest ecosystems. Ontario continued to work with partners, stakeholders, Indigenous communities and the public to deliver sustainable forest management that promotes healthy and diverse forests, which provide a wide range of ecosystem services, are more resilient to the impacts of climate change, and support employment in communities across the province.
- The amount and type of Crown forests in Ontario remained stable. Forests are slightly older than in previous reporting periods.
- Carbon storage in forests and wood products is expected to rise through this century.
- There were no major natural disturbance events from fire, or native insects and diseases.
- Invasive species continued to arrive and spread.
- The public and Indigenous communities continued to participate in forest management planning processes.
- Harvest levels continued to be affected by the economic downturn and unfavourable market conditions. However, there are signs of recovery, particularly in the value-added sector.
It is difficult to make comparisons between reporting periods because the number of indicators has changed; some indicators were dropped or merged, and some indicators are new. Generally, indicator condition has improved since 2006. In many cases, improvements in data collection methods have enabled more accurate indicator assessments.
Criteria and indicator summary
Forests are dynamic ecosystems that are always changing. Ontario uses indicators to capture new information and examine trends related to sustainable forest management. Experts used information gathered since the last report to evaluate the state and trend for each indicator, along with the quality of information used in the assessment.
In assessing the state, experts considered whether indicators demonstrated good, fair, or poor progress towards the goals of sustainable forest management. The trend assessment reflects whether conditions were improving, mixed or stable, or deteriorating over 2009–2013. Finally, experts rated whether the information used to assess state and trend was adequate, partially adequate, or inadequate.
The following summary provides a snapshot of the ecological, social and economic characteristics of Ontario’s forests during 2009–2013. This section summarizes the condition of all 63 indicators, organized according to the 7 criteria of sustainable forest management.
For additional details about individual indicators including the rationale for state, trend, and data assessments, see ontario.ca/forestindicators.
Legend
State


Trend


Data


The categories used in rating the state, trend and data of forest indicators. The state can be good, fair, poor or unknown. The trend can be improving, mixed or stable, deteriorating or unknown. The Data can be adequate, partial, inadequate or unknown.
Criterion: Conserving biological diversity
Biological diversity (biodiversity) is the variability among species and their ecosystems. Biodiversity enables an ecosystem to recover after disturbance, maintain essential ecological processes, and provide ecosystem services. Forest biodiversity includes the trees as well as the plants, animals, and microorganisms found in forests and their associated genetic diversity. Conserving biodiversity in Ontario’s forests is crucial to ensuring a healthy environment, strong communities and a thriving economy. This criterion measures progress towards conserving biodiversity in Ontario’s forests.
Biodiversity can be assessed at ecosystem, species, and genetic levels. Complex interactions can occur within and among these scales. In biologically diverse forests, this complexity allows organisms to adapt to continually changing environmental conditions and to maintain ecosystem functions. Ontario examines the composition, structure and function of ecosystems at various scales to ensure that overall biodiversity is conserved. Composition is the variety of individual elements, while structure is the physical organization or pattern of a system. Function involves ecological processes, such as disturbances and nutrient cycling.
Progress in conserving forest biodiversity is measured by identifying pressures or threats, monitoring the status of ecosystems and species, and evaluating the effectiveness of policy direction and management actions in mitigating negative trends.
The status of most of the indicators was ranked as good or mixed/fair progress. However, alien and invasive plants continued to threaten the biodiversity of Ontario’s forests. During this period, Ontario continued to improve the representation of ecological features in protected areas, which provides an overall benefit to biodiversity. Overall, the state and trend of indicators was unchanged from the previous reporting period.
The data available for most of the indicators were assessed as adequate or partially adequate. Ontario continued to improve data collection and analyses for wildlife habitat and populations to facilitate indicator assessment. More information regarding alien and invasive plant species in northern forests would facilitate the early detection of these threats. In addition, better information about seed collection activities would improve the accuracy of reports regarding Ontario’s efforts to conserve the genetic diversity of native trees.
Ontario is reviewing these indicators to facilitate alignment with Ontario’s Biodiversity Strategy. For more information about biodiversity, refer to the State of Ontario’s Biodiversity Report.
Summary of forest indicators for conserving biological diversity
| Indicator | Summary | State | Trend | Data |
|---|---|---|---|---|
| Ecosystem Composition and Structure | Overall forest area, type and age are stable. Lower levels of harvesting, along with a decrease in the average area burned have resulted in a slightly older forest. |
 Good
|
 Mixed/No Change
|
 Adequate
|
| Ecosystem Fragmentation (as reported in 2011) | This indicator was last assessed in 2011. Results from 2011 showed little change in fragmentation for most of Ontario with an increase in southern Ontario. |
 Good
|
 Mixed/No Change
|
 Adequate
|
| Protected Areas System | Over 30 protected areas were expanded or created; increasing Ontario’s protected area system by 1.2 million hectares. Most of the new protected areas are in the Far North. |
 |
 Improving
|
 Adequate
|
| Forest-associated Species of Conservation Concern | There was no change in the conservation status of 93% of species. Of the 45 species whose status did change, 25 improved and 20 worsened. No new species were added to the list during 2009–2013. The greatest number of forest-associated species of conservation concern is concentrated in southern Ontario. |
 |
 Mixed/No Change
|
 Partial
|
| Forest-associated Wildlife | Population trends of white-tailed deer, moose and marten were variable across the province, increasing in some areas and decreasing in others. In 2013, Ontario implemented Multiple Species Inventory and Monitoring. |
 |
 Mixed/No Change
|
 Partial
|
| Habitat for Select Wildlife (as reported in 2011) | This indicator was last assessed in 2011. This indicator is under review to incorporate new modelling methodologies. The previous analysis showed that the modelled habitat availability for all species was generally stable or increasing. |
 Good
|
 Mixed/No Change
|
 Adequate
|
| Forest-associated Invasive Plants | Monitoring programs detected 157 alien plant species across Ontario’s forested ecoregions and 121 of these species are considered invasive. The Invasive Species Act, 2015 will allow Ontario to better address the threat of invasive species. |
 Poor
|
 Unknown
|
 Inadequate
|
| Genetic Diversity in Seed Orchards | Ontario currently has 26 active seed orchards for black spruce and 14 for jack pine. Since 2011, Ontario has added three first generation seedling seed orchards and three second generation clonal seed orchards. |
 Good
|
 Mixed/No Change
|
 Partial
|
| Genetic Conservation of Native Trees | Conservation of many tree species is adequate within parks and reserves. On average, 12.7% of Crown forest area is protected for black spruce, white pine and sugar maple. The Ontario Tree Seed Plant also houses 1,073 seed collections, for a total of about 2.7 million seeds for black spruce, jack pine, and white pine. Information is lacking regarding efforts to conserve genetic diversity in seed banks and genetic sites. This is the first report for this indicator. |
 |
 Unknown
|
 Inadequate
|
Criterion: Maintaining forest productivity and resilience
Forest productivity is a reflection of how nutrients, water, and solar energy are used within an ecosystem to produce and maintain plant and animal life. Forest resilience is the ability of forest ecosystems to recover from disturbances. Healthy forests that are well adapted to their growing conditions can recover quickly from disturbances and are capable of producing a wide range of ecosystem services.
Ontario’s sustainable forest management framework provides for the long-term health of forest ecosystems. Forest management practices emulate natural disturbance structures and patterns. MNRF monitors the implementation of forest management practices, conducts surveys to assess the impacts of natural disturbances, and monitors productivity, growing stock and area harvested. Twelve indicators are measured under this criterion.
Results from compliance monitoring indicated that harvesting operations were being conducted according to guidelines. Forest renewal levels were consistent with the amount of forest area disturbed. Forest age is increasing slightly because of reduced harvest and suppression of natural disturbances, such as fire and insects.
Monitoring carried out during this reporting period revealed that forest soils continued to be affected by the cumulative effects of acid rain. Furthermore, peak levels of ground-level ozone exceeded acceptable standards in the Great Lakes region between 2010 and 2012, which could have negative effects on forest growth.
Fire did not have a significant impact on sustainable forest management during 2009–2013. More than half of the area burned was in the Far North of Ontario in 2011. While some large fires did occur, they were generally far enough apart to avoid major impacts on any particular area.
A severe, province-wide drought occurred in 2012, which could lead to loss of merchantable timber, along with increased risks from fire, disease and insects in damaged areas. Current outbreaks of native insects, including forest tent caterpillar, spruce budworm and jack pine budworm continued to affect Ontario’s forests. The jack pine budworm outbreak, in particular, caused significant areas of tree mortality in the northwest. Invasive insects and diseases, including emerald ash borer and beech bark disease continued to spread, increasing risks to forest health.
Data for most indicators were assessed as adequate. Ongoing establishment and measurement of permanent monitoring plots, along with improvements in forest resource inventory and ecological data collection will facilitate future indicator assessments.
Summary of forest indicators for forest productivity and resilience
| Indicator | Summary | State | Trend | Data |
|---|---|---|---|---|
| Forest Growing Stock | The total volume of provincial forest types has been relatively stable since 2006. Average forest age increased for most forest types, except for jack pine. While this observation is neither positive nor negative, it can lead to long-term declines in productivity. Overall, growth is keeping pace with depletions for all forest types. |
 |
 Mixed/No Change
|
 Partial
|
| Net Primary Productivity | Net primary productivity measures the rate at which an ecosystem accumulates biomass. Average annual net primary productivity was estimated at 1.61 tonnes of carbon per hectare per year. This value is within the range of values reported for boreal forests in Canada (1.0–4.0 t C/ha/year). There was a slight decrease from 2010, possibly due to increased forest age. |
 Good
|
 Mixed/No Change
|
 Partial
|
| Atmospheric Deposition | Forest soils continued to be affected by the cumulative effects of acid rain, which could have negative effects on rates of forest growth. Long-term trends continue to show a marked decrease in sulphur deposition rates. |
 Poor
|
 Improving
|
 Partial
|
| Ozone | Annual average ground level ozone concentrations were normal; however mean annual peak concentrations exceeded national standards across much of the Great Lakes region between 2010 and 2012. |
 Poor
|
 Mixed/No Change
|
 Adequate
|
| Wildland Fire | Approximately 876,000 hectares were burned in 4,776 fires. More than half of the area burned was in the Far North in 2011. Average area burned and annual number of fires have been generally decreasing over the last 10 years. |
 Good
|
 Mixed/No Change
|
 Adequate
|
| Weather | Weather events damaged more than 5.3 million hectares of forest during this period. 65% of this damage occurred following a severe, province-wide drought that occurred in 2012. Other weather disturbances were within normal ranges. |
 Good
|
 Mixed/No Change
|
 Adequate
|
| Native Insects and Disease | The area affected by forest tent caterpillar increased during every year of this reporting period. Spruce budworm activity was low, but the outbreak is expected to intensify. The outbreak of jack pine budworm began to subside, but it caused significant areas of tree mortality in the northwest. In total, insects affected about 2.2 million hectares of Ontario’s forests. Most native tree diseases do not cause symptoms over large geographic areas. Overall levels of forest diseases were within the expected range of variation. |
 |
 Mixed/No Change
|
 Adequate
|
| Invasive Insects and Disease | Invasive insects and diseases, including emerald ash borer and beech bark disease continued to spread. The area affected by emerald ash borer increased by more than 800% since the beginning of this reporting period (from 18,856 to 153,040 hectares). Hemlock woolly adelgid was the newest invasive forest pest to arrive; it attacks Eastern hemlock trees. |
 Poor
|
 Deteriorating
|
 Adequate
|
| Harvest Area | Harvest area remained well below historic levels at approximately 40% of the allowable area per year. Most of this area was harvested using the clearcut silvicultural system, consistent with past trends. Almost 20% of the harvest was conducted using shelterwood (10%) and selection (8%) systems. |
 Poor
|
 Mixed/No Change
|
 Adequate
|
| Forest Regeneration | Renewal activity has kept pace with harvest levels. Free to Grow assessments revealed that regeneration standards set out in forest management plans are being met. During this reporting period, a total of 703,000 hectares were regenerated. |
 |
 Mixed/No Change
|
 Adequate
|
| Structural Legacy Following Harvest | Forest operations had very high rates of compliance (greater than 98%) with requirements for structural legacy and residual trees. As required, patches and undamaged residual trees were maintained and protected, consistent with previous reporting periods. |
 Good
|
 Mixed/No Change
|
 Adequate
|
| Downed Woody Material | The volume and characteristics of downed woody material in Ontario’s managed forests are consistent with current internationally recommended threshold values. |
 Good
|
 Mixed/No Change
|
 Partial
|
Criterion: Conserving forest soil and water resources
Soil and water conservation involves maintaining the quantity and quality of soil and water within, and flowing from, forested ecosystems. Soil productivity is a key indicator of forest ecosystem health. The primary focus for soil conservation is maintaining the living substrate for forest ecosystems by implementing carefully chosen management practices that account for environmental conditions such as soil texture, soil moisture, and slope.
Aquatic and riparian ecosystems are sensitive to forest disturbances that change the flow of water in the streams and rivers of watersheds. Changes in water quantity and quality associated with forest management are usually temporary, and are similar to those following wildfire. MNRF conducted a study to examine the level of recent and planned harvest within watersheds to determine potential risks to water quantity and quality. Results showed that the level of harvesting within watersheds was low, however further studies are necessary to establish the baseline data required to assess long-term trends.

Both MNRF and industry monitor compliance with forest management guidelines for protecting soil, water and fish habitat. Some indicators were assessed using proxy information from compliance inspections and Independent Forest Audits. Overall rates of compliance with forest management guidelines for protecting soil, water and fish habitat were very high (between 97–99%).
Since the last reporting period, MNRF has improved data collection for compliance with guidelines for forest soil protection. In 2011, site disturbance standards were defined in Ontario’s Forest Management Guide for Conserving Biodiversity at the Stand and Site Scales to facilitate quantitative assessments of site damage. Ontario will continue to evaluate the success of these standards in achieving desired outcomes.
Data quality varied between indicators. There was a lack of quantitative information regarding the effects of forest management practices on water quality and fish habitat. Until this information is available, compliance inspections and audits will be used as a proxy.
Summary of forest indicators for conserving forest soil and water resources
| Indicator | Summary | State | Trend | Data |
|---|---|---|---|---|
| Protecting Forest Soils | Overall rates of compliance with forest management guidelines for protecting soil were very high. Since the last reporting period, MNRF has improved data collection for this indicator. |
 Good
|
 Improving
|
 Adequate
|
| Disturbance within Watersheds | A study revealed that the level of harvesting within watersheds was low, at an average area of 4.7% In contrast, naturally disturbed watersheds had about 14.7% disturbance by area. Most watersheds had less than 10% disturbance. |
 |
 Unknown
|
 Partial
|
| Protecting Water Quality and Fish Habitat | Overall rates of compliance were very high (greater than 97%). Development and implementation of standardized monitoring approaches would enable more detailed assessments of the effects of forest management practices on water quality and fish habitat. |
 Good
|
 Mixed/No Change
|
 Inadequate
|
Criterion: Monitoring forest contributions to global ecological cycles
Climate change and human activities can significantly affect the global ecological cycles of oxygen, carbon, water, and other life sustaining elements. Forests play a unique and important role by directly interacting with these ecological cycles, and thus need to be monitored closely. Managing Ontario’s forests sustainably can help address the effects of climate change.
This criterion examines Ontario’s forest and wetland carbon balance, rates of deforestation and afforestation, the use of residue-based energy and recycled fibre by forest industry, the energy intensity of harvested wood products, and the forest ecological water balance.
In the long term, maintaining or increasing forest carbon stocks, while producing a sustained yield of harvested wood products and energy from the forests, will provide the largest greenhouse gas mitigation benefits while maintaining social and economic services. In 2015, managed Crown forests stored 4.3 billion tonnes of carbon. An additional 170.5 million tonnes of carbon were stored in products made from historically harvested wood fibre. Total forest carbon stocks on managed Crown land are projected to rise steadily through the 21st century.
Peatlands located in the Far North store and sequester more than 90% of the carbon in Ontario’s wetlands. During this reporting period, MNRF conducted a study to establish a baseline estimate of the peatland carbon balance. Further studies and ongoing monitoring projects will refine estimates of the peatland carbon balance and will facilitate the identification of long-term trends.
Deforestation is the permanent conversion of forested to non-forested land as a direct result of human activity, which includes clearing lands for agriculture, urban development, transportation or industrial activities. Forest harvesting is not deforestation because trees are regenerated following harvest. However, the infrastructure required to support harvesting, such as permanent road building, is counted as deforestation. Rates of deforestation in Ontario remained low and stable, while rates of afforestation continued to increase.
Afforestation is the conversion of lands from other uses to forests. During this reporting period, rates of afforestation in Ontario remained high, which coincided with the introduction of the 50 Million Tree Program.
Using wood energy to manufacture forest products significantly reduces greenhouse gas emissions per unit of harvested wood product. Ontario’s forest industry produced more than half of its total energy requirements from wood. The use of wood energy has been trending upward since the late 1990s.
Summary of forest indicators for monitoring forest contributions to global ecological cycles
| Indicator | Summary | State | Trend | Data |
|---|---|---|---|---|
| Forest Carbon | Total forest carbon storage is projected to rise steadily through this century. In 2015, managed Crown forests stored 4.3 billion tonnes of carbon. Another 170.5 million tonnes of carbon were stored in harvested wood products. |
 Good
|
 Improving
|
 Partial
|
| Wetland Carbon | Ontario’s peatlands are storing about the same amount of carbon on an annual basis as peatlands elsewhere in Canada. This was the first attempt to assess the wetland carbon balance in Ontario. |
 |
 Unknown
|
 Partial
|
| Deforestation | An annual average of 631 hectares was deforested for development and agriculture in southern Ontario. In central and northern Ontario, about 470 hectares per year were deforested for permanent forest access roads. Overall forest area remained stable during 2009–2013. |
 Good
|
 Mixed/No Change
|
 Partial
|
| Afforestation | Afforestation continued to expand in southern Ontario during this reporting period, which coincides with the introduction of Ontario’s 50 Million Tree Program. To date, almost 20 million trees have been planted under the program, creating more than 10,500 hectares of new forests across Ontario. |
 |
 Improving
|
 Partial
|
| Reducing Forest Sector’s Use of Fossil Fuels | In 2011, the pulp and paper industry generated 55.8% of their energy from wood – a record high, up from just under 50% in 2009. In the late 1990s and early 2000s, waste wood accounted for only 43% of the energy used by this industry. |
 Good
|
 Mixed/No Change
|
 Adequate
|
| Greenhouse Gas Emissions for Harvested Wood Products | The emissions intensity for Ontario’s pulp and paper sector has decreased by about 60% since 1990. Most of the reductions in greenhouse gas emissions were achieved by using forest biomass for energy production instead of fossil fuels. |
 Good
|
 Improving
|
 Partial
|
| Use of Recycled Fibre | Forest resource processing facilities decreased their use of recycled fibre from a high of 12% in 2004 to 4% in 2012. However, there are still nine facilities in Ontario that source 100% of their fibre from recycled sources. |
 |
 Mixed/No Change
|
 Partial
|
| Evapo-transpiration | The rate of evapotranspiration has been stable since 1980. Forest vegetation accessed similar amounts of water between 1980 and 2011. This indicator was assessed using data from Environment Canada. |
 |
 Mixed/No Change
|
 Partial
|
| Runoff | Stream flow records within the managed forest showed runoff rates and patterns varied between the four rivers that were studied. No change was observed in annual runoff and peak runoff between 1980 and 2010. Limited information was available from Environment Canada. |
 |
 Mixed/No Change
|
 Partial
|
Criterion: Providing economic and social benefits from forests
Providing a stable flow of economic and social benefits from Ontario’s forests is one of the goals of sustainable management. Forests provide a range of economic (commercial wood products, commercial and non-market goods and services, employment) and social (wildlife viewing, recreation, cultural heritage values) benefits to the people of Ontario, particularly those in resource-based, forest communities.
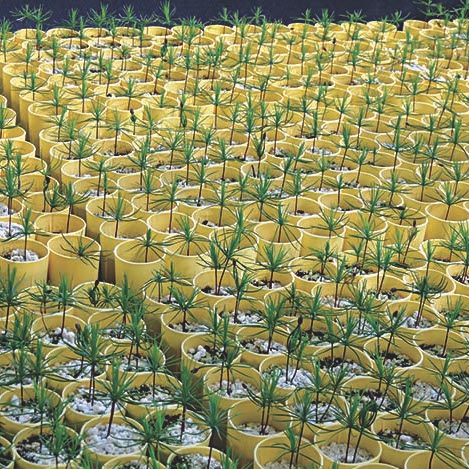
An important dimension of sustainable development is the performance of the forest sector in creating jobs, generating income, maintaining competitiveness and ongoing investment. This criterion is assessed using indicators that demonstrate the productive capacity of Ontario’s forests, the financial performance and capacity of the industry, and the social benefits available to communities.
The volume of Crown production forest is periodically measured using detailed forest resource inventories. Indicators demonstrate that the productive capacity of Ontario’s forests was maintained over the five-year period. In fact, the total area of Ontario’s managed forest increased by 2.5% due to the addition of a forest management unit in the Far North. Maintaining an adequate level of production forest enables the industry to respond to society’s demand for forest products.
The prolonged economic downturn, a high Canadian dollar, increased electricity costs and a reduction in global demand for traditional products, continued to affect the forest sector in this reporting period. These market conditions resulted in mill closures and layoffs, further reducing employment levels over the past five years.
However, indicators revealed some signs of recovery beginning in 2010, particularly in the value-added sector. There were overall gains in operating surplus for the wood product manufacturing sector, although the paper manufacturing sector showed an overall decline in performance due to changing global markets. Total investments in Ontario’s forest industry began to climb, but the majority of investments were directed to general maintenance and repairs.
While investments in research and technology declined during 2009–2013, Ontario’s forest product companies funded a higher share of the total investment in research and development compared to other Canadian provinces. This trend indicates recognition by Ontario wood product companies that they must innovate and reduce costs to survive in the changing market.
Forest certification helps to assure consumers that forest products come from responsibly managed forests, which improves the global competitiveness of the industry. Ontario’s forest industry is well positioned to obtain independent third party certification because of the rigorous legislative and policy framework. About 80% of managed Crown forests are certified. Forest companies have maintained their certification despite the economic challenges they faced during this reporting period.
Forest-based recreation and resource-based tourism are significant leisure and economic activities that occur in Ontario’s forests. Roads built for forestry and other economic reasons greatly affect the diversity of opportunities for forest-based recreation and resource-based tourism. More than half of terrestrial areas and most lakes in Ontario were considered accessible for forest-based recreation and tourism. In addition, areas with cultural heritage values were protected, which provide Ontarians with ongoing opportunities to study and enjoy a living archive of our province’s history.
Data for most indicators were assessed as adequate or partially adequate. Ontario continues to develop methods to determine the monetary value of ecosystem services to facilitate natural capital accounting.
Summary of forest indicators for providing economic and social benefits from forests
| Indicator | Summary | State | Trend | Data |
|---|---|---|---|---|
| Area Available for Harvest | After being stable for over a decade, the total area available has increased from 26.3 to 27.8 million hectares. The creation of the Whitefeather Forest added 630,500 hectares to the production forest. |
 Good
|
 Improving
|
 Adequate
|
| Harvest Volume by Product | Harvest volume averaged 13 million m3 per year, which is a 25% reduction from 2004–2008 (17 million m3 per year). During 2009–2013, most of the harvested wood volume was used for lumber (48%) and pulp and paper (37%) products. The proportion of wood harvested for pulp increased by 10% since 2004–2008. |
 |
 Mixed/No Change
|
 Adequate
|
| Rate of Return by Sector | Since 2004, the operating surplus for the entire wood products sector has declined significantly. The converted paper products subsector was more resilient than others. Ontario’s wood product manufacturing and paper sectors as a whole reported equal or higher surplus margins than the national average in all years between 2009 to 2012, except for the sawmill sector in 2009–2010. |
 |
 Mixed/No Change
|
 Adequate
|
| Forest-related Employment | Employment in the forest sector declined. From 2006 to 2011, the forest sector experienced significant layoffs. The sector supported an annual average of 51,660 direct jobs between 2009–2013, which is a 33% decrease from 77,880 during 2004–2008. |
 Poor
|
 Deteriorating
|
 Adequate
|
| Capital Expenditures in Forest Industries | In 2010, total investment began to climb in anticipation of a recovery in the forest products sector. Total annual investment in Ontario’s forest industry averaged $777.4 million; down significantly from $1,116.3 million during 2004–2008. Overall, Ontario capital investments trailed repair expenditures. |
 |
 Improving
|
 Partial
|
| Investment in Research and Technology | According to FPInnovation’s Forintek Division, industry investment in research and development has increased. Ontario’s forest industry provided 10.7% of Forintek’s total revenue over 2009–2013, up from 6.8% during 2004–2008. |
 |
 Improving
|
 Partial
|
| Forest Certification | Forest companies generally maintained their certification despite the economic challenges faced during 2009–2013. 25.5 million hectares of managed Crown land were certified in 2014. The area certified to CSA decreased, while SFI and FSC certified areas increased. |
 |
 Improving
|
 Adequate
|
| Green GDP Related to Forest Management | Socio-Economic Impact Model-calculated Green GDP does not adjust for all costs of environmental protection and degradation. As information improves, the model could be modified to provide a comprehensive calculation. |
 Unknown
|
 Unknown
|
 Inadequate
|
| Value-Added Wood Products | The value-added wood industry ended its decline in 2010 and slowly started to rebound. In 2012, Ontario harvested 8.3% of the total Canadian harvest volume, however, the province produced 34% of Canada’s value added wood products. |
 Good
|
 Mixed/No Change
|
 Adequate
|
| Canada Yew Harvest | Harvesting trends of Canada yew biomass continue to be highly variable. Information for other types of non-timber forest products is not available. |
 Good
|
 Mixed/No Change
|
 Inadequate
|
| Natural Capital and Ecosystem Services | A natural capital forest account does not yet exist for Ontario. An Ontario account could be based on indicators already available such as carbon balance, productivity, disturbance/harvest, regeneration, or hydrological cycles. |
 Unknown
|
 Unknown
|
 Inadequate
|
| Forest Recreation and Tourism Opportunities (as reported in 2011) | This indicator was last assessed in 2011 because it is on a 10-year reporting cycle. About 60% of lands and 90% of larger lakes were classified as accessible within the managed Crown forest area. |
 Unknown
|
 Unknown
|
 Partial
|
| Protecting Potential Archeological | Areas with cultural heritage value continued to be identified and protected, including shorelines with important archaeological areas. |
 Good
|
 Improving
|
 Adequate
|
Criterion: Accepting Ontario’s social responsibilities for sustainable forest development
Almost 90 per cent of Ontario’s forests are owned by the people of Ontario. Ontario’s Crown forests are managed in a sustainable manner to ensure long-term forest health while providing environmental, economic, and social benefits to Ontarians. Accordingly, the public and Indigenous Peoples are provided opportunities to influence how Crown forests are managed. Ontario accepts social responsibility by developing meaningful ways for the public and Indigenous Peoples to participate in and benefit from sustainable forest management.
Ontario’s social responsibility in sustainable forest management is assessed based on seven indicators that examine the extent of Indigenous People’s participation in forest-based economic opportunities and forest management planning, the effectiveness of public participation processes, and the resilience of forest-based communities.
Opportunities for participation in the economic benefits associated with forests continued to be provided to Indigenous communities. However, the volume of wood harvested by Indigenous Peoples decreased since the last reporting period, likely due to market conditions and limited capacity. During this reporting period, MNRF and the forest industry provided support to training programs that assist Indigenous communities in building capacity and preparing for increased participation in forest management activities. Comprehensive training programs include the Aboriginal Youth Work Exchange Program and the First Nations Natural Resources Youth Employment Program.
From 2009 to 2013, there was an increase in the participation of Indigenous Peoples on forest management planning teams. Public and Indigenous representation on Local Citizens Committees (LCC) remained stable. During this reporting period, LCC members increasingly agreed that the forest management planning process in Ontario is fair, that it accommodates a full spectrum of public interests and that it is effective at influencing local decisions. Overall, LCC members were satisfied with the forest management planning process.
Forest-based communities remained susceptible to the cyclical nature of the forest industry, which was still struggling to recover from the prolonged economic downturn and challenging market conditions for forest products. Diversification of the economies in these communities may lead to improved resilience and a more stable socioeconomic situation.
Data were assessed as partially adequate for all indicators. More information about the social aspects of sustainable forest management would facilitate future indicator assessments.
Summary of forest indicators for accepting social responsibilities for sustainable forest development
| Indicator | Summary | State | Trend | Data |
|---|---|---|---|---|
| Forest Harvest by Indigenous Peoples | The average annual volume of wood made available to Indigenous Peoples was 2.5 million m3, which is consistent with previous reporting periods. However, the amount of wood harvested decreased from 1 million m3 to 490,000 m3, which is consistent with the overall decline in provincial harvest. |
 |
 Deteriorating
|
 Partial
|
| Indigenous Participation in Forest Management Planning | The number and ratio of Indigenous representatives on planning teams increased. There were 124 Indigenous representatives (3.33/plan) for the 41 forest management plans prepared during this period. This compares to 2.45/plan from 2004–2008 and 0.67/plan from 1999–2003. Indigenous participation in Local Citizens' Committees (LCC) decreased slightly. 57% of forest management plans had an Indigenous member on the LCC. |
 |
 Improving
|
 Partial
|
| Indigenous Values in Forest Management Planning | During 2009–2013, communities chose to produce fewer reports that map Indigenous values. The number of these reports may have decreased due to hesitation by communities to share values information because of concerns related to privacy ( e.g. Freedom of Information Protection and Privacy Act requirements). Communities may also be unable to contribute to the development of these reports due to limited consultation and engagement capacity. |
 Poor
|
 Deteriorating
|
 Partial
|
| Resilience of Forest Based Communities (as reported in 2011) | This indicator was last assessed in 2011. This indicator will be updated when the 2016 census data becomes available. In 2011, 67 forest-dependent communities were assessed as potentially at risk from impacts to the forest industry. |
 Poor
|
 Mixed/No Change
|
 Inadequate
|
| Feedback from Local Citizens' Committees | On average, LCC members were satisfied that the forest management planning process is fair, considers a full spectrum of public interests and is effective in influencing local decisions. 8–12% of members were dissatisfied. |
 Good
|
 Improving
|
 Partial
|
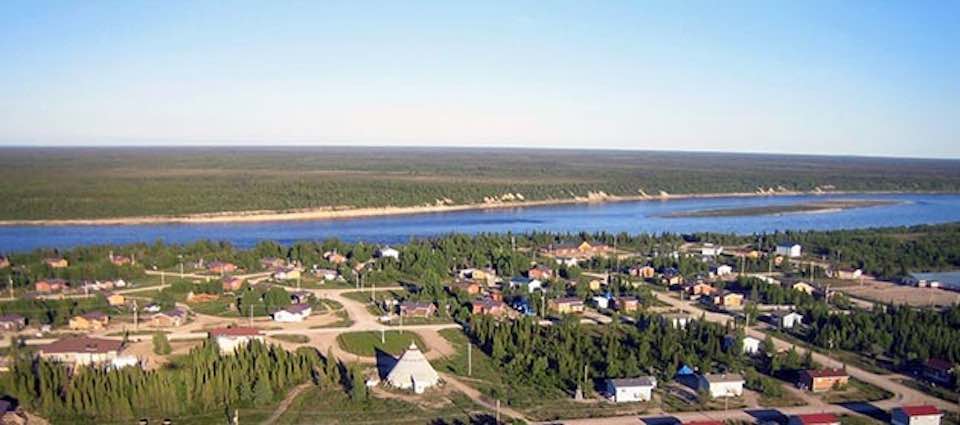
Criterion: Enhancing Ontario’s framework for sustainable forest management
Ontario’s forest laws and policies provide direction for the sustainable management and use of Crown forests. They ensure that our forests remain healthy and provide benefits to present and future generations. Ontario’s sustainable forest management practices are continuously improved based on the most up-to-date science.
This criterion assesses Ontario’s policy framework for sustainable forest management using information from 12 indicators focused on the legal and institutional components of sustainable forest management. The state and trend for most indicators were assessed as being good or mixed/fair.
During this reporting period, Ontario effectively maintained forest related policy and legislation. Ontario continued to gather information to enhance the legal and policy framework for sustainable forest management. Public review and consultation continued to be consistent with the requirements for public input regulated through the Environmental Assessment Act, the Crown Forest Sustainability Act, and the Environmental Bill of Rights and will continue to be monitored to ensure transparency, efficiency, effectiveness and accountability.
MNRF and its forest industry partners implemented strategies to ensure a competent workforce was in place to deliver consistent and world-class sustainable forest management. A good network of forest access roads balanced the need for resource access while minimizing adverse impacts on other resources. Licensee compliance with provincial forest management legislation, policies, and guidelines improved.
MNRF met all legally mandated inventory and monitoring program requirements. Ontario maintained a continuous five-year cycle of independent forest audits (IFA) with 42 IFAs conducted from 2009 to 2013. The majority of audit results (93%) indicated that licensees were complying with SFM responsibilities, legislation, policy, and guides. In total, over 16,000 compliance inspections were conducted by both MNRF and industry. While the overall rate of compliance improved, 182 compliance actions were levied, resulting in $362,000 in penalties and charges. In addition, 201 warnings were issued.
For most of the indicators, data were assessed as adequate or partially adequate. However, a more detailed forest inventory system would improve information about private land forestry in southern Ontario. In addition, changes to Canada’s census methods have affected Ontario’s ability to report on industry investments in research, development, and technology transfer. Accordingly, the investment indicators are also currently under review until new processes are in place to improve data quality and reporting.
Summary of forest indicators for maintaining Ontario’s framework for sustainable forest management
| Indicator | Summary | State | Trend | Data |
|---|---|---|---|---|
| Changes in Laws, Policies, and Regulations | Ontario effectively maintained forest related policy and legislation. Ontario continued to gather information to enhance the framework for sustainable forest management. In addition, new forest management guides were developed to provide updated direction at landscape and site-specific scales. |
 Good
|
 Mixed/No Change
|
 Adequate
|
| Forest Management Work Force Competency | MNRF and its forest industry partners provided access to training and development to ensure a competent workforce delivered sustainable forest management. In total, 7,530 participants attended 231 forest management technical training sessions during 2009–2013. |
 Good
|
 Mixed/No Change
|
 Adequate
|
| Forest Access Roads | There was a decrease in operational road construction (from 4,380 km to 3,070 km per year), however, levels of primary and secondary road construction remained steady. Primary road maintenance increased by an average of 2,057 km per year. |
 |
 Mixed/No Change
|
 Adequate
|
| Public Review and Consultation | The infrastructure for public review and consultation continued to be consistent with legal requirements. During 2009–2013, MNRF improved online access to forest management planning documents. In addition, the ministry published a guide to help the public participate in the forest management planning process. |
 Good
|
 Mixed/No Change
|
 Adequate
|
| Crown Stumpage | Stumpage revenues remained relatively low, but stable. Crown stumpage payments were lowest in 2009–2010 at $67.7 million and highest in 2011–2012 at $98.6 million. With the prolonged recession in the U.S. housing sector, Crown timber stumpage revenues have not yet recovered to prerecession levels. |
 |
 Mixed/No Change
|
 Adequate
|
| Private Land Forestry | Provincial programs and supports for private land forestry are working well, however the level of effort is not uniform across the province. There is room to improve our ability to report on the combined efforts of multiple jurisdictions. |
 |
 Mixed/No Change
|
 Partial
|
| Monitoring Programs for Forest Management | Inventory and monitoring programs remained in place, in accordance with legal requirements. |
 Good
|
 Mixed/No Change
|
 Partial
|
| Progress in Inventory and Monitoring Programs | The growth and yield, and enhanced forest resource inventory programs continue to be well below targets. Establishment of the Multi-Species Inventory and Monitoring program is on track. The forest audit program met targets during the reporting period. |
 |
 Mixed/No Change
|
 Partial
|
| Independent Forest Audits | 93% of audits completed from 2009–2013 concluded that the forest was managed in compliance. This is consistent with previous levels of compliance. |
 Good
|
 Mixed/No Change
|
 Adequate
|
| Forest Operations Compliance | Over 16,000 inspections were conducted by both MNRF and industry. The overall rate of compliance improved to 97.5%. More than 383 compliance actions were levied, including 201 warnings, resulting in $362,000 in penalties and charges. |
 Good
|
 Mixed/No Change
|
 Partial
|
| Investments in Forest Research and Development | This indicator is currently under review with the intent of standardizing the data collected and ensuring consistent reporting and meaningful assessment. |
 Unknown
|
 Unknown
|
 Inadequate
|
| Investment in Forest Knowledge and Technology Transfer | This indicator is currently under review with the intent of standardizing the data collected and ensuring consistent reporting and meaningful assessment. |
 Unknown
|
 Unknown
|
 Inadequate
|
Conclusion
Overall, indicators confirmed that Ontario’s approach to sustainable forest management continued to provide for the long-term health of forest ecosystems. Ontario is committed to working with partners, stakeholders, Indigenous communities and the public to deliver sustainable forest management that promotes healthy and diverse forests, which provide a wide range of ecosystem services, are more resilient to the impacts of climate change, and support employment in communities across the province.
What’s next?
Indicators will be updated as new information becomes available. The next report is scheduled for release in 2021. For additional information about sustainable forest management in Ontario, visit: ontario.ca/forestindicators
List of acronyms used in document:
- MNRF: Ministry of Natural Resources and Forestry
- CFSA: Crown Forest Sustainability Act
- CSA: Canadian Standards Association
- SFI: Sustainable Forestry Initiative
- FSC: Forest Stewardship Council
- GDP: gross domestic product
- LCC: local citizens committee
- SFM: sustainable forest management
- IFA: independent forest audits