National Air Quality Management System
The national Air Quality Management System (AQMS) is a collaborative approach for reducing air pollution in Canada. It consists of several elements:
- Canadian Ambient Air Quality Standards (non-regulatory health and environmental-based air quality objectives intended to drive improvements where needed)
- air zones (management areas delineated within a province or territory)
- regional airsheds - transboundary air pollution (broad geographic areas that encompass a number of air zones and may cross provincial/territorial and international boundaries)
- base-level industrial emissions requirements
- mobile emission sources (transportation)
Canadian Ambient Air Quality Standards
The Canadian Council of Ministers of the Environment have developed Canadian Ambient Air Quality Standards (CAAQS) as a key element of the Air Quality Management System to drive improvement of air quality across Canada. CAAQS are non-regulatory health and environmentally based ambient air objectives that are used to assess general air quality and reflect desirable concentrations of contaminants in air from all sources. CAAQS have been developed for fine particulate matter, ozone, nitrogen dioxide and sulphur dioxide.
| Pollutant | Averaging time | Numerical value 2015 |
Numerical value 2020 |
Numerical value 2025 |
Statistical form |
|---|---|---|---|---|---|
| Fine particulate matter (PM2.5) | 24-hour | 28 μg/m3 | 27 μg/m3 | N/A | The 3-year average of the annual 98th percentile of the daily 24-hour average concentrations |
| Fine particulate matter (PM2.5) | Annual | 10.0 μg/m3 | 8.8 μg/m3 | N/A | The 3-year average of the annual average of the daily 24-hour average concentrations |
| Ozone (O3) | 8-hour | 63 ppb | 62 ppb | 60 ppb | The 3-year average of the annual 4th highest of the daily maximum 8-hour average ozone concentrations |
| Nitrogen Dioxide (NO2) | 1-hour | N/A | 60 ppb | 42 ppb | The 3-year average of the annual 98th percentile of the NO2 daily maximum 1-hour average concentrations |
| Nitrogen Dioxide (NO2) | Annual | N/A | 17 ppb | 12 ppb | The average over a single calendar year of all NO2 1-hour average concentrations |
| Sulphur dioxide (SO2) | 1-hour | N/A | 70 ppb | 65 ppb | The 3-year average of the annual 99th percentile of the SO2 daily maximum 1-hour average concentrations |
| Sulphur dioxide (SO2) | Annual | N/A | 17.0 ppb | 12.0 ppb | The average over a single calendar year of all 1-hour average SO2 concentrations |
Source: Canadian Council of Ministers of the Environment
Air zone management framework
- The air zone management framework (AZMF) is a place-based approach to managing air quality under the AQMS.
- The framework provides guidance on management, monitoring and reporting actions to be implemented in an area to achieve the CAAQS.
- Under the AQMS, each jurisdiction is required to:
- delineate air zones to cover their entire jurisdiction
- publicly report on monitored levels of the CAAQS pollutants in their air zones
- develop management plans outlining actions to improve air quality in their air zones
Air zones – Managing air quality in Ontario
Ontario has identified three air zone categories under the federal Air Quality Management System based on factors such as pollutant sources, topography, meteorological patterns, population density and other potential factors that influence ambient air concentrations.
This has resulted in six air zone areas for the province as presented in the table below.
| Air zone categories | Air zone areas |
|---|---|
| Category 1 Areas with limited pollution from either point or non-point sources or transboundary influence |
Northern Ontario (except for Sudbury and Sault Ste. Marie) |
| Category 2 Areas under pressure from multiple sources including some or all of the following: non-point sources, smaller point sources, individual large industrial point sources, transboundary influences |
Southern Ontario (except for Sarnia/St. Clair Township and Hamilton) Sault Ste. Marie Sudbury |
| Category 3 Areas with a concentration of large industrial sources |
Sarnia/St. Clair Township Hamilton |
Ontario has designated 27 Air Quality Health Index ambient air monitoring stations located across the province as CAAQS reporting stations for each of the identified air zones in the province. These 27 designated stations report for each of the CAAQS parameters, except for SO2 which only has 9 CAAQS reporting stations. Designated sites normally refer to communities with populations greater than 100,000 and/or communities with large industrial sources.
CAAQS reporting stations in Ontario air zone categories and areas
This map presents the locations of the designated CAAQS reporting stations within the air zone areas of each air zone category in Ontario.
Air zone management levels and objectives
- The air zone management level is determined by the designated CAAQS reporting station(s) with the highest CAAQS metric within the air zone.
- Four “management levels” provide general guidance on the nature of the management, monitoring and reporting actions to be implemented in an air zone.
- The four management levels are identified by specific colours: red, orange, yellow and green, each corresponding to a contaminant concentration range that is specific to each CAAQS.
- Each management level is associated with a suite of actions that become progressively more stringent as air pollution concentrations approach or exceed the CAAQS.
The air zone management framework
Progressively more rigorous actions as air pollutant concentrations approach or exceed the CAAQS.
| Management level | Objective |
|---|---|
| Red The highest level of air quality management |
To reduce pollutant levels below the CAAQS through advanced air management actions |
| Orange The second highest level of air quality management |
To improve air quality through active air management and prevent exeedance of the CAAQS |
| Yellow The second lowest level of air quality management |
To improve air quality using early and ongoing actions for continuous improvement |
| Green The lowest level of air quality management |
To maintain good air quality through proactive air management measures to keep clean areas clean |
The management levels for each CAAQS pollutant are presented in the Appendix: Management Levels for CAAQS Pollutants.
Canadian Ambient Air Quality Standard achievement
Highlights
10-year trends
- 24-hour PM2.5 CAAQS metric concentrations have decreased by 19%.
- A trend was not detected in the annual PM2.5 CAAQS metric concentrations.
- 8-hour ozone CAAQS metric concentrations have decreased by 9%.
- 1-hour NO2 CAAQS metric concentrations have decreased by 9%.
- Annual NO2 CAAQS metric concentrations have decreased by 27%.
- 1-hour SO2 CAAQS metric concentrations have decreased by 19%.
- Annual SO2 CAAQS metric concentrations have decreased by 47%.
2020 results
- No exceedances of the 24-hour and annual PM2.5 CAAQS.
- Thirteen designated sites met the CAAQS of 62 ppb for ozone in 2020.
- No exceedances of the 1-hour and annual NO2 CAAQS.
- Eight of the 9 designated sites met the 1-hour CAAQS of 70 ppb for SO2 in 2020.
- No exceedances of the annual SO2 CAAQS.
10-year trends – Fine particulate matter
10-year trend of 24-hour PM2.5 CAAQS metrics in Ontario
This is a line graph showing the trend of the 24-hour fine particulate matter Canadian Ambient Air Quality Standard metrics from 2011 to 2020 in Ontario. This trend shows Ontario’s decrease of 19% over this 10-year period. To view the data for a specific location, please select the 'Stations' radio button and use the drop-down menu.
Note:
- The Ontario 10-year trend is based on data from 26 ambient air monitoring stations.
- The CAAQS for 24h PM2.5 (27 µg/m3) is based on the 98th percentile measurement annually, averaged over three consecutive years.
10-year trend of annual PM2.5 CAAQS metrics in Ontario
This is a line graph showing the trend of the annual fine particulate matter Canadian Ambient Air Quality Standard metrics from 2011 to 2020 in Ontario. There was no significant trend for Ontario over this 10-year period. To view the data for a specific location, please select the 'Stations' radio button and use the drop-down menu.
Note:
- The Ontario 10-year trend is based on data from 26 ambient air monitoring stations.
- The CAAQS for annual PM2.5 (8.8 µg/m3) is based on the annual mean averaged over three consecutive years.
The 10-year trends, based on the 24-hour and annual PM2.5 CAAQS metrics at each of the designated monitoring sites, are presented in Appendix: PM2.5 and ozone CAAQS metric trends for designated sites across Ontario (2011-2020).
2020 results – Fine particulate matter
| Averaging time | Range in CAAQS metrics Low |
Range in CAAQS metrics High |
Number of sites with CAAQS exceedances |
|---|---|---|---|
| PM2.5 24-hour |
13 µg/m3 at Sault Ste. Marie |
22 µg/m3 at Hamilton Downtown |
0 |
| PM2.5 annual |
4.9 µg/m3 at Sault Ste. Marie |
8.7 µg/m3 at Hamilton Downtown |
0 |
A summary of the 2020 CAAQS metric values for the 24-hour and annual PM2.5 at individual CAAQS reporting stations is in the Appendix: PM2.5 and ozone CAAQS metric values for designated sites across Ontario (2020).
PM2.5 CAAQS management levels for air zones across Ontario, 2020
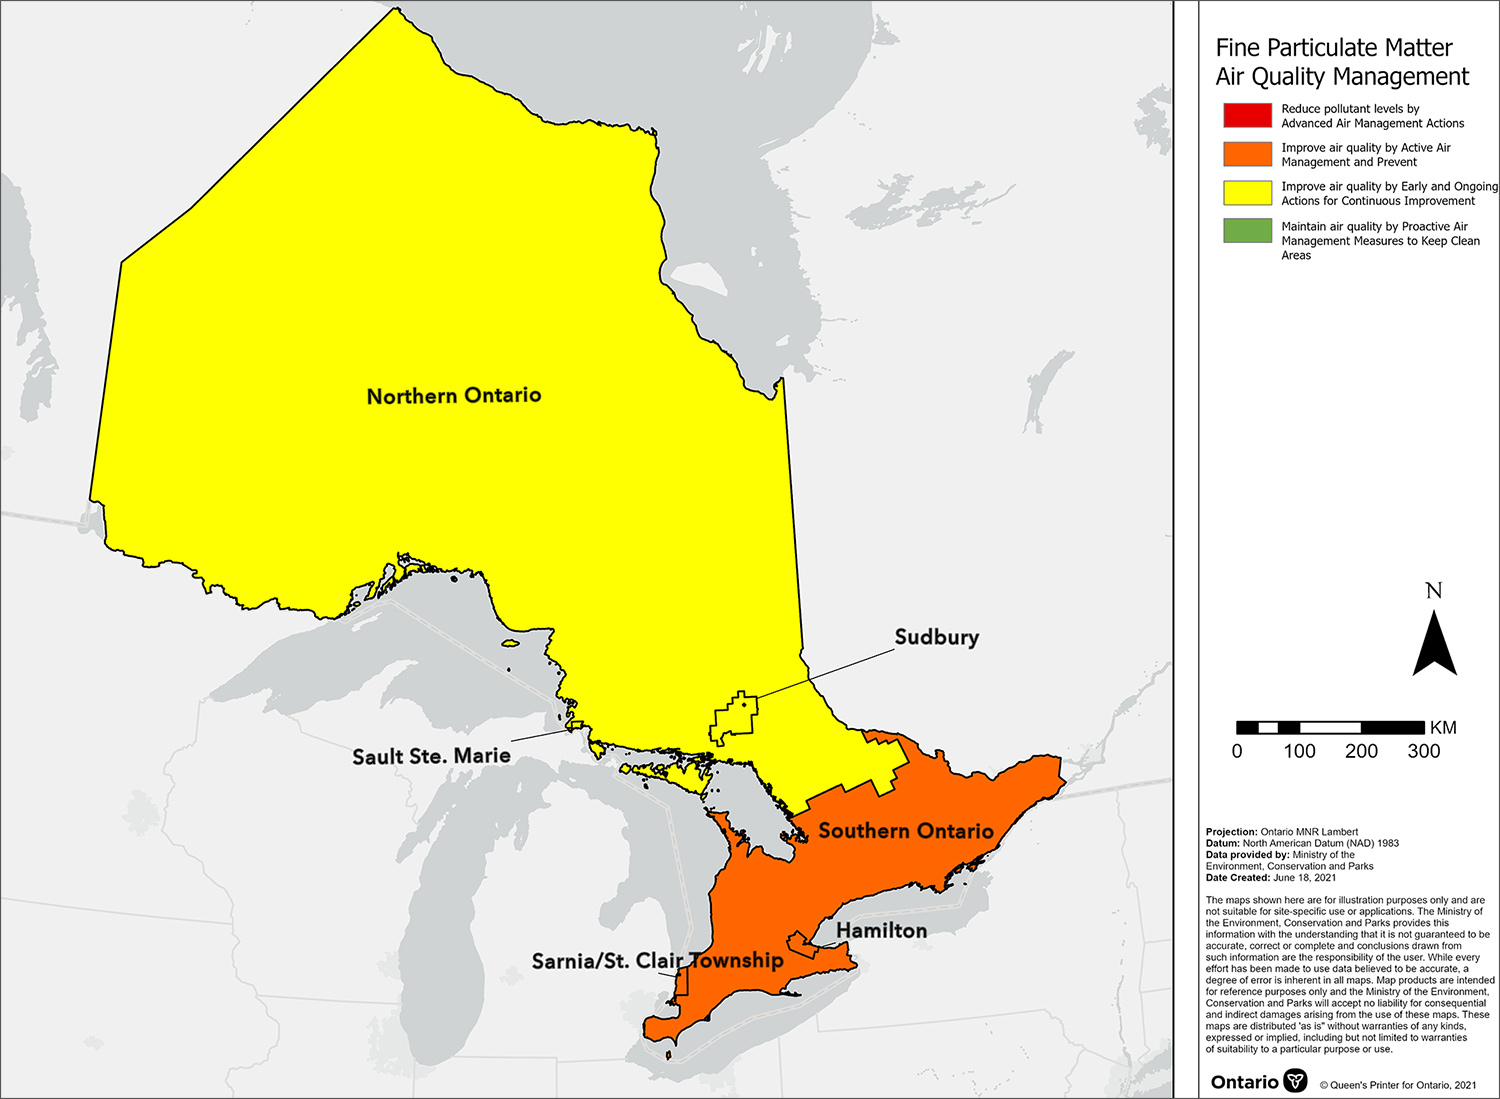
This map displays the fine particulate matter Canadian Ambient Air Quality Standard management levels for air zones across Ontario in 2020. These management levels are based on the highest CAAQS metric value reported by designated Canadian Ambient Air Quality Standard reporting sites within each air zone. According to the air quality management levels assigned, it is recommended for the Sarnia/St. Clair Township, Hamilton and Southern Ontario air zones to improve air quality by active air management and prevent exceedance of the CAAQS, while the Sudbury, Sault Ste. Marie and Northern Ontario air zones are encouraged to use early and ongoing actions for continuous improvement.
The PM2.5 CAAQS metrics associated with the management levels are presented in the Appendix: Management levels for PM2.5.
10-year trends – Ground-level ozone
10-year trend of 8-hour O3 CAAQS metrics in Ontario
This is a line graph showing the trend of the 8-hour ozone Canadian Ambient Air Quality Standard metrics from 2011 to 2020 in Ontario. This trend shows Ontario’s decrease of 9% over this 10-year period. Select another location from the drop-down menu to learn the percent change in air quality for other communities.
Note:
- The Ontario 10-year trend is based on data from 26 ambient air monitoring stations.
- The CAAQS for ozone (62 ppb) is based on the consecutive three-year average of the annual 4th highest daily maximum eight-hour running average.
The 10-year trends, based on the 8-hour ozone CAAQS metrics at each of the designated monitoring sites, are presented in Appendix: PM2.5 and ozone CAAQS metric trends for designated sites across Ontario (2011-2020).
2020 results – Ground-level ozone
| Averaging time | Low range | High range | Number of sites with CAAQS exceedances |
|---|---|---|---|
| Ozone 8-hour |
50 ppb at Thunder Bay |
72 ppb at Sarnia |
13 |
Transboundary influences, from both the U.S. and beyond, account for a significant portion of Ontario’s ozone when their levels are elevated. Ontario’s CAAQS reporting stations would have met the ozone CAAQS if transboundary flow days were excluded from the calculated metric using a weight of evidence (WOE) analysis.
A summary of the 2020 CAAQS metric values for 8-hour ozone at individual CAAQS reporting stations is in the Appendix: PM2.5 and ozone CAAQS metric values for designated sites across Ontario (2020).
Ozone CAAQS effective management levels for air zones across Ontario, 2020
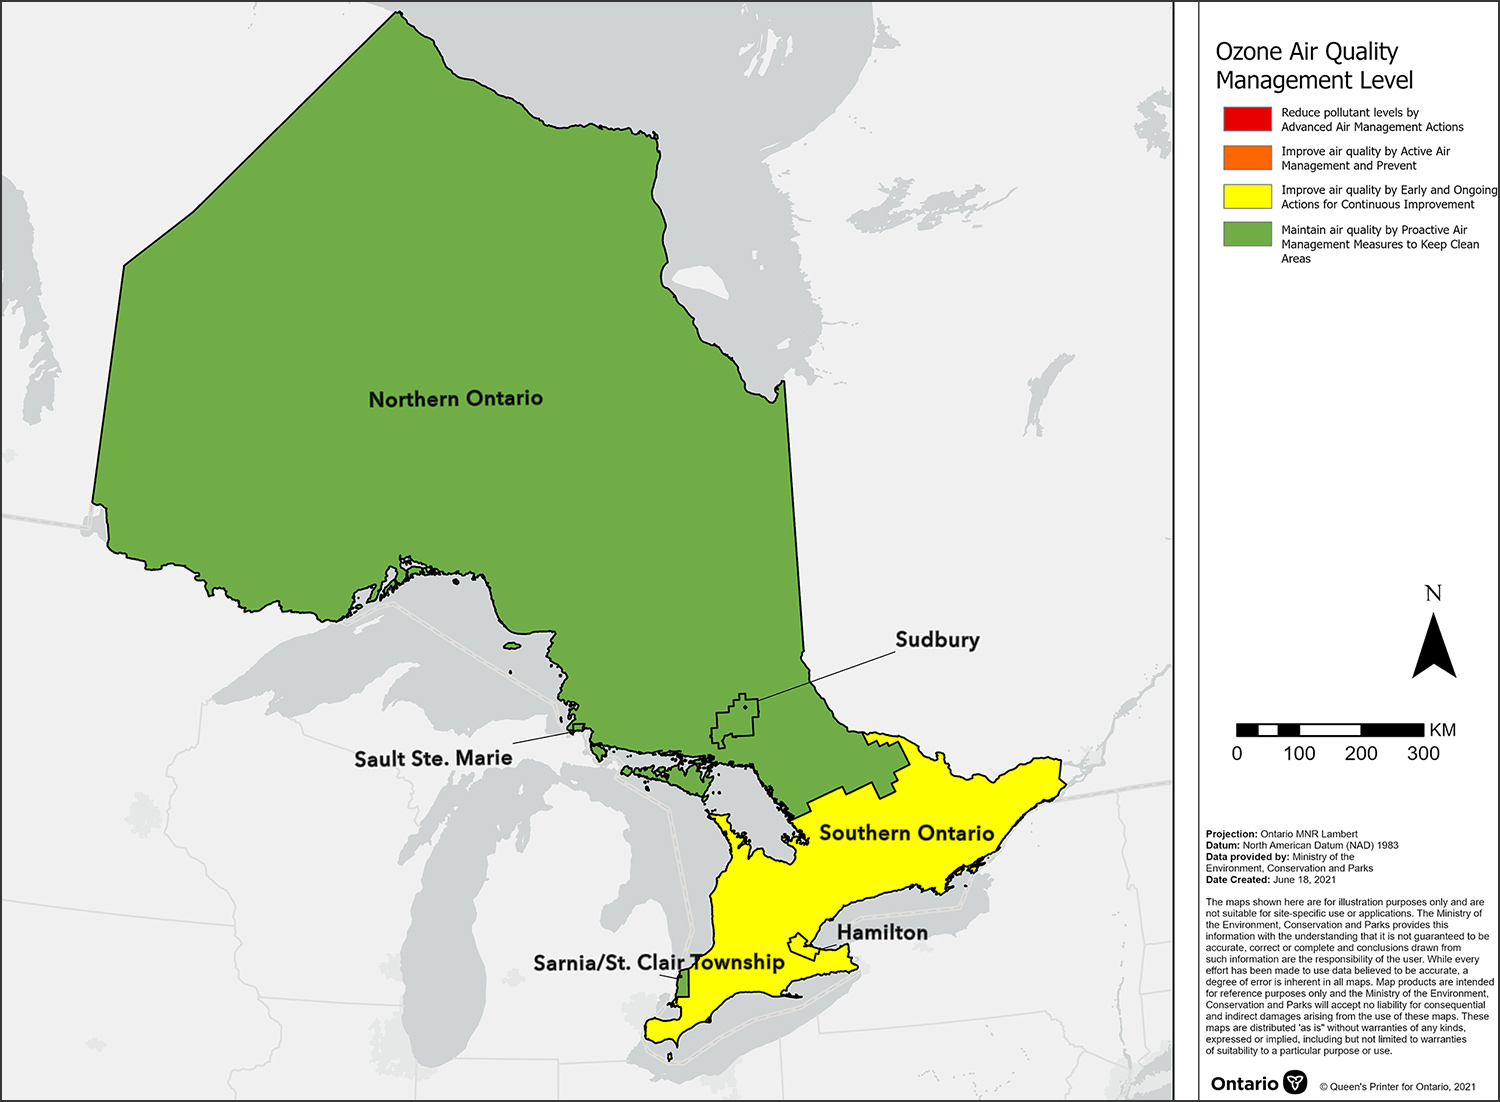
This map displays the ozone Canadian Ambient Air Quality Standard effective management levels for air zones across Ontario in 2020. The assignment of effective management levels was based upon the removal of transboundary influence using a Weight of Evidence (WOE) approach. These management levels are based on the highest Canadian Ambient Air Quality Standard metric value reported by designated CAAQS reporting sites within each air zone. According to the air quality management levels assigned, it is recommended for the Hamilton and Southern Ontario air zones to use early and ongoing actions for continuous improvement, while the Sarnia/St. Clair Township, Sudbury, Sault Ste. Marie and Northern Ontario air zones are encouraged to maintain good air quality through proactive management measures to keep clean areas clean.
The ozone CAAQS metrics associated with the management levels are presented in the Appendix: Management levels for ozone.
Weight of Evidence analysis
Transboundary influences, from both the U.S. and beyond, account for a significant portion of Ontario’s ozone when their levels are elevated. A Weight of Evidence (WOE) analysis demonstrates the influence of transboundary flow on days with elevated ozone concentrations and confirms that Ontario’s CAAQS reporting stations would have met the ozone CAAQS if transboundary flow days were excluded from the calculated metric.
The WOE approach consists of performing, evaluating, and documenting a series of technical analyses that collectively support the conclusion that exceedances of the CAAQS on a given day were influenced by transboundary flows or exceptional events. These analyses may include assessing the meteorological conditions (airflow, wind speed and direction, temperature, stability, etc.) and pollutant concentrations in Ontario and upwind locations.
10-year trends – Nitrogen Dioxide
10-year trend of 1-hour NO2 CAAQS metrics in Ontario
This is a line graph showing the trend of the 1-hour nitrogen dioxide Canadian Ambient Air Quality Standard metrics from 2011 to 2020 in Ontario. This trend shows Ontario’s decrease of 9% over this 10-year period. To view the data for a specific location, please select the 'Stations' radio button and use the drop-down menu.
Note:
- The Ontario 10-year trend is based on data from 25 ambient air monitoring stations.
- The CAAQS for 1-hour NO2 (60 ppb) is based on the 98th percentile of the daily maximum 1-hour average concentrations, averaged over three consecutive years.
10-year trend of annual NO2 CAAQS metrics in Ontario
This is a line graph showing the trend of the annual nitrogen dioxide Canadian Ambient Air Quality Standard metrics from 2011 to 2020 in Ontario. This trend shows Ontario’s decrease of 27% over this 10-year period. To view the data for a specific location, please select the 'Stations' radio button and use the drop-down menu.
Note:
- The Ontario 10-year trend is based on data from 26 ambient air monitoring stations.
- The CAAQS for annual NO2 (17 ppb) is based on the average over a single calendar year of all 1-hour average NO2 concentrations.
The 10-year trends, based on the 1-hour and annual NO2 CAAQS metrics at each of the designated monitoring sites, are presented in Appendix: NO2 and SO2 CAAQS metric trends for designated sites across Ontario (2011-2020).
2020 results – Nitrogen Dioxide
| Averaging time | Range in CAAQS metrics Low |
Range in CAAQS metrics High |
Number of sites with CAAQS exceedances |
|---|---|---|---|
| NO2 1-hour |
23 ppb at Oshawa | 51 ppb at Milton and Toronto West | 0 |
| NO2 annual |
3.5 ppb at Kingston |
12.3 ppb at Toronto Downtown | 0 |
A summary of the 2020 CAAQS metric values for the 1-hour and annual NO2 at individual CAAQS reporting stations is in the Appendix: NO2 and SO2 CAAQS metric values for designated sites across Ontario (2020).
NO2 CAAQS management levels for air zones across Ontario, 2020
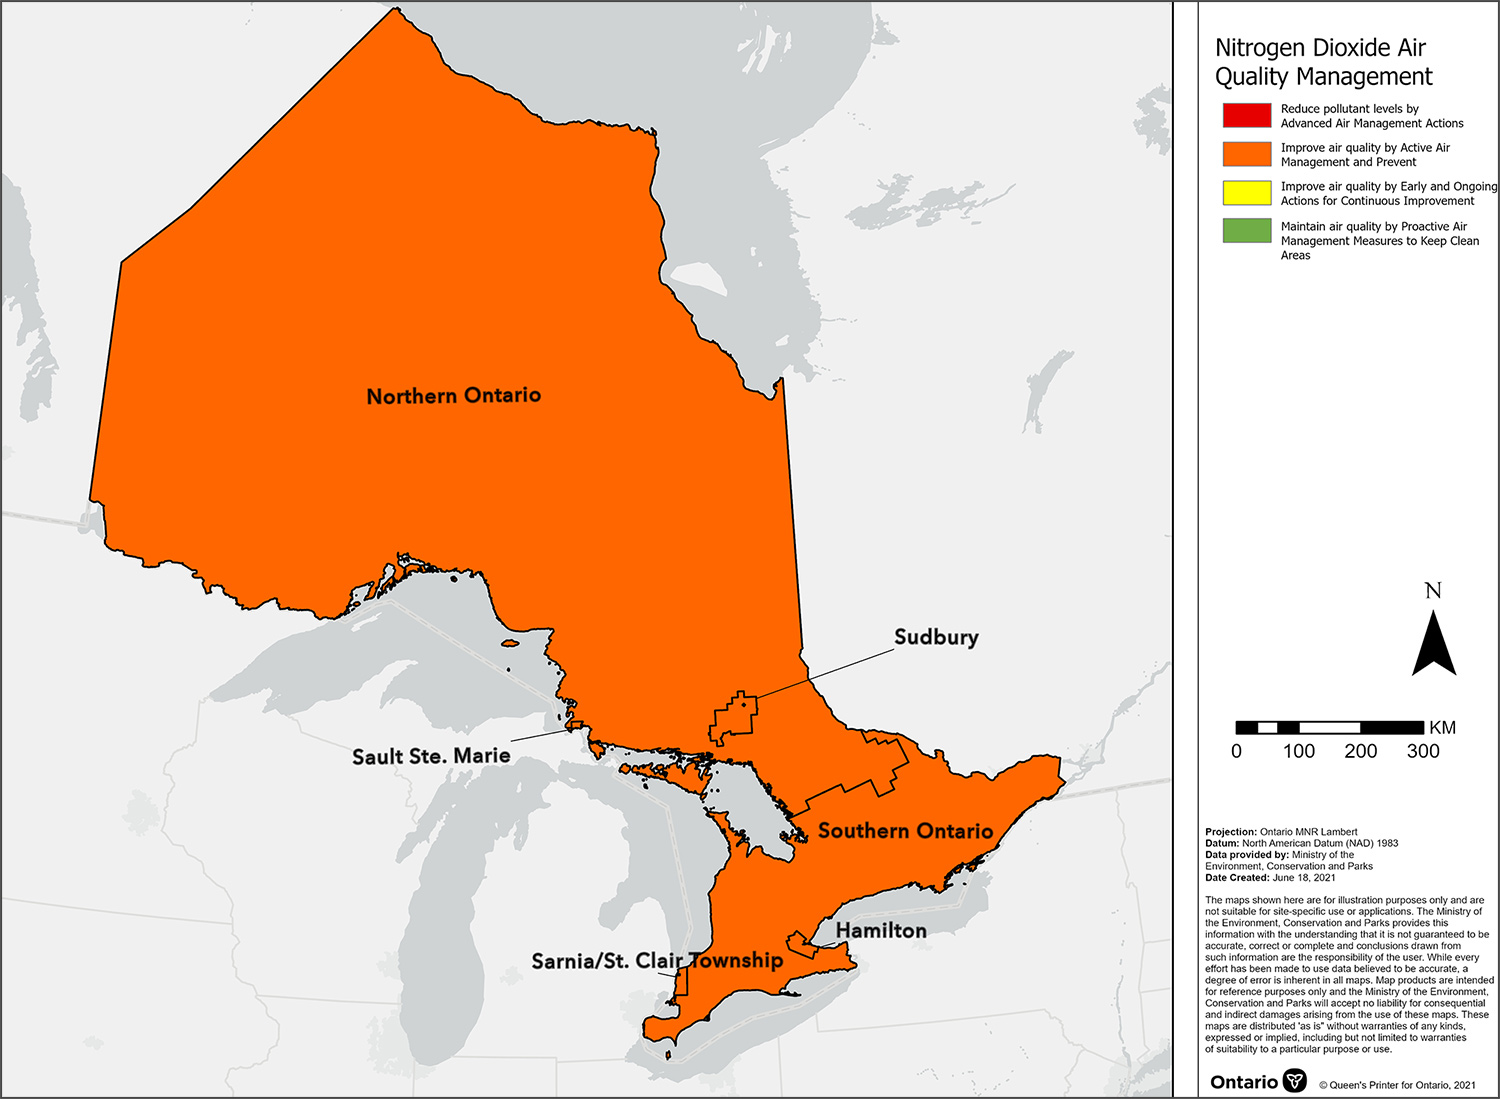
This map displays the nitrogen dioxide Canadian Ambient Air Quality Standard management levels for air zones across Ontario in 2020. These management levels are based on the highest CAAQS metric value reported by designated Canadian Ambient Air Quality Standard reporting sites within each air zone. According to the air quality management levels assigned, it is recommended for all air zones in Ontario to improve air quality by active air management and prevent exceedance of the CAAQS.
The NO2 CAAQS metrics associated with the management levels are presented in the Appendix: Management levels for NO2.
10-year trends – Sulphur Dioxide
10-year trend of 1-hour SO2 CAAQS metrics in Ontario
This is a line graph showing the trend of the 1-hour sulphur dioxide Canadian Ambient Air Quality Standard metrics from 2011 to 2020 in Ontario. This trend shows Ontario’s decrease of 19% over this 10-year period. To view the data for a specific location, please select the 'Stations' radio button and use the drop-down menu.
Note:
- The Ontario 10-year trend is based on data from 9 ambient air monitoring stations.
- The CAAQS for 1-hour SO2 (70 ppb) is based on the annual 99th percentile of the SO2 daily maximum 1-hour average concentrations, averaged over three consecutive years.
10-year trend of annual SO2 CAAQS metrics in Ontario
This is a line graph showing the trend of the annual sulphur dioxide Canadian Ambient Air Quality Standard metrics from 2011 to 2020 in Ontario. This trend shows Ontario’s decrease of 47% over this 10-year period. To view the data for a specific location, please select the 'Stations' radio button and use the drop-down menu.
Note:
- The Ontario 10-year trend is based on data from 9 ambient air monitoring stations.
- The CAAQS for annual SO2 (5.0 ppb) is based on the average over a single calendar year of all 1-hour average SO2 concentrations.
The 10-year trends, based on the 1-hour and annual SO2 CAAQS metrics at each of the designated monitoring sites, are presented in Appendix: NO2 and SO2 CAAQS metric trends for designated sites across Ontario (2011-2020).
2020 results – Sulphur Dioxide
| Averaging time | Range in CAAQS metrics Low |
Range in CAAQS metrics High |
Number of sites with CAAQS exceedances |
|---|---|---|---|
| SO2 1-hour |
2 ppb at Ottawa Downtown | 87 ppb at Hamilton Downtown | 1 |
| SO2 annual |
0.1 ppb at Toronto North and Ottawa Downtown | 3.7 ppb at Hamilton Downtown | 0 |
A summary of the 2020 CAAQS metric values for the 1-hour and annual SO2 at individual CAAQS reporting stations is in the Appendix: NO2 and SO2 CAAQS metric values for designated sites across Ontario (2020).
SO2 CAAQS management levels for air zones across Ontario, 2020
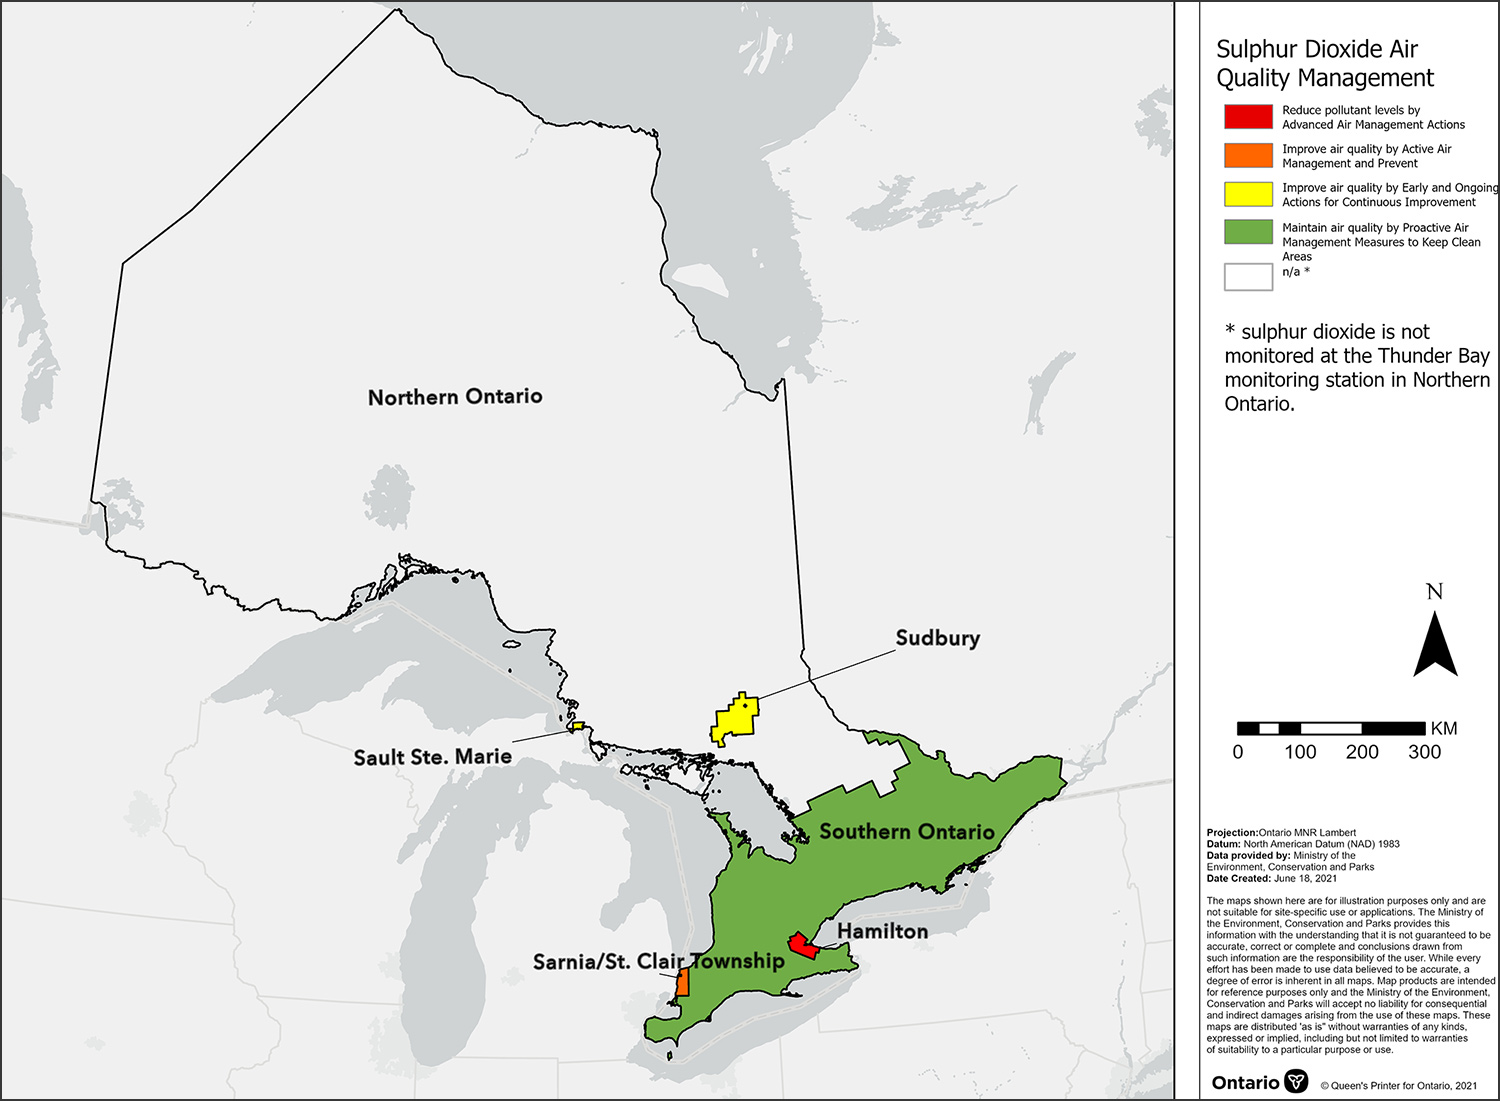
This map displays the sulphur dioxide Canadian Ambient Air Quality Standard management levels for air zones across Ontario in 2020. These management levels are based on the highest CAAQS metric value reported by designated Canadian Ambient Air Quality Standard reporting sites within each air zone. According to the air quality management levels assigned, it is recommended for the Hamilton air zone to reduce pollutant levels below the CAAQS through advanced air management actions. For the Sarnia/St. Clair Township air zone, it is recommended to improve air quality through active air management and prevent exceedance of the CAAQS. Using early and ongoing actions for continuous improvement is encouraged for both the Sudbury and Sault Ste. Marie air zones, while it is suggested for the Southern Ontario air zone to maintain good air quality through proactive management measures to keep clean areas clean. Note: The designated CAAQS site in the Northern Ontario air zone does not measure SO2.
The SO2 CAAQS metrics associated with the management levels are presented in the Appendix: Management levels for SO2.