2018 Apiculture winter loss report
2018 Honey bee colony winter mortality
The number of colonies operated by beekeepers fluctuates throughout a year. After a decrease in colony numbers over the winter months, a beekeeper can build up colony numbers during the summer months by splitting larger, healthy colonies into smaller nucleus colonies. As of December 31, 2017, Ontario beekeepers had registered 105,244 colonies which represents the number of registered colonies that were alive going into the winter of 2017-2018.
Overwinter mortality for 2017-2018 for commercial beekeepers operating in Ontario was estimated to be 46%.
The estimated loss reported for small-scale beekeepers was also 46% and the 2018 estimation for honey bee loss averaged between all of Canada was 33%.
Who we surveyed
In the spring of 2018, the survey was distributed to:
- 186 registered commercial beekeepers (defined as operating 50 or greater colonies)
- 400 randomly selected registered small-scale beekeepers (defined as operating 49 or fewer colonies)
Beekeepers had the option of responding to the survey:
- electronically via an online survey
- by submitting a completed hard copy
- by phone
The survey is voluntary and all responses are self-reported by beekeepers. Data is not verified by the Ministry of Agriculture, Food and Rural Affairs (OMAFRA) or any other independent body.
Responses were received from 117 commercial beekeepers and 118 small-scale beekeepers which represents 40% of beekeepers who received the survey.
Of the beekeepers who were registered in Ontario as of December 31, 2017, responses were received from 63% of commercial beekeepers representing 63,236 colonies and from 4% of small-scale beekeepers representing 1,287 colonies (Table 1 and Table 2). Combined, the responses represent 61% of the total number of registered colonies.
Table 1. Number of beekeepers, by region, responding to the 2018 Ontario Apiculture Winter Loss Survey
| Beekeeping regions | # of commercial beekeeper respondents | % of commercial beekeeper respondents | # of small-scale beekeeper respondents | % of small-scale beekeepers respondents |
|---|---|---|---|---|
| Central | 41 | 35.0% | 29 | 24.6% |
| East | 23 | 19.7% | 36 | 30.5% |
| North | 5 | 4.3% | 17 | 14.4% |
| South | 36 | 30.8% | 27 | 22.9% |
| Southwest | 12 | 10.3% | 9 | 7.6% |
Table 2. Estimated overwinter mortality for 2017-2018
| Beekeeper type | # of full-sized colonies put into winter in fall 2017 | # of viable overwintered colonies as of May 15, 2018 | # of non-viable colonies as of May 15, 2018 | Overwinter mortality (%) |
|---|---|---|---|---|
| Commercial | 63,236 | 34,327 | 28,909 | 45.7% |
| Small-scale | 1,287 | 702 | 585 | 45.5% |
Results
Both registered commercial and small-scale beekeepers in Ontario reported an approximate 46% overwinter mortality during the winter of 2017-2018 (Table 2). In Canada, 15% is the maximum level of overwinter loss considered to be acceptable and sustainable by the industry (Furgala and McCutcheon, 1992; CAPA, 2007 to 2016).
The estimated overwinter honey bee mortality and the number of respondents varied by beekeeping region (Table 3). Commercial beekeepers reported the greatest losses in the east region while small-scale beekeepers reported the highest losses in the south region. Overall, mortality during the 2017-2018 winter differed by approximately 0.2 percentage points between commercial and small-scale beekeepers (Table 2).
Table 3. Number of commercial and small-scale beekeeper survey respondents and the % overwinter mortality in 2018 for each beekeeping region in Ontario
| Beekeeping region | # of commercial beekeeper respondents | Commercial beekeeper overwinter mortality (%) | # of small-scale beekeeper respondents | Small-scale beekeeper overwinter mortality (%) |
|---|---|---|---|---|
| Central | 41 | 52.8% | 29 | 44.2% |
| East | 23 | 56.2% | 36 | 45.1% |
| North | 5 | 42.0% | 17 | 45.3% |
| South | 36 | 43.6% | 27 | 50.7% |
| Southwest | 12 | 32.7% | 9 | 25.4% |
| Total | 117 | 45.7% | 118 | 45.5% |
When respondents were grouped by operation size (number of colonies managed), the honey bee mortality during the winter of 2017-2018 ranged from 41.6% to 46.8% (Table 4). Beekeepers operating 201 to 500 colonies reported fewer honey bee colony losses (41.6%) than all other beekeeping operation sizes. Similar to previous years, the number of respondents in the 501 to 1000 colonies category remained low, however the percent in overwinter mortality reported in this group tripled.
The greatest number of survey respondents had beekeeping operations with fewer than 10 colonies and this group reported an overwinter honey bee mortality of 43%. Unlike previous years, operations with greater than 1000 colonies reported the greatest overwinter honey bee mortality (approximately 47%).
Table 4. Overwinter honey bee mortality during the winter of 2017-2018 by size of beekeeping operation (number of colonies operated)
| # of respondents | # of colonies reported in the fall of 2017 | Overwinter mortality (%) |
|---|---|---|
| 75 | <10 | 43.4% |
| 43 | 10-49 | 45.9% |
| 71 | 50-200 | 42.5% |
| 20 | 201-500 | 41.6% |
| 8 | 501-1000 | 45.3% |
| 18 | >1000 | 46.8% |
Main factors of bee mortality
Beekeepers were asked to report on what they believed were the main factors contributing to their overwinter honey bee mortalities; they were able to select as many reasons as they felt were applicable. These opinions may be based on observable symptoms or beekeeper experience, judgment or best estimate.
The most commonly reported factors influencing overwinter mortality (Table 5) by commercial beekeepers included:
- weather
- poor queens
The most commonly reported factors influencing overwinter mortality (Table 5) by small-scale beekeepers included:
- weather
- weak colonies in the fall
Table 5. Contributing factors to honey bee colony mortality during the winter of 2017-2018 as reported by commercial and small-scale beekeepers
| Suspected cause(s) of colony loss | # of commercial beekeepers reporting | # of small-scale beekeepers reporting |
|---|---|---|
| Starvation | 30 | 21 |
| Poor queens | 50 | 16 |
| Weather | 74 | 46 |
| Ineffective varroa control | 34 | 14 |
| Nosema | 22 | 10 |
| Weak colonies in the fall | 36 | 30 |
| Other | 46 | 25 |
| Don’t know | 24 | 27 |
Management practices for pests and disease
There are many theories which aim to explain the observation of increased overwinter honey bee mortality in recent years. The scientific literature suggests that honey bee health is complex and that there are many factors that contribute to honey bee colony health. For example, colonies may be weakened or killed by pests and/or diseases, such as infestation by the parasitic mite, Varroa destructor. Poor management practices, including small cluster size, inadequate food stores and inadequate control of varroa mites may contribute to winter losses. Other factors such as severe weather, habitat loss and exposure to pesticides are environmental stressors which may potentially impact colony health.
While some factors contributing to colony mortality, such as severe weather, are not within the direct control of the beekeeper, monitoring for and the treatment of pests and diseases can be controlled by the beekeeper. For this reason, the 2018 winter loss survey focused on the surveillance, management and monitoring of 3 major pest and disease threats to colony health:
- varroa mites
- nosema
- American foulbrood
Varroa mites (Varroa destructor)
In this survey, beekeepers were asked how they monitored for varroa mite infestations (Figure 1) and which treatments were used at the beginning (spring) and the end (fall) of the 2017 beekeeping season (Table 6).
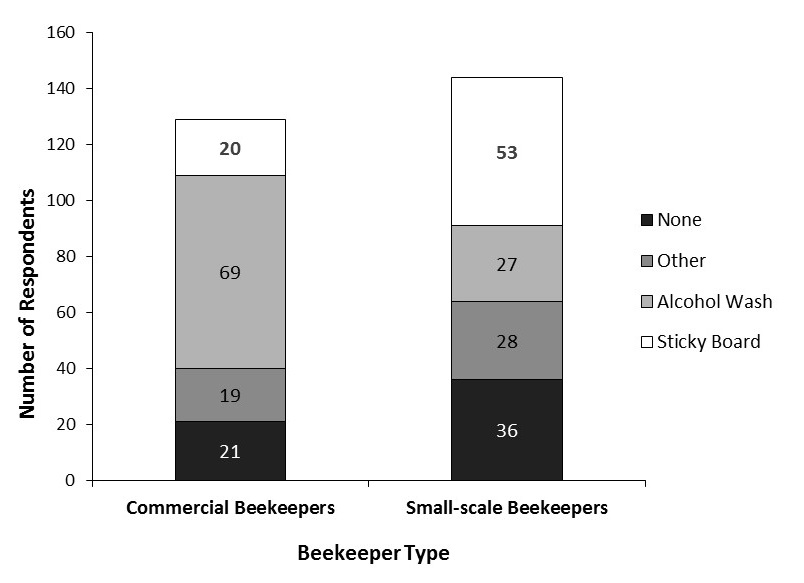
Figure 1. Type of varroa mite monitoring method used by commercial and small-scale beekeepers in 2017. Survey respondents could reply with more than 1 answer.
Accessible description of figure 1
Proportion of beekeepers monitoring for varroa mites
Of the beekeepers who responded to the varroa mite monitoring question, 84% of commercial beekeepers and 75% of small-scale beekeepers stated that they monitor for varroa mite infestation in their colonies. Of those, a number of monitoring methods were used, the most common being either an alcohol wash or a sticky board.
Some beekeepers used more than 1 method to monitor for varroa mites. When the response “other” was selected, the beekeeper commonly reported that they visually checked their colonies for varroa mites or used the “sugar shake” method. However, neither of these methods are recommended as visually checking for mites is not proven to yield usable information and the sugar shake method can be unreliable and it is not tied to established thresholds for Ontario.
Treatments used to control varroa mites
Ontario beekeepers use a variety of treatment options to manage varroa mites (Table 6). In spring and fall of 2017, the most common method of varroa mite treatment reported by commercial beekeepers was Apivar®. Commercial beekeepers also reported using 65% liquid formic acid (40 ml multiple application), Mite Away Quick Strips™ and oxalic acid. Small-scale beekeepers indicated a preference for Mite Away Quick Strips™ over other forms of mite control options. Although there has been documented resistance to some mite control products such as Apistan® and Checkmite+™, there have been no documented cases of Apivar®-resistant varroa mites in Ontario to date.
The 2 least commonly used treatments by both commercial and small-scale beekeepers were Checkmite+™ and Thymovar. To slow the development of resistance to chemical treatments, Ontario beekeepers are advised to rotate varroa mite treatments as part of an integrated pest management strategy.
Table 6. Treatments reported by commercial and small-scale beekeepers used to control varroa mites in the spring and fall of 2017. Survey respondents could select more than 1 answer.
| Varroa mite treatment (active ingredient) | Spring 2017 # of commercial beekeepers | Spring 2017 # of small-scale beekeepers | Fall 2017 # of commercial beekeepers | Fall 2017 # of small-scale beekeepers |
|---|---|---|---|---|
| Apistan® (fluvalinate) | 5 | 5 | 15 | 5 |
| CheckMite+™ (coumaphos) | 0 | 1 | 0 | 0 |
| Apivar® (amitraz) | 33 | 11 | 57 | 17 |
| Thymovar (thymol) | 3 | 4 | 5 | 2 |
| 65% formic acid – 40 ml multiple application | 29 | 9 | 29 | 12 |
| 65% formic acid – 250 ml single application | 7 | 6 | 11 | 5 |
| Mite Away Quick Strips™ (formic acid) | 17 | 27 | 24 | 37 |
| Oxalic Acid | 14 | 3 | 47 | 23 |
| Other | 11 | 7 | 3 | 6 |
| None | 25 | 47 | 4 | 29 |
Nosema spp. (N. apis and N. ceranae)
The majority of survey respondents did not treat for nosema during 2017 (Table 7). 81% of beekeepers (both commercial and small-scale) who responded to this survey question indicated that nosema treatment was not applied in the spring and 80% of respondents did not treat for the disease in the fall of 2017.
Table 7. Treatments reported by commercial and small-scale beekeepers used to control nosema in the spring and fall of 2017
| Nosema treatment | Spring 2017 # of commercial beekeepers | Spring 2017 # of small-scale beekeepers | Fall 2017 # of commercial beekeepers | Fall 2017 # of small-scale beekeepers |
|---|---|---|---|---|
| Fumagillin | 20 | 17 | 21 | 22 |
| Other | 1 | 5 | 0 | 2 |
| None | 94 | 94 | 90 | 90 |
American foulbrood (Paenibacillus larvae)
The majority of commercial beekeepers (74%) who responded to this survey question treated for American foulbrood (AFB) during 2017 and the most common treatment reported was oxytetracycline (Table 8). Thirty-one% of small-scale beekeepers reported treating for AFB in the spring and 40% of small-scale beekeepers used AFB treatments in the fall (Table 8). Although oxytetracycline-resistant AFB has been detected in other jurisdictions such as the USA, there have not been any documented cases of resistant forms in Ontario to date.
Table 8. Treatments reported by commercial and small-scale beekeepers used to control American foulbrood in the spring and fall of 2017
| American foulbrood treatment | Spring 2017 # of commercial beekeepers | Spring 2017 # of small-scale beekeepers | Fall 2017 # of commercial beekeepers | Fall 2017 # of small-scale beekeepers |
|---|---|---|---|---|
| Oxytetracycline | 80 | 35 | 75 | 43 |
| Tylosin | 0 | 0 | 0 | 0 |
| Other | 0 | 0 | 0 | 1 |
| None | 34 | 78 | 40 | 66 |
Ontario’s overwinter mortality
Ontario is working collaboratively at the national level coordinating the winter loss survey with all other provinces and the Canadian Association of Professional Apiculturists (CAPA). This has the advantage of leveraging consistent and accurate methods in gathering data and assessing pest, disease and management issues across Canada, while allowing for each province to focus on their own unique areas of interest and coordinate with existing programs. CAPA has compiled overwinter mortality data provided by each province and published an annual report on national honey bee colony losses since 2007. Ontario beekeepers have frequently reported overwinter mortalities higher than the national average (Figure 2).
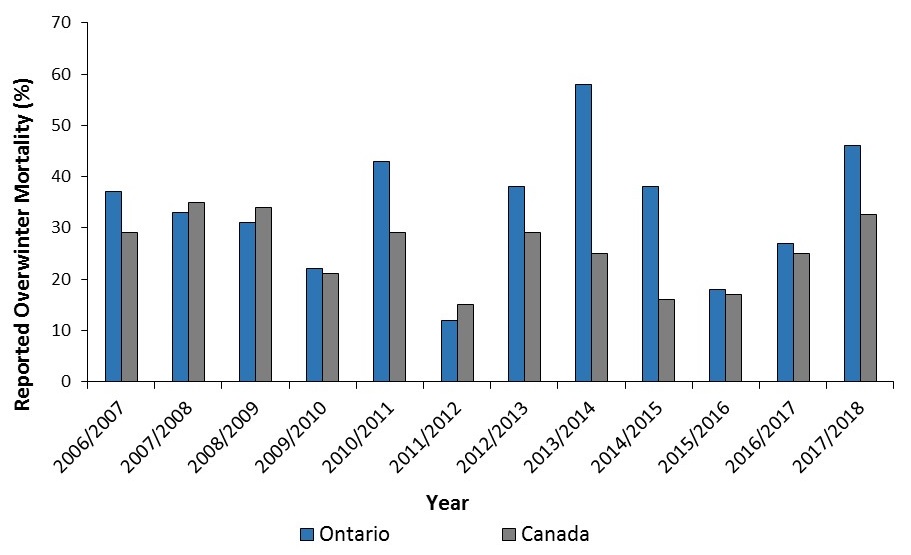
Figure 2. Overwinter mortality (%) reported by commercial beekeepers in Ontario (blue) and Canada (grey) from 2006-2007 to 2017-2018.
Accessible description of figure 2
Since 2010, Ontario beekeepers have reported annual overwinter honey bee colony losses of 15% or greater in all years except 2012 (12%). In Canada, 15% is the maximum of overwinter losses considered to be acceptable and sustainable by the apiculture industry (Furgala and McCutcheon, 1992; CAPA, 2007 to 2016). During the winter of 2013-2014, Ontario beekeepers reported a record 58% overwinter mortality. In 2014-2015 and 2015-2016, the estimated overwinter mortality declined to 38% and 18% respectively. This was followed by an increase to 27% and 46% overwinter mortality in 2016-2017 and 2017-2018 respectively.
General comments and discussion
The annual Ontario Apiculture Winter Loss Survey is a valuable tool for gathering information on colony mortality and the management practices used by beekeepers to monitor and control pests and diseases. Honey bee colony mortality differs from year to year, among different beekeeping regions as well as between individual beekeeping operations. This survey alone cannot paint a complete picture of honey bee health as honey bee health is complex and it is difficult to attribute overwinter losses to any single cause. The main stress factors influencing declines in the number of pollinators in Ontario have been identified as:
- extreme weather and climate change
- disease, pests and genetics
- reduced habitat and poor nutrition
- exposure to pesticides
A number of actions have been taken by the provincial government, with ongoing efforts to support the sector including:
- investing $1 million in innovative pollinator health research
- working to restore and protect pollinator habitat across the province
- developing and delivering a suite of activities and programs designed to enhance beekeeper knowledge of emerging issues and research and best management and integrated pest management practices
Additionally, commercial beekeepers have access to a production insurance plan to help them manage financial loss from overwinter bee colony damage or loss. Bee Health Production Insurance gives participating beekeepers the confidence and security to reinvest in their operations, encouraging greater innovation, profitability and job creation and provides them with the same financial support that beekeepers in other provinces receive. The government is working to strengthen the apiculture industry. OMAFRA is committed to working with farmers, beekeepers and other stakeholders to implement long-term, sustainable initiatives to improve the health of bees and other pollinators.
References
Canadian Association of Professional Apiculturists (CAPA) Statement on honey bee losses in Canada. 2007, 2008, 2009, 2010, 2011, 2012, 2013, 2014, 2015 and 2016.
Furgala B. and McCutcheon, D.M. 1992. Wintering productive colonies. In Graham J M (Ed). The hive and the honey bee (revised edition). Dadant and Sons; Hamilton, IL, USA pp. 829-868
Accessible image descriptions
Figure 1. Type of varroa mite monitoring method used by commercial and small-scale beekeepers in 2017
Figure 1 shows the type of varroa mite monitoring method used by commercial and small-scale beekeepers in 2017. Survey respondents could reply with more than 1 answer. Commercial beekeepers reported 20 cases of the sticky board method, 69 cases of the alcohol wash method, 19 cases of other and 21 cases of no monitoring for varroa mites. Small-scale beekeepers reported 53 cases of the sticky board method, 27 cases of the alcohol wash method, 28 cases of other and 36 cases of no monitoring for varroa mites.
Figure 2. Overwinter mortality (%) reported by commercial beekeepers in Ontario (blue) and Canada (grey) from 2006-2007 to 2017-2018
Figure 2 shows the percentage of overwinter mortality reported by beekeepers in both Ontario and Canada from 2007 to 2018. The reported overwinter mortality in Ontario and Canada (respectively) was the following: 2007 – 37% and 29%; 2008 – 33% and 35%; 2009 – 31% and 34%; 2010 – 22% and 21%; 2011 – 43% and 29%; 2012 – 12% and 15%; 2013 – 38% and 29%; 2014 – 58% and 25%; 2015 – 38% and 16%; 2016 – 18% and 17%; 2017 – 27% and 25%; 2018 – 46% and 33%.