2020 Apiculture winter loss report
2020 Honey bee colony winter mortality
Overwinter mortality for 2019-2020 for commercial beekeepers operating in Ontario was estimated to be 19%, down from the 23% estimated for the winter of 2018-2019.
The estimate for commercial beekeepers in Ontario was approximately 10% less than the estimated loss reported for small-scale beekeepers (30%).
The 2020 estimation for honey bee loss averaged between all of Canada was 30%.
Who we surveyed
In the spring of 2020, the survey was distributed via email to:
- 119 of the 195 registered commercial beekeepers (defined as operating 50 or greater colonies)
- 300 randomly selected registered small-scale beekeepers (defined as operating 49 or fewer colonies)
Due to the COVID-19 pandemic, the survey was sent electronically to beekeepers who provided the Ministry of Agriculture, Food and Rural Affairs (OMAFRA) with their email address.
The survey is voluntary and all responses are self-reported by beekeepers. Data is not verified by OMAFRA or any other independent body.
Responses were received from 59 commercial beekeepers and 116 small-scale beekeepers which represents 42% of beekeepers who received the survey.
Of the beekeepers who were registered in Ontario as of December 31, 2019, responses were received from 30% of commercial beekeepers representing 40,562 colonies and from 5% of small-scale beekeepers representing 1,033 colonies (Tables 1 and 2). Combined, the responses represent 45.9% of the total number of registered colonies.
Table 1. Number of beekeepers, by region, responding to the 2020 Ontario Apiculture Winter Loss Survey
| Beekeeping regions | # of commercial beekeeper respondents | % of commercial beekeeper respondents | # of small-scale beekeeper respondents | % of small-scale beekeepers respondents |
|---|---|---|---|---|
| Central | 21 | 36% | 36 | 31% |
| East | 11 | 19% | 29 | 25% |
| North | 1 | 2% | 12 | 10% |
| South | 19 | 32% | 31 | 27% |
| Southwest | 7 | 12% | 8 | 7% |
Table 2. Estimated overwinter mortality for 2019-2020
| Beekeeper type | # of full-sized colonies put into winter in fall 2019 | # of viable overwintered colonies as of May 15, 2020 | # of non-viable colonies as of May 15, 2020 | Overwinter mortality (%) |
|---|---|---|---|---|
| Commercial | 40,562 | 32,831 | 7,731 | 19.1% |
| Small-scale | 1,033 | 725 | 308 | 29.8% |
Results
The estimated overwinter honey bee mortality and the number of respondents varied by beekeeping region (Table 3). The majority of commercial beekeepers who responded to the survey were from the central and south beekeeping regions. These areas are known to have the greatest beekeeping activity. Responses from small-scale beekeeping operations were largely from the central, east and south beekeeping regions (Table 1).
Commercial beekeepers reported the greatest losses in the east region while small-scale beekeepers reported the highest losses in the north region. Overall, mortality during the 2019-2020 winter was approximately 10.7 percentage points lower with commercial than small-scale beekeepers (Table 2).
Table 3. Number of commercial and small-scale beekeeper survey respondents and the % overwinter mortality in 2020 for each beekeeping region in Ontario
| Beekeeping region | # of commercial beekeeper respondents | Commercial beekeeper overwinter mortality (%) | # of small-scale beekeeper respondents | Small-scale beekeeper overwinter mortality (%) |
|---|---|---|---|---|
| Central | 21 | 18.3% | 36 | 26.2% |
| East | 11 | 30.4% | 29 | 32.3% |
| North | 1 | 0% | 12 | 37.9% |
| South | 19 | 16.7% | 31 | 31.0% |
| Southwest | 7 | 14.9% | 8 | 16.3% |
| Total | 59 | 19.1% | 116 | 29.8% |
When respondents were grouped by operation size (number of colonies managed), the honey bee mortality during the winter of 2019-2020 ranged from 13.5% to 39.6% (Table 4). Beekeepers operating 501 to 1000 colonies reported fewer honey bee colony losses (13.5%) than all other beekeeping operation sizes. The greatest number of survey respondents had beekeeping operations with fewer than 10 colonies and this group reported the highest overwinter honey bee mortality of 39.6%.
This general trend that shows beekeepers with the highest number of colonies (501-1000 and >1000) having the lowest loss (13.5% and 17.6% respectively) and beekeepers with the lowest number of colonies (<10) having the highest loss (39.6%) is consistent with the trend of all commercial beekeepers averaging approximately 10% less winter loss than the small-scale beekeepers (Table 2).
This is the first year in the history of this survey where this large of a difference between commercial and small-scale beekeepers has been reported. This may indicate that beekeepers who are operating higher numbers of colonies may have better training, more resources and more experience. However, this may also be an oversimplification of the data as it doesn’t take into account the variability in beekeeping practices employed between small-scale beekeepers. Whatever the reason, this data should be considered for targeting of messaging and training for beekeepers while keeping in mind that management practices and environmental conditions may change and there is a need for both commercial and small-scale beekeepers to be well trained and up to date with credible, regional information and best management practices.
Table 4. Overwinter honey bee mortality during the winter of 2019-2020 by size of beekeeping operation (number of colonies operated)
| # of respondents | # of colonies reported in the fall of 2019 | Overwinter mortality (%) |
|---|---|---|
| 88 | <10 | 39.6% |
| 28 | 10-49 | 24.6% |
| 33 | 50-200 | 26.6% |
| 12 | 201-500 | 27.7% |
| 6 | 501-1000 | 13.5% |
| 8 | >1000 | 17.6% |
Main factors of bee mortality
Beekeepers were asked to report on what they believed were the main factors contributing to their overwinter honey bee mortalities; they were able to select as many reasons as they felt were applicable. These opinions may be based on observable symptoms or beekeeper experience, judgment or best estimate.
The most commonly reported factors influencing overwinter mortality (Table 5) by both commercial and small-scale beekeepers included:
- poor queens
- weak colonies in the fall
- weather
Other commonly reported contributing factors reported by commercial beekeepers included:
- starvation
- ineffective varroa control
Table 5. Contributing factors to honey bee colony mortality during the winter of 2019-2020 as reported by commercial and small-scale beekeepers
| Suspected cause(s) of colony loss | % of commercial beekeepers reporting | % of small-scale beekeepers reporting |
|---|---|---|
| Poor queens | 46% | 18% |
| Weak colonies in the fall | 37% | 25% |
| Weather | 37% | 19% |
| Starvation | 32% | 14% |
| Ineffective varroa control | 27% | 12% |
| Other | 15% | 16% |
| Don’t know | 5% | 22% |
| Nosema | 3% | 3% |
Management practices for pests and disease
Varroa mites (Varroa destructor)
In this survey, beekeepers were asked how they monitored for varroa mite infestations (Figure 1) and which treatments were used at the beginning (spring) and the end (fall) of the 2019 beekeeping season (Table 6).
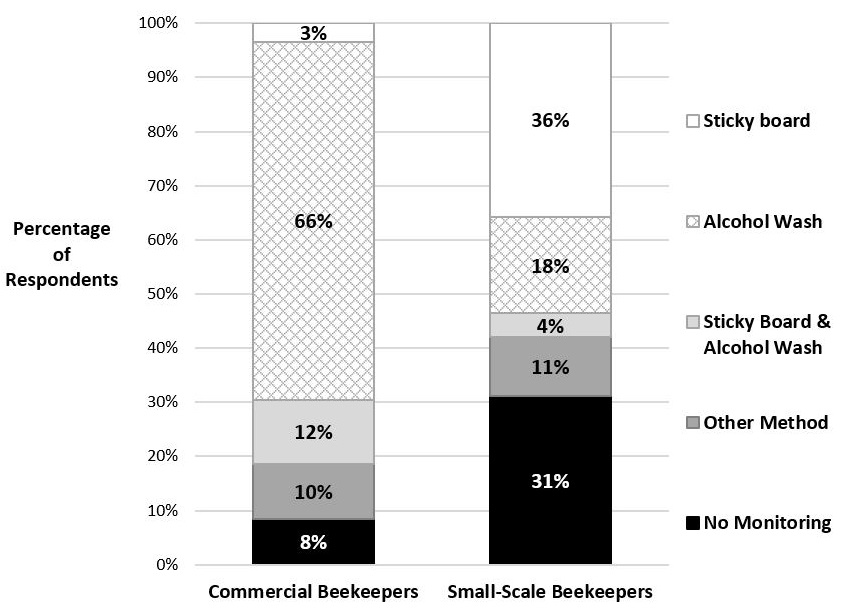
Figure 1. Type of varroa mite monitoring method used by commercial and small-scale beekeepers in 2019.
Accessible description of Figure 1
Proportion of beekeepers monitoring for varroa mites
Of the beekeepers who responded to the varroa mite monitoring question, 92% of commercial beekeepers and 69% of small-scale beekeepers stated they monitor for varroa mite infestation in their colonies. Of those, a number of monitoring methods were used, the most common being either an alcohol wash or a sticky board.
Some beekeepers used more than 1 method to monitor for varroa mites. When the response “other” was selected, the beekeeper commonly reported that they visually checked their colonies for varroa mites or used the “sugar shake” method. However, neither of these methods are recommended as visually checking for mites is not proven to yield usable information and the sugar shake method can be unreliable and it is not tied to established thresholds for Ontario.
From the data, it appears that most (92%) of the commercial beekeepers represented by this survey are monitoring for varroa mites. This is good news as monitoring, along with application of a treatment, is crucial for the management of varroa mites. Without the management of varroa mites, colonies are at a high risk of death and/or spreading varroa mites to other nearby colonies.
Conversely, it was concerning that over 30% of the small-scale beekeepers who responded reported no monitoring at all. This is a really high proportion of beekeepers in this category who are not monitoring for varroa mites. The proportion of monitoring for varroa mites should ideally be 100% for all beekeepers.
These results demonstrate the need for further education/training of beekeepers and further messaging on best management practices and integrated pest management.
Frequency of monitoring for varroa mites
It is encouraging to see from the survey data (Figure 2) that both commercial and small-scale beekeepers are sampling at least twice per season (roughly 30%) and it is even more encouraging to see that approximately 10% or more commercial and small-scale beekeepers are sampling more frequently (3 times; every month; every time in the bee yard). At the same time there is room for improvement for both categories of beekeepers, again through training/education and messaging on best management practices and integrated pest management.
It should be noted that this is the first year Ontario included a question on the frequency of monitoring; this question was not included in the national CAPA survey.
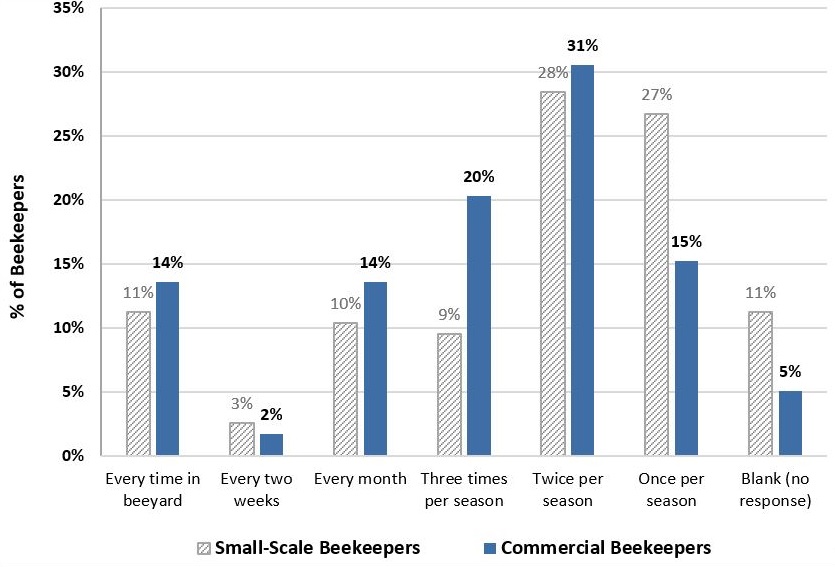
Figure 2. Frequency of varroa mite monitoring by commercial and small-scale beekeepers in 2019.
Accessible description of Figure 2
Treatments used to control varroa mites
Ontario beekeepers use a variety of treatment options to manage varroa mites (Table 6). In spring of 2019, the most common method of varroa mite treatment reported by commercial beekeepers was Apivar® while in fall of 2019 both Apivar® and oxalic acid were most commonly used by commercial beekeepers. Small-scale beekeepers indicated a preference for Apivar® and oxalic acid as well as Mite Away Quick Strips™ over other forms of mite control. The 2 least commonly used treatments by both commercial and small-scale beekeepers were CheckMite+™ and Thymovar.
These results are encouraging as it demonstrates that Ontario beekeepers are rotating their miticides which is an important strategy for delaying the onset of resistant populations of varroa mites. However, there may be some cause for concern from the data as the industry appears to be quite reliant on Apivar® as a control method for varroa mites. Development of resistance to amitraz (the active ingredient in Apivar®) may seriously restrict Ontario beekeepers’ ability to control varroa mites resulting in increased mortality of colonies in Ontario. While other chemical options are available, many of them are temperature dependent and this may factor into the timing and choice of treatment depending on the weather conditions (formic acid) during a particular season in Ontario.
As amitraz resistance has been documented in varroa mite populations in the USA, it will be increasingly important to monitor the status of amitraz in Canada. New compounds will be needed for varroa mite control in order to ensure there is a robust set of options available to beekeepers and the opportunity to rotate treatments so that beekeepers can continue to incorporate effective integrated pest management practices in their beekeeping operation.
It should be noted that varroa mites in Ontario have established resistance (or reduced efficacy) to other compounds (for example, coumaphos, fluvalinate, flumethrin).
Table 6. Treatments reported by commercial and small-scale beekeepers used to control varroa mites in the spring and fall of 2019. Survey respondents could select more than 1 answer.
| Varroa mite treatment (active ingredient) | Spring 2019 % of commercial beekeepers | Spring 2019 % of small-scale beekeepers | Fall 2019 % of commercial beekeepers | Fall 2019 % of small-scale beekeepers |
|---|---|---|---|---|
| Apistan® (fluvalinate) | 7% | 4% | 5% | 7% |
| CheckMite+™ (coumaphos) | 0% | 0% | 0% | 1% |
| Apivar® (amitraz) | 29% | 21% | 57% | 20% |
| Thymovar (thymol) | 5% | 3% | 3% | 1% |
| Bayvarol® (flumethrin) | 9% | 6% | 7% | 4% |
| 65% formic acid – 40 ml multiple application | 21% | 10% | 14% | 5% |
| 65% formic acid – 250 ml single application | 5% | 4% | 9% | 5% |
| Mite Away Quick Strips™ (formic acid) | 12% | 25% | 12% | 26% |
| Oxalic Acid | 14% | 21% | 52% | 29% |
| Other | 14% | 4% | 9% | 4% |
| None | 12% | 15% | 0% | 18% |
Nosema spp. (N. apis and N. ceranae)
Approximately 90% of survey respondents indicated that nosema treatment was not applied in the spring of 2019 and similarly, approximately 90% of respondents did not treat for the disease in the fall of 2019 (Table 7).
Table 7. Treatments reported by commercial and small-scale beekeepers used to control nosema in the spring and fall of 2019
| Nosema treatment | Spring 2019 % of commercial beekeepers | Spring 2019 % of small-scale beekeepers | Fall 2019 % of commercial beekeepers | Fall 2019 % of small-scale beekeepers |
|---|---|---|---|---|
| Fumagillin | 7% | 8% | 7% | 8% |
| Other | 3% | 3% | 4% | 1% |
| None | 90% | 89% | 89% | 91% |
American foulbrood (Paenibacillus larvae)
The majority of commercial beekeepers who responded to this survey question treated for American foulbrood (AFB) during spring 2019 (71%) and during fall 2019 (61%) with oxytetracycline being the most commonly reported treatment. By comparison, 35% of small-scale beekeepers reported treating for AFB in the spring (one beekeeper reported 2 treatment types) and 31% of small-scale beekeepers used AFB treatments in the fall (Table 8).
Table 8. Treatments reported by commercial and small-scale beekeepers used to control American foulbrood in the spring and fall of 2019
| American foulbrood treatment | Spring 2019 % of commercial beekeepers | Spring 2019 % of small-scale beekeepers | Fall 2019 % of commercial beekeepers | Fall 2019 % of small-scale beekeepers |
|---|---|---|---|---|
| Oxytetracycline | 71% | 34% | 57% | 30% |
| Tylosin | 0% | 0% | 4% | 0% |
| Lincomycin | 0% | 0% | 0% | 0% |
| Other | 0% | 2% | 0% | 1% |
| None | 29% | 65% | 39% | 69% |
Ontario’s overwinter mortality
The Canadian Association of Professional Apiculturists compiles overwinter mortality data provided by each province and publishes an annual report on national honey bee colony losses. Figure 3 compares Ontario’s overwinter mortality levels to that of Canada’s. It is worth noting that the 2020 estimate for commercial beekeepers in Ontario was approximately 10% less than the estimation for bee loss averaged between all of Canada (30.2%).
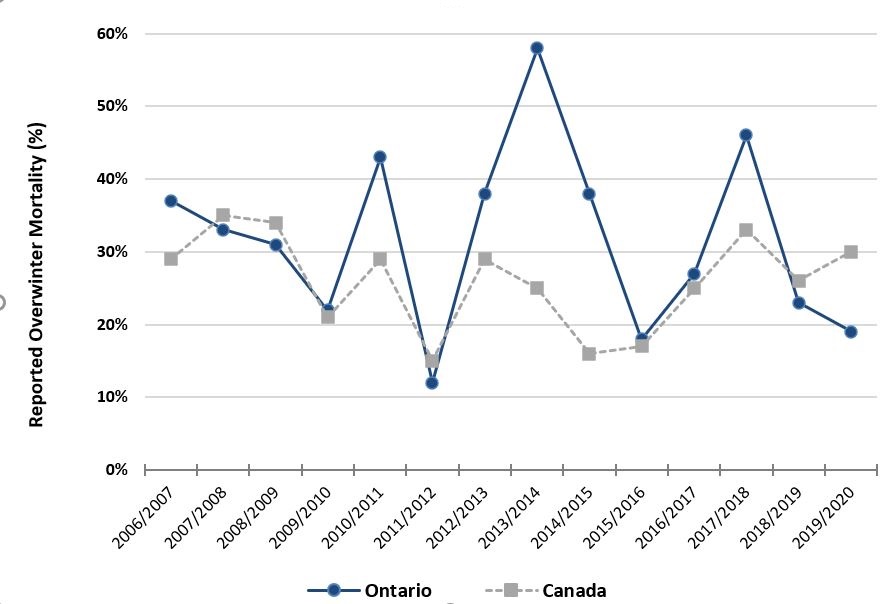
Figure 3. Overwinter mortality (%) reported by commercial beekeepers in Ontario (blue) and Canada (grey) from 2006-2007 to 2019-2020
Accessible description of Figure 3
Accessible image descriptions
Figure 1. Type of varroa mite monitoring method used by commercial and small-scale beekeepers in 2019
Figure 1 shows the type of varroa mite monitoring method used by commercial and small-scale beekeepers in 2019. 3% of commercial beekeepers reported using the sticky board method, 66% used the alcohol wash method, 12% used both sticky board and alcohol wash, 10% used other methods, and 8% reported no monitoring for varroa mites. 36% of small-scale beekeepers reported using the sticky board method, 18% used the alcohol wash method, 4% used both sticky board and alcohol wash, 11% used other methods, and 31% reported no monitoring for varroa mites.
Figure 2. Frequency of varroa mite monitoring by commercial and small-scale beekeepers in 2019
Figure 2 shows the frequency of varroa mite monitoring by commerical and small-scale beekeepers in 2019. Small-scale beekeepers – 11% every time in beeyard, 3% every 2 weeks, 10% every month, 9% 3 times per season, 28% twice per season, 27% once per season, 11% blank (no response). Commercial beekeepers – 14% every time in beeyard, 2% every 2 weeks, 14% every month, 20% 3 times per season, 31% twice per season, 15% once per season, 5% blank (no response).
Figure 3. Overwinter mortality (%) reported by commercial beekeepers in Ontario (blue) and Canada (grey) from 2006-2007 to 2019-2020
Figure 3 shows the percentage of overwinter mortality reported by beekeepers in both Ontario and Canada from 2007 to 2020. The reported overwinter mortality in Ontario and Canada (respectively) was the following: 2007 – 37% and 29%; 2008 – 33% and 35%; 2009 – 31% and 34%; 2010 – 22% and 21%; 2011 – 43% and 29%; 2012 – 12% and 15%; 2013 – 38% and 29%; 2014 – 58% and 25%; 2015 – 38% and 16%; 2016 – 18% and 17%; 2017 – 27% and 25%; 2018 – 46% and 33%; 2019 – 23% and 26%; 2020 – 19% and 30%.