Annual apiculture winter loss reports
Learn about Ontario honey bee colony winter mortality and the management practices used by registered beekeepers to monitor and control pests and diseases.
Introduction
It is difficult to attribute overwinter loss to any single cause. The health of managed honey bees is complex and influenced by several factors including:
- pests
- disease
- genetics
- environmental stressors
- extreme weather
- beekeeper management practices
The annual Ontario Apiculture Winter Loss Survey is one tool for gathering valuable information on honey bee colony mortality and the management practices used by Ontario registered beekeepers to monitor and control pests and diseases.
Managed honey bee colonies experience variable overwinter mortality across Canada. Since 2010, overwinter honey bee mortality in Ontario has been estimated to be as low as 12% as seen in the winter of 2011-2012 and as high as 58% during the winter of 2013-2014.
This page contains annual apiculture winter loss reports published by the Ontario Apiary Program.
Refer to the table of contents to read detailed annual apiculture winter loss reports.
Annual survey
Every spring, the Ministry of Agriculture, Food and Rural Affairs’ (OMAFRA) Apiary Program surveys Ontario beekeepers to estimate honey bee colony mortality during the previous winter. Each year, the Apiary Program publishes a report with the survey results and shares a summary of the results with the Canadian Association of Professional Apiculturists (CAPA) for their national report.
The CAPA National Winter Loss Survey Committee establishes the core questions which are asked of the provinces each year to estimate honey bee colony mortality during the winter. Individual provinces can add additional questions if needed to address specific regional issues. CAPA coordinates how the overall winter loss is reported at the national level to ensure consistency across the provinces and survey years.
For the purpose of this survey, a honey bee colony is defined as a full-sized colony either in a single or double brood chamber and does not include nucleus colonies (splits). A commercially viable colony is defined as a colony which survived the winter and has a minimum of four frames with 75% of the comb area covered with bees on both sides in a standard 10-frame hive. Dead colonies are included in the count of non-viable colonies.
Geographical regions
The Ontario beekeeping industry is divided into five distinct regions based on geography, climate and weather patterns (Figure 1). The survey is sent to beekeepers across the province and responses are received from all five beekeeping regions.
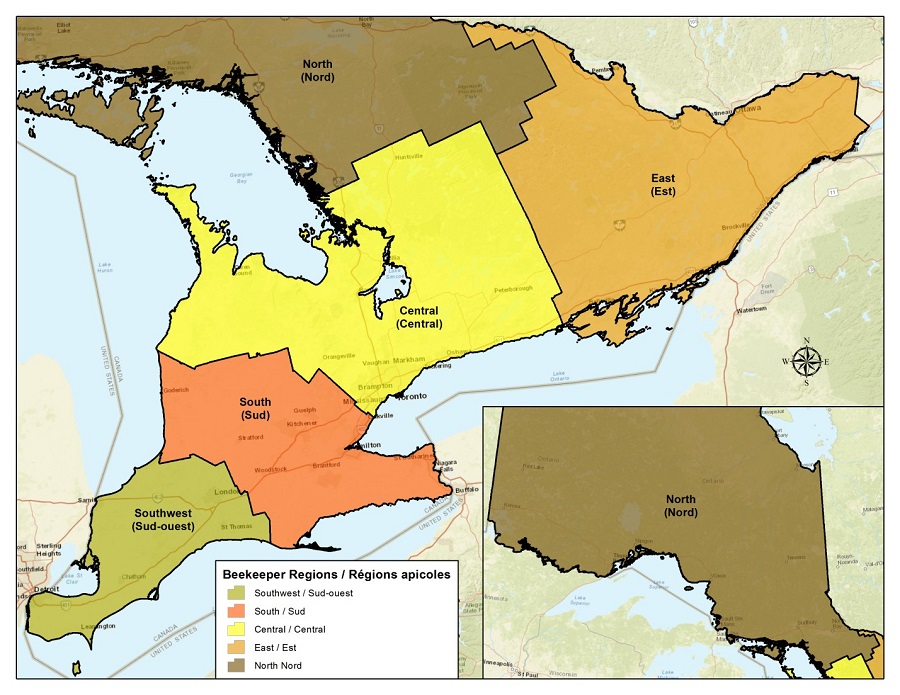
Figure 1. Ontario beekeeping regions: north (brown), east (light orange), central (yellow), south (dark orange) and southwest (green).
Accessible description of figure 1
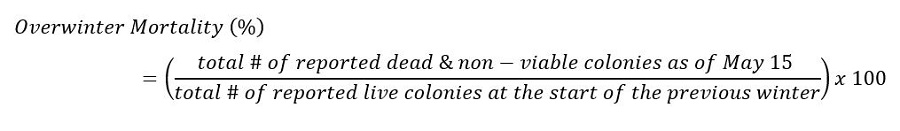
How winter loss is calculated
Using the number of colonies reported by beekeepers, the provincial overwinter mortality is calculated using the following formula:
Accessible description of figure 2
Management practices for pests and disease
The winter loss survey also asks beekeepers about their surveillance, management and monitoring of four major pest and disease threats to honey bee colony health:
- varroa mites
- nosema
- American foulbrood
- European foulbrood
Varroa mites (Varroa destructor)
Varroa mites are relatively large external parasites that feed on the fat bodies and body fluids of adult and developing honey bees. Varroa mites cause physical damage to their host, weaken bees and transmit a variety of pathogens, particularly viruses. In almost all cases, when varroa mite infestations are not effectively managed, the death of the honey bee colony will follow. Varroa mites are identified by researchers as the primary cause of mortality of honey bee colonies (Guzman et al., 2010). In this survey, beekeepers are asked how they monitored for varroa mite infestations and which treatments are used at the beginning (spring) and the end (fall) of the beekeeping season.
Frequency of monitoring for varroa mites
Regular monitoring for varroa mites is also important for varroa management. This is because varroa mite levels increase throughout the season and beekeepers need to continually assess the population growth of varroa mites in their colonies.
The levels of varroa mites can determine when or what type of treatment is needed. Monitoring after treatment may also provide the beekeeper with information on how effective the treatment was, and if further treatments are required.
A further risk that beekeepers must address through monitoring after treatment is the potential re-infestation of varroa mites from colonies in nearby and neighbouring apiaries.
Typically two periods of monitoring were recommended (spring and fall), but it is now advisable for beekeepers to sample many more times and as regularly as they can work into their management schedule.
Nosema spp. (N. apis and N. ceranae)
Nosema is a fungal pathogen that invades the digestive system of honey bees. Nosema may be an added stress to honey bee colonies depending on the time of year. For example, a relationship between nosema infections and colony loss during the winter months has not been identified in Ontario conditions, but nosema were demonstrated to impact the development of colonies in early spring (Guzman et al., 2010; Emsen et al., 2016).
American foulbrood (Paenibacillus larvae)
American foulbrood (AFB) is caused by a spore forming bacteria, Paenibacillus larvae. The clinical symptoms of diseased honey bee larvae can be visually identified in the field while the spores are only visible under a high-power microscope. Honey bee larvae can become infected by ingesting AFB spores present in their food. These spores germinate in the gut of the bee larva and may eventually kill the infected larvae.
European foulbrood (Melissococcus plutonius)
European foulbrood (EFB) is typically not as detrimental as American foulbrood, but it has the potential to decimate a honey bee colony under certain conditions. EFB targets and kills young larvae before they reach adulthood. Unlike AFB, EFB does not create spores, making this disease more manageable for both bees and beekeepers.
Resources
Visit Ontario.ca/beekeeping for more information about Ontario’s apiculture industry or to access resources and services available from the Ministry of Agriculture, Food and Rural Affairs’ Apiary Program, including information on:
- treatment recommendations and best management practices for biosecurity
- high risk pests and diseases
- overwintering
For information on overwinter bee losses across Canada, visit the Canadian Association of Professional Apiculturists Colony Loss Reports.
References
Emsen, B., Guzman-Novoa, E., Hamiduzzaman, M., Eccles L., Lacey, B., Ruiz-Pérez, R., Nasr, M. 2016. Higher prevalence and levels of Nosema ceranae than Nosema apis infections in Canadian honey bee colonies. Parasitology Research, 115:175–181.
Guzman-Novoa, E., Eccles L., Calvete, Y., McGowan, J., Kelly, P. and Correa-Benitez, A. 2010. Varroa destructor is the main culprit for death and reduced populations of overwintered honey bees in Ontario, Canada. Apidologie, 4 (4) 443-451.
Accessible image descriptions
Figure 1. Ontario beekeeping regions
Figure 1 shows the division of beekeeping regions in Ontario. The north region includes Manitoulin, Parry Sound, Nipissing, Sudbury, Algoma, Timiskaming, Cochrane, Thunder Bay, Rainy River, and Kenora counties. The east region includes Hastings, Renfrew, Lennox & Addington, Prince Edward, Frontenac, Leeds & Grenville, Lanark, Ottawa, Stormont, Dundas & Glengarry, and Prescott & Russell counties. The central region includes Muskoka, Bruce, Grey, Simcoe, Peel, York, Toronto, Durham, Dufferin, Kawartha Lakes, Haliburton, Peterborough, and Northumberland counties. The south region includes Wellington, Huron, Perth, Oxford, Norfolk, Brant, Waterloo, Hamilton, Halton, Haldimand, and Niagara counties. The southwest region includes Middlesex, Elgin, Lambton, Chatham-Kent, and Essex counties.
Figure 2. Overwinter mortality estimate
The overwinter mortality estimate, measured in %, is calculated using a formula and data generated from the survey. This formula is 100 multiplied by the total number of honey bee colonies reported dead and non-viable as of May 15 divided by the total number of honey bee colonies reported live at the start of the previous winter.