Ontario population projections
Learn about the 2025-2051 population projections for Ontario and its 49 census divisions.
978-1-4868-9920-3 English HTML - Ontario Population Projections, 2025-2051
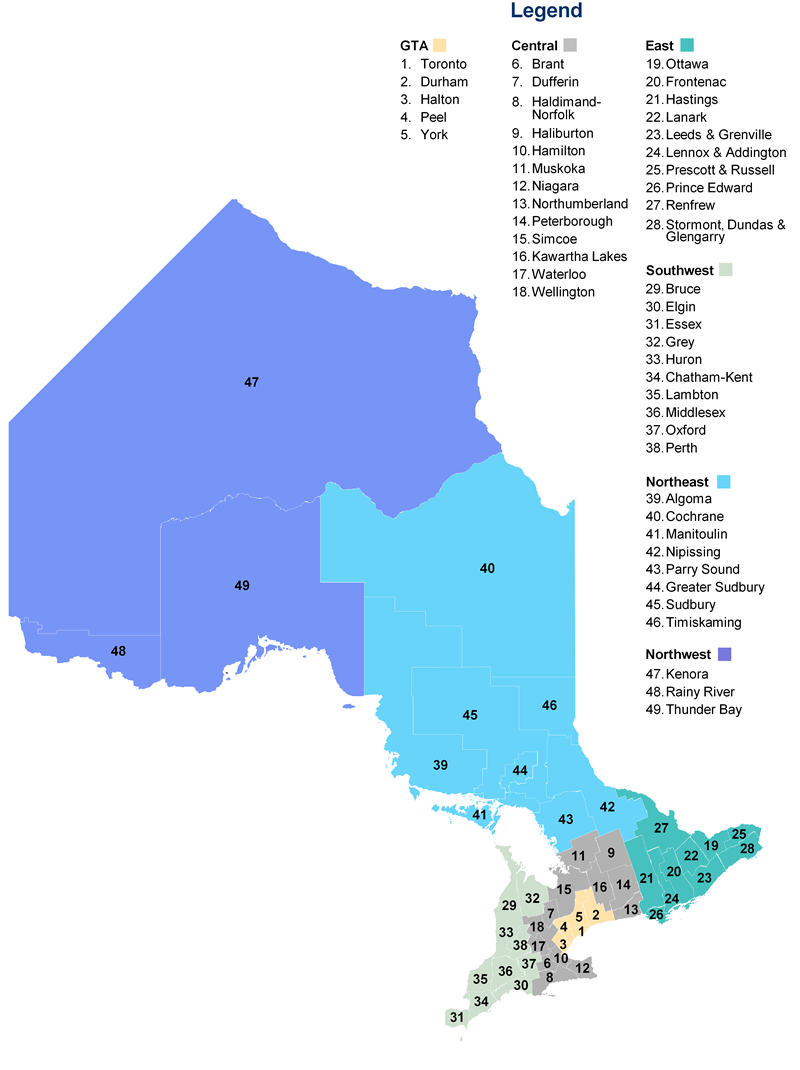
Map of Ontario census divisions
Introduction
This report presents population projections for Ontario and each of its 49 census divisions, by age and gender, from the base year of 2025 to 2051. These projections were published by the Ontario Ministry of Finance in the summer of 2026.
The Ministry of Finance produces an updated set of population projections every year to reflect the most up-to-date trends and historical data. This update uses the 2025 population estimates from Statistics Canada (released in January 2026 and based on the 2021 Census) as a base and includes changes in the projections to reflect the most recent trends in fertility, mortality, and migration.
The new projections include three scenarios for Ontario. The medium, or reference scenario, is considered most likely to occur if recent trends continue. The low- and high-growth scenarios provide a reasonable forecast range based on plausible changes in the components of growth. Projections for each of the 49 census divisions are for the reference scenario only.
The projections do not represent Ontario government policy targets or desired population outcomes, nor do they incorporate explicit economic or land planning assumptions. They are developed using a standard demographic methodology in which assumptions for population growth reflect recent trends in all streams of migration and the continuing evolution of long-term fertility and mortality patterns in each census division. Census division projections are summed to obtain the Ontario total.
The report includes a set of detailed statistical tables on the new projections. Key demographic terms are defined in a glossary.
Highlights
Highlights of the new 2025–2051
- Ontario’s population is projected to increase by 24.4 per cent, or almost 4.0 million, over the next 26 years, from an estimated 16.3 million on July 1, 2025, to over 20.2 million by July 1, 2051.
- The provincial population is projected to decline by 1.0 per cent in 2025–26, followed by growth of 0.2 per cent in 2026–27, and a gradual return to more typical growth of 1.0 per cent by 2029–30. Thereafter, the rate of increase will remain fairly stable, continuing to average about 1.0 per cent annually through to 2050–51.
- Starting in 2031–32, net migration is projected to account for all population growth in the province, as natural increase is expected to turn negative with the number of deaths exceeding the number of births each year.
- The number of seniors aged 65 and over is projected to increase significantly, from 3.1 million or 18.9 per cent of population in 2025, to 4.6 million, or 22.7 per cent by 2051. Rapid growth in the share and number of seniors will continue over the 2025–2031 period as the last cohorts of baby boomers will turn 65. After 2031, the growth in the number of seniors will slow significantly. Over the projection period, the share of seniors is projected to peak at 22.9 per cent in 2040.
- The number of children aged 0–14 is projected to increase slowly over the projection period, from 2.4 million in 2025 to 2.6 million by 2051. The children’s share of population is projected to decrease from 14.6 per cent in 2025 to 13.0 per cent by 2051.
- The number of Ontarians aged 15–64 is projected to increase from 10.8 million in 2025 to 13.0 million by 2051. This age group is projected to decline as a share of total population until the late-2030s, from 66.5 per cent in 2025 to a low of 64.0 per cent by 2037. Thereafter, this share is projected to remain fairly stable, reaching 64.3 per cent by 2051.
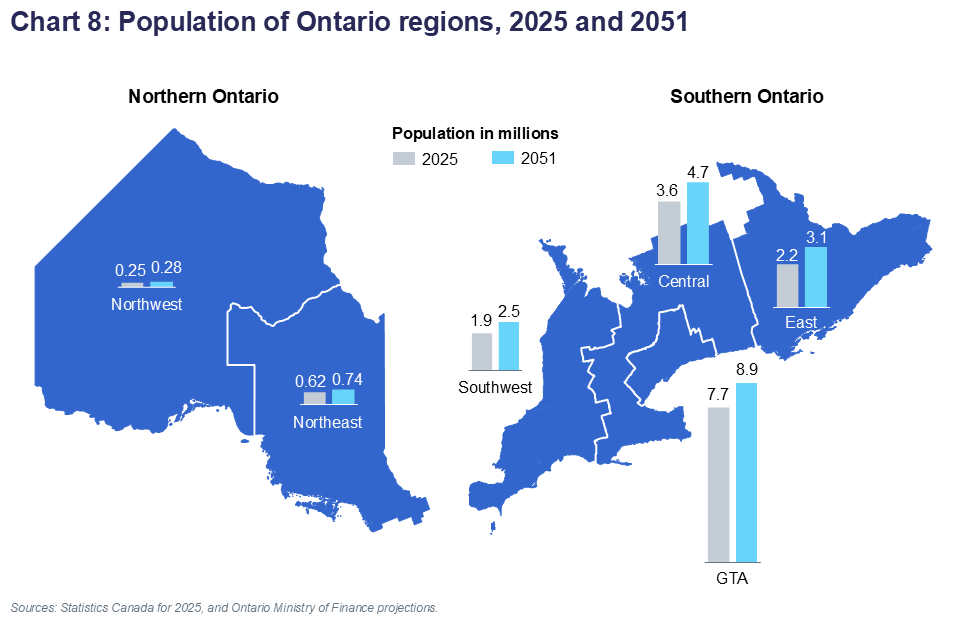
- All six regions of the province are projected to see growing populations over the projection period. Eastern Ontario is projected to be the fastest growing region, with its population increasing by 43.0 per cent, from 2.2 million in 2025 to 3.1 million by 2051. The Greater Toronto Area (GTA) will see the largest increase in population, adding 1.3 million residents by 2051, with growth of 16.4 per cent, from 7.7 million in 2025 to 8.9 million by 2051. The GTA’s share of provincial population is projected to decline from 47.2 per cent in 2025 to 44.2 per cent by 2051.
- All six regions will see a shift to an older age structure. The GTA is expected to remain the region with the youngest age structure as a result of strong international migration and positive natural increase.
Projection Results
Reference, low and high-growth scenarios
The Ministry of Finance projections provide three growth scenarios for the population of Ontario to 2051. The medium-growth or reference scenario is considered most likely to occur if recent trends continue. The low- and high-growth scenarios provide a forecast range based on plausible changes in the components of growth. Population is projected for each of the 49 census divisions for the reference (medium-growth) scenario only. All charts and tables in this report are for the reference scenario, unless otherwise stated.
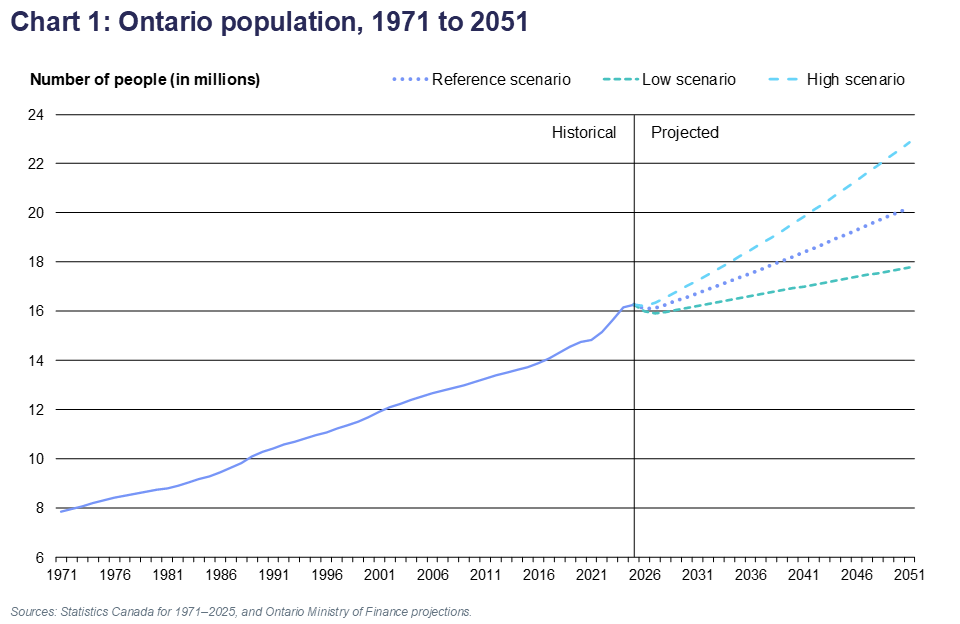
Under all three scenarios, Ontario’s population is projected to experience growth over the 2025–2051 period. In the reference scenario, population is projected to grow 24.4 per cent, or almost 4.0 million, during the next 26 years, from an estimated 16.3 million on July 1, 2025, to over 20.2 million by July 1, 2051.
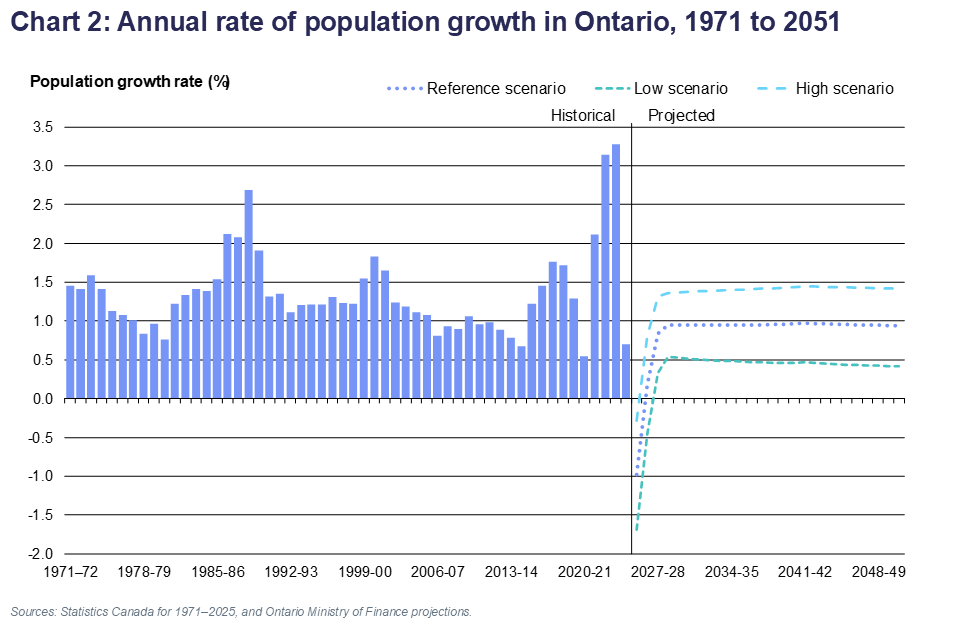
The provincial population is projected to decline by 1.0 per cent in 2025–26, followed by growth of 0.2 per cent in 2026–27, and a gradual return to more typical growth of 1.0 per cent by 2029–30. Thereafter, the rate of increase will remain fairly stable, continuing to average about 1.0 per cent annually through to 2050–51.
In the low-growth scenario, population increases 9.3 per cent, or 1.5 million, to reach almost 17.8 million people by 2051. In the high-growth scenario, population grows 40.6 per cent, or 6.6 million, to almost 22.9 million people by the end of the projection period.
In the low-growth scenario, the provincial population is projected to decline over the first two years of the projections. Thereafter, the population will return to growth, with the pace of increase peaking at 0.5 per cent in 2028–29, followed by a gradual easing over time to 0.4 per cent by 2050–51. In the high-growth scenario, a small decrease is projected in the first year (-0.3%), followed by a gradual increase in the pace of growth peaking at 1.4 per cent in 2041–42 and remaining fairly stable thereafter.
The components of Ontario population change
The contributions of natural increase and net migration to population growth vary from year to year. While natural increase trends evolve slowly, net migration can be more volatile, mostly due to swings in interprovincial migration and variations in international migration. For example, over the past 10 years, the share of population growth attributable to net migration has ranged from 74 per cent in 2015–16 to 97 per cent in 2022–23.
Net migration levels to Ontario have averaged about 228,000 per year in the past decade, with a low of 60,000 in 2020–21 and a high of 493,000 in 2023–24. The number of births has been fairly stable while deaths have been rising more rapidly, resulting in natural increase declining from 43,000 to 20,000 over the last decade.
In the short-term, as the number of non-permanent residents declines due to federal government policies (more on this topic below), net migration will be negative at -179,000 in 2025–26, and low at 16,000 in 2026–27. Subsequently, net migration is projected to rebound to 149,000 in 2028–29, and increase gradually over the rest of the projection period, fuelled by sustained immigration, reaching 214,000 by 2050–51.
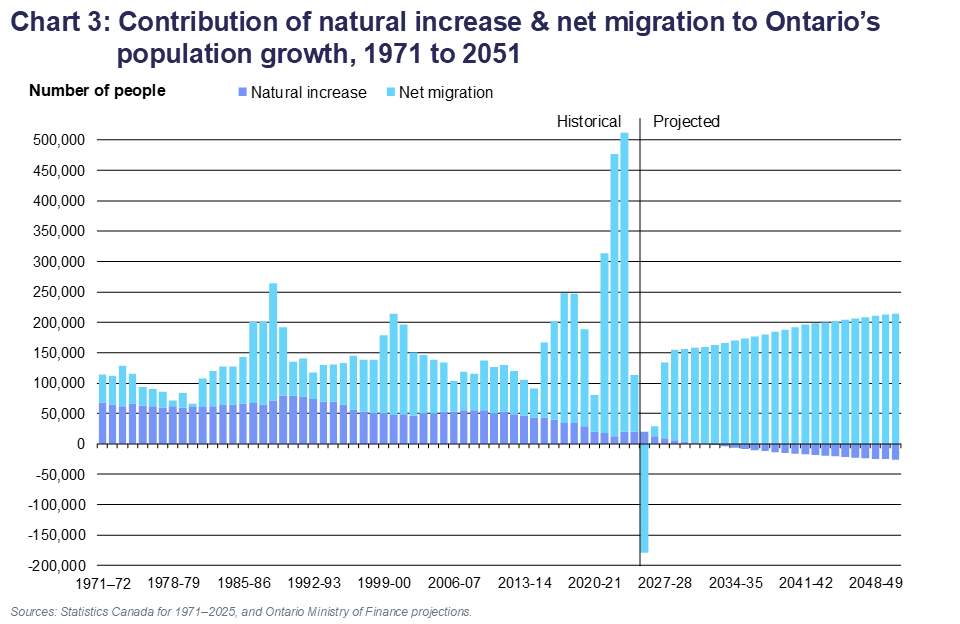
Natural increase is projected to decrease rapidly, going from a positive contribution to population growth of 20,000 in 2025–26 to a negative contribution starting in 2031–32. From 2031–32, all population growth in Ontario is projected to come from net migration. From 2031 to 2051, natural increase will contribute negatively to provincial population growth by 310,000, compared to a positive contribution of 3.8 million from net migration.
The number of deaths is projected to increase over time, as the large cohorts of baby boomers continue to age. By 2031, all baby boomers will be 65 or older. The annual number of deaths is projected to rise from 124,000 in 2025–26 to 192,000 by 2050–51.
Births are also projected to increase over the projection period, but at a slower pace than deaths. The rise in births will be fuelled by continued population growth driven by young international migrants. The annual number of births is projected to rise from 144,000 in 2025–26 to 166,000 by 2050–51.
Age structure
By 2051, Ontario is projected to have more people at every age compared to 2025, with particularly large increases among older seniors and middle-aged adults. Baby boomers, whose largest cohorts were around age 61 in 2025, will have moved into the 80+ age groups. The number of adults aged 35 to 55 will also see a relatively large increase, driven by continued strong international migration to the province.
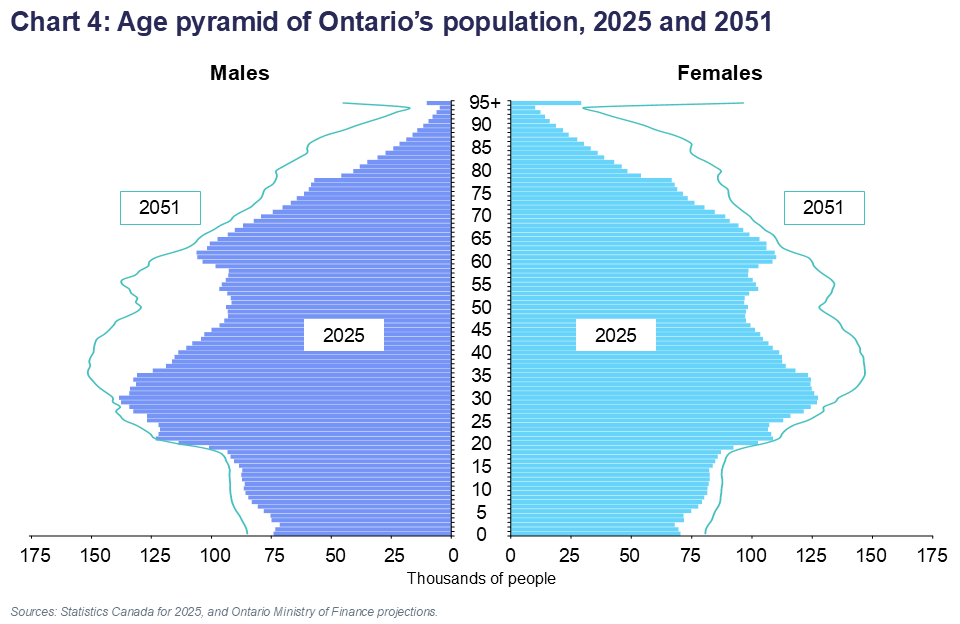
The median age of Ontario’s population is projected to rise from 39.9 years in 2025 to 43.7 years by 2051. Median age for women will climb from 41.3 to 44.9 years over the projection period while for men it is projected to increase from 38.5 to 42.6 years.
The number of seniors aged 65 and over is projected to increase significantly, from 3.1 million or 18.9 per cent of population in 2025, to 4.6 million, or 22.7 per cent by 2051. In 2016, for the first time, seniors accounted for a larger share of population than children aged 0–14.
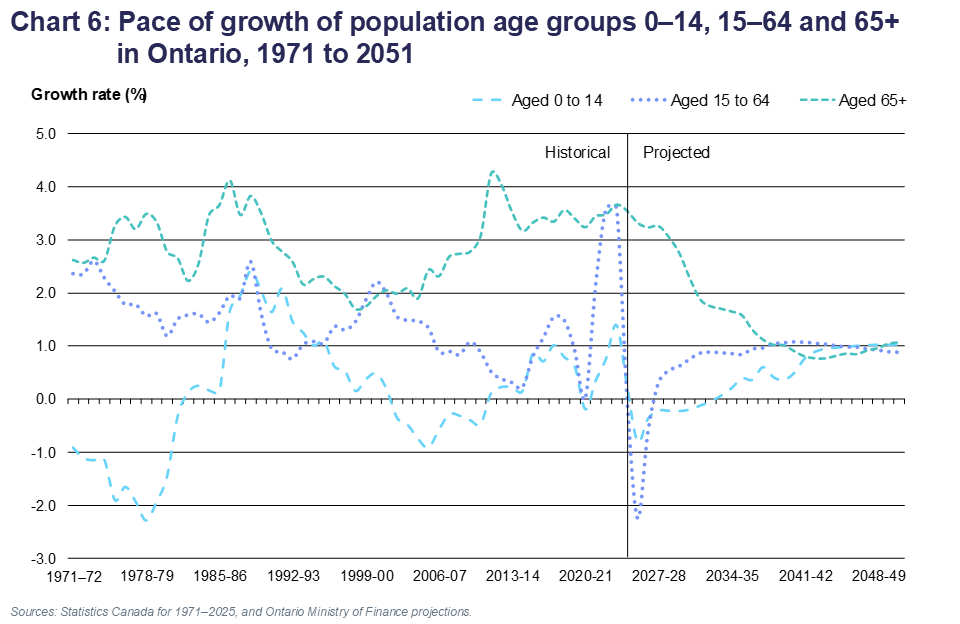
By the early 2030s, once all baby boomers have reached age 65, the growth in the number of seniors is expected to slow significantly. Over the projection period, the share of seniors is projected to peak at 22.9 per cent in 2040. The annual growth rate of the senior age group is projected to slow from an average of 3.0 per cent over 2025–31 to 1.1 per cent by the end of the projection period in 2050–51.
The older age groups will experience the fastest growth among seniors. The number of people aged 75 and over is projected to almost double in size, from 1.4 million in 2025 to over 2.7 million by 2051. The number of people in the 90+ group is expected to more than triple, from 151,000 to 497,000.
A substantial imbalance exists in the proportions of women and men in older age groups as a result of men’s lower life expectancy. The proportion of women among the oldest seniors is projected to remain higher than that of men but will decline slightly as male life expectancy is projected to increase faster than female life expectancy. In 2025, there were 42 per cent more women than men in the 80+ age group. By 2051, it is projected that there will be 34 per cent more women than men in the 80+ age group.
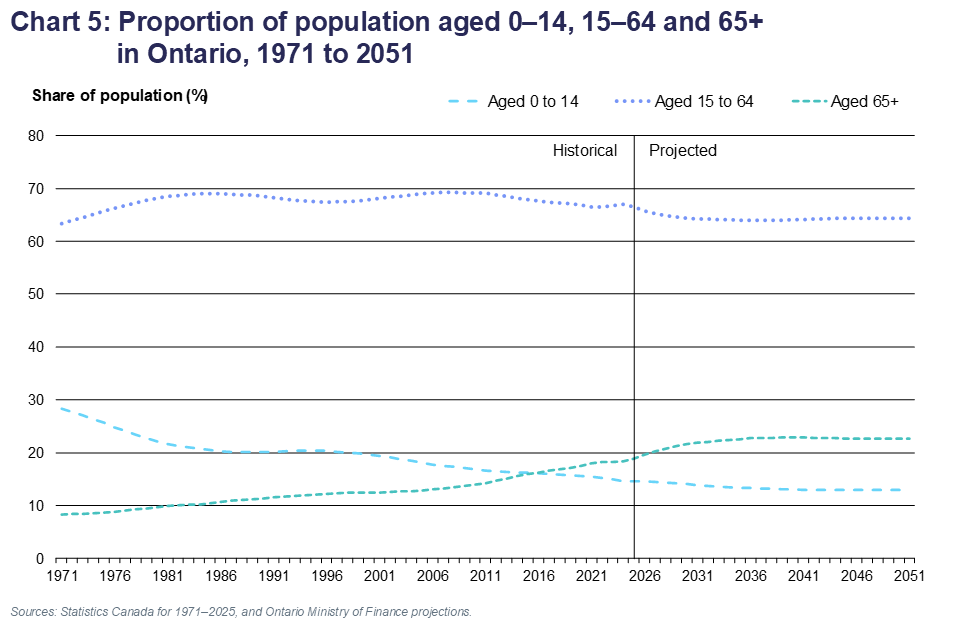
The number of children aged 0–14 is projected to increase slowly over the projection period, from 2.4 million in 2025 to 2.6 million by 2051. The children’s share of population is projected to decrease from 14.6 per cent in 2025 to 13.0 per cent by 2051.
The number of Ontarians aged 15–64 is projected to increase from 10.8 million in 2025 to 13.0 million by 2051. This age group is projected to decline as a share of total population until the late-2030s, from 66.5 per cent in 2025 to a low of 64.0 per cent by 2037. Thereafter, this share is projected to remain fairly stable, reaching 64.3 per cent by 2051.
The growth rate of the population aged 15–64 is projected to decline rapidly at the outset, with substantial decreases during the first two years of the projection period, due to a reduction in the number of non-permanent residents in Ontario. However, the pace of annual growth of the 15–64 age group is projected to pick up and hover around 0.9 per cent from 2031 to 2051.
Within the 15–64 age group, the number of youth (those aged 15–24) is projected to decline by 98,000 during the first two years of the projections reaching 1.9 million by 2027. Over the rest of the projection horizon, the number of youths is projected to increase slowly, reaching 2.1 million by 2051. The youth share of total population is projected to decrease throughout the projection period, from 12.5 per cent in 2025 to 10.5 per cent by 2051.
The number of people aged 25–44 is also projected see declines in the first two years of the projections, falling by 138,000 to less than 4.7 million by 2027. This age group is then projected grow to 5.7 million by 2051. Its share of population is projected to decline from 29.6 in 2025 to 28.3 per cent by 2051.
The number of people aged 45–64 is projected to fall by 72,000 initially to less than 3.9 million by 2027. Growth of this age group is projected to pick up in the early 2030s and reach almost 5.2 million by 2051. Its share of population is projected to decline initially, from 24.4 in 2025 to 23.2 per cent by 2033, before rising again to reach 25.5 per cent by 2051.
Demographic determinants of regional population change
The main demographic determinants of regional population trends are the current age structure of the population, the pace of natural increase, and the migratory movements in and out of each of Ontario’s regions. These determinants vary substantially among the 49 census divisions that comprise the six geographical regions of Ontario and drive significant differences in demographic projections.
The current age structure of each region has a strong influence on projected regional births and deaths. A region with a higher share of its current population in older age groups will likely experience more deaths in the future than a region of comparable size with a younger population. Similarly, a region with a large share of young adults in its population is expected to see more births than a region of similar size with an older age structure. Since migration rates vary by age, the age structure of a region or census division will also have an impact on the migration of its population.
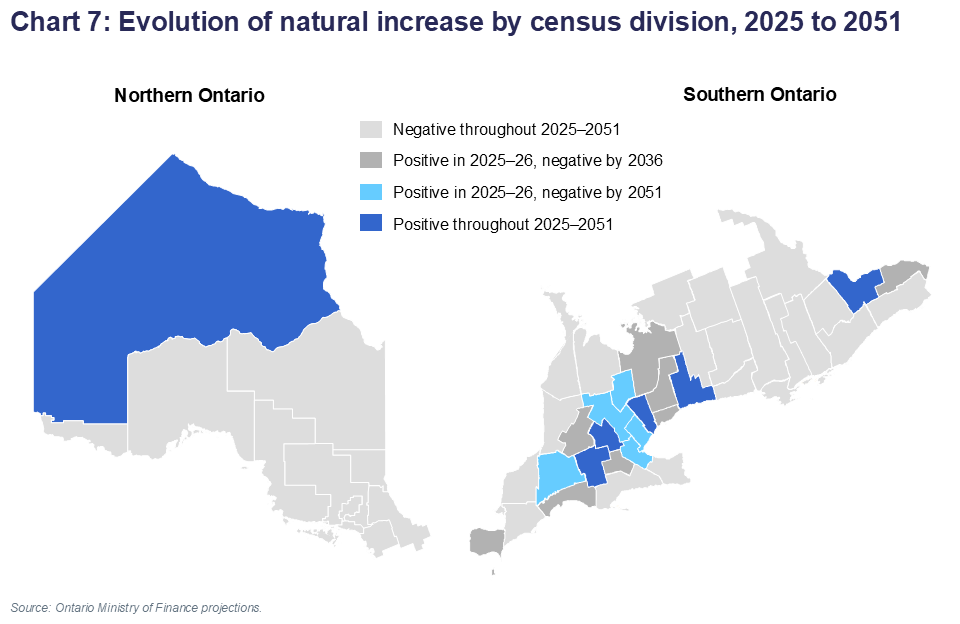
Due to the general aging of the population, most census divisions in Ontario (32 out of 49) experienced negative natural increase in 2024–25, where deaths exceeded births. This trend is projected to continue over the projection period. By 2051, 43 of the 49 census divisions are projected to have negative natural increase.
Many census divisions in Ontario where natural increase was previously the primary or sole contributor to population growth have already begun to experience slower growth slow. This trend is projected to continue as the population ages further.
Migration is the most important factor contributing to population growth for Ontario and for most of its regions. Net migration gains, whether from international sources, other parts of Canada or other regions of Ontario, are projected to continue to be the major source of population growth for almost all census divisions.
Large urban areas, which receive the majority of international migrants to Ontario, are projected to experience the highest levels of population growth. For other regions such as Central Ontario, the continuation of migration gains from other parts of the province will be a key source of population increase. Some rural and northern census divisions tend to receive only a small share of international migration while experiencing net out-migration, mostly among young adults, which negatively impacts projected population growth.
Regional population growth
The GTA is projected to see the largest increase in population among regions, adding almost 1.3 million residents by 2051, a growth of 16.4 per cent, from 7.7 million in 2025 to 8.9 million by 2051. However, the GTA’s share of provincial population is projected to decline from 47.2 per cent in 2025 to 44.2 per cent by 2051, as other regions are projected to grow at a faster pace.
Within the GTA, Toronto’s population is projected to increase from 3.3 million in 2025 to almost 3.6 million by 2051, adding 296,000 people. However, over the next three years, Toronto is expected to see a decline of 200,000 people, driven primarily by the decline in non-permanent residents. Despite this short-term drop, Toronto’s population is projected to grow by 9.0 per cent from 2025 to 2051, which is less than half the provincial growth rate of 24.4 per cent. The four census divisions in the suburban GTA are projected to add a combined total of almost 1.0 million people over the projection period. Durham (32.5%) and Halton (27.2%) are projected to grow faster than the average for Ontario, while York (20.0%) and Peel (16.1%) are projected to grow at slightly slower rates than the province as a whole.
Central Ontario is projected to add 1.09 million residents, representing a growth rate of 30.2 per cent, from 3.62 million in 2025 to 4.71 million in 2051. The region’s share of provincial population is projected to rise slightly from 22.2 per cent to 23.3 per cent during the same period. Many census divisions of Central Ontario are projected to continue experiencing population growth well above the provincial average, led by Brant at 38.6 per cent, Haldimand-Norfolk at 33.7 per cent, and Wellington at 33.6 per cent.
The population of Eastern Ontario is projected to experience the fastest growth among regions of the province, increasing by 43.0 per cent over the projection period, from 2.16 million to 3.08 million. Ottawa, the fastest growing census division in Ontario, is projected to grow by 53.8 per cent, from 1.19 million in 2025 to 1.83 million in 2051. All other Eastern Ontario census divisions are also projected to grow by 2051, with population increases ranging from 15.7 per cent in Prince Edward to 49.8 per cent in Prescott and Russell.
The population of Southwestern Ontario is projected to grow from 1.93 million in 2025 to 2.47 million in 2051, representing an increase of 27.9 per cent. Growth rates within Southwestern Ontario vary, with Oxford and Elgin growing fastest (43.8 and 36.8 per cent respectively), and Chatham-Kent and Lambton expected to grow at the slowest pace (15.9 and 9.6 per cent respectively).
The population of Northern Ontario is projected to grow over the projection horizon, increasing by 16.9 per cent, from 877,000 in 2025 to 1.02 million by 2051. Within the North, the Northeast is projected to grow by 115,000 or 18.4 per cent, from 625,000 to 740,000. The Northwest is projected to see an increase of 33,000 or 13.0 per cent, from 252,000 to 285,000.
Table A: Population Shares of Ontario Regions, 1991 to 2051
| Share of Ontario Population (%) | 1991 | 2001 | 2011 | 2021 | 2031 | 2041 | 2051 |
|---|---|---|---|---|---|---|---|
| GTA | 42.0 | 44.5 | 47.2 | 47.2 | 45.4 | 44.5 | 44.2 |
| Central | 22.2 | 22.1 | 21.6 | 22.1 | 23.0 | 23.3 | 23.3 |
| East | 13.9 | 13.5 | 13.2 | 13.3 | 14.1 | 14.8 | 15.3 |
| Southwest | 13.7 | 13.0 | 12.0 | 11.9 | 12.1 | 12.2 | 12.2 |
| Northeast | 5.8 | 4.8 | 4.3 | 3.9 | 3.8 | 3.7 | 3.7 |
| Northwest | 2.4 | 2.1 | 1.8 | 1.7 | 1.5 | 1.5 | 1.4 |
Sources: Statistics Canada, 1991–2021, and Ontario Ministry of Finance projections.
Regional age structure
All regions are projected to continue experiencing a shift toward an older age composition. The most significant shifts in age structure are expected to take place in census divisions where few new immigrants settle, particularly in northern and rural areas, and where natural increase is projected to remain negative or become negative over time. The GTA is expected to remain the region with the youngest age structure, driven by strong international migration and positive natural increase. In contrast, the Northeast is projected to remain the region with the oldest age structure.
In 2025, the share of seniors aged 65 and over varied across regions, ranging from a low of 16.8 per cent in the GTA to a high of 23.7 per cent in the Northeast. Among census divisions, the range was even wider, from 14.7 per cent in Waterloo to 39.3 per cent in Haliburton.
By 2051, the share of seniors across regions is projected to range from 21.8 per cent in the GTA to 25.4 per cent in the Northeast. Among census divisions, it is projected to range from 17.9 per cent in Waterloo to 40.1 per cent in Haliburton.
Even as the share of seniors in census divisions located in and around the suburban GTA and Ottawa is projected to remain lower than the provincial average, the increase in the number of seniors will be highest in these areas.
The number of seniors is projected to grow by 62 per cent in the suburban GTA. Conversely, the number of seniors grows most slowly (less than 11 per cent) in Timiskaming and Rainy River.
The number of children aged 0–14 is projected to increase in all regions, except the Northwest, over the projection period. However, the share of children in every region is projected to decline slightly throughout the projection period. In 2025, the highest share of children among regions was in the Northwest at 15.7 per cent, while the Northeast had the lowest share at 13.5 per cent. By 2051, the Northeast is projected to continue having the lowest share of children at 12.0 per cent while the Southwest is expected to have the highest share at 14.0 per cent.
Ottawa and Oxford are projected to see growth of over 27 per cent in the number of children aged 0–14 between 2025 and 2051. Conversely, Rainy River, Timiskaming, Thunder Bay, Cochrane, Lambton and Toronto are projected to see a decline in the number of children aged 0–14 over the same period. In 2025, Kenora had the highest share of children at 19.6 per cent, while Haliburton had the lowest at 9.2 per cent. By 2051, Kenora is projected to continue having the highest share of children at 17.3 per cent, while Haliburton is projected to continue having the lowest share at 8.3 per cent.
In 2025, the share of population aged 15–64 ranged from 62.8 per cent in the Northeast to 69.1 per cent in the GTA. This share is projected to decline in every region by 2051, except the Northwest. By 2051, the share of this age group is projected to range from 62.4 per cent of population in the Southwest to 65.5 per cent in the GTA.
While the number of people aged 15–64 is projected to increase in every census division of the province except for Rainy River, the share of the population in this age group is projected to decrease in 41 census divisions. In 2025, the highest share of people aged 15–64 was in Toronto (71.2 per cent) while the lowest was in Haliburton (51.4 per cent). By 2051, Toronto is projected to continue having the highest share of population in this age group (68.3 per cent), followed by Waterloo, Ottawa, and Greater Sudbury. Conversely, Prince Edward (52.0 per cent) and Haliburton (51.5 per cent) are projected to have the lowest shares by 2051.
Methodology and Assumptions
Projections methodology
The methodology used in the Ministry of Finance’s long-term population projections is the cohort-component method, a demographic accounting system. The calculation starts with the base-year population (2025) distributed by age and gender.
For each year, a separate analysis and projection of each component of population growth is made, starting with births. Following this, projections of deaths and the five migration components (immigration, emigration, net change in non-permanent residents, interprovincial in- and out-migration, and intraprovincial in- and out-migration) are also generated and added to the population cohorts to obtain the population of the subsequent year, by age and gender.
This methodology is applied to each of the 49 census divisions. The Ontario-level population is then obtained by summing the projected census division populations.
It should be noted that these population projections are demographic and based on assumptions about births, deaths and migration over the projection period. Assumptions are based on the analysis of the long-term and the most recent trends of these components, as well as expectations of future trajectories. For Ontario, the degree of uncertainty inherent in projections is represented by the range between the low- and high-growth scenarios, with the reference scenario representing the most likely outcome.
Base population
This report includes demographic projections released by the Ministry of Finance that use the latest population estimates based on the 2021 Census adjusted for net under-coverage. Specifically, the projections use Statistics Canada’s preliminary postcensal population estimates for July 1, 2025 as a base.
In addition to providing a new starting point for total population by age and gender, updating the projections to a new base alters the projected age structure and population growth in each census division. It also has an impact on many components of population growth that are projected by using age-specific rates, such as births, deaths, and several of the migration streams.
Fertility
The projected number of births for any given year is obtained by applying age-specific fertility rates to cohorts of women in the reproductive age group, ages 15 to 49. The projection model relies on four parameters
Assumptions are based on a careful analysis of past age-specific fertility trends in Ontario and a review of fertility trends elsewhere in Canada and in other countries. A general and common trend is that a growing proportion of women are giving birth in their 30s and early 40s. The overall decline in the fertility rate among young women is accompanied by a rise in fertility rates among older women. Over the past 20 years and most recently, teenagers and women in their early 20s have experienced the sharpest declines in fertility rates. Fertility rates of women in their 30s and older, which were rising moderately over the 1990s and more rapidly over most of the 2000s, have shown a slower pace of increase in more recent years. These are the same cohorts of women who postponed births during their 20s and are now having children in their 30s and early 40s.
Ontario’s total fertility rate (TFR), which stood at 3.8 children per woman around 1960, fell below the replacement level of 2.1 children per woman in 1972. Throughout the remainder of the 1970s, the TFR declined rapidly, reaching the 1.50 to 1.70 range where it was hovering until recently. It fell below 1.40 for the first time in 2020. The latest data available for Ontario (2024) shows a TFR of 1.21.
The recent sharp decline in the TFR was driven by women in their 20s, whose fertility rates have dropped to historically low levels and are now lower than those in most similar jurisdictions. These declines in fertility for younger women are projected to continue at a slowing pace in the short term, leading to a continued fall in the TFR. However, a projected slow increase in fertility for women aged 35+ is set to drive a subsequent gradual increase in overall fertility in the province to 2051, back to TFR values observed most recently.
In the reference scenario, the TFR is assumed to decline initially from 1.20 in 2025–26 to 1.18 by 2028–29, and to subsequently rise slowly as younger women’s fertility rates stabilize while those of older women continue to gradually increase, returning to 1.21 children per woman by 2051.
In the low-growth scenario, fertility is assumed to decline continuously until 2051, reaching 0.91 children per women. In the high-growth scenario, it increases over time to reach 1.51 by the end of the projection period.
Fertility assumptions at the census division level
The most recent complete data for census divisions (2024) shows that TFRs range from a high of 2.03 in Huron to a low of 0.92 in Toronto. The projected parameters for fertility at the census division level are modelled to maintain regional differences. The census division-to-province ratio for mean age at childbearing in the most recent period is assumed to remain constant. The variance and skewness of age-specific fertility distributions for census divisions evolve over the projection period following the same absolute changes of these parameters at the Ontario level.
Mortality
The population of Ontario has one of the highest life expectancies in Canada and the developed world. The latest data shows that life expectancy at birth in Ontario was 85.0 years for females and 80.7 years for males in 2024. Deaths related to opioid overdoses and the COVID-19 pandemic have recently had negative impacts on the pace of life expectancy improvements. However, the generally accepted view is that life expectancy will continue to rise over the long term in Canada and around the world.
Up to the mid-1990s, annual gains in life expectancy were becoming smaller and it was expected that future improvements would continue at this slowing speed. The pace of annual gains in life expectancy then picked up over the next two decades, and the progression of life expectancy became more linear. Until the mid-2010s, average gains in life expectancy were in the order of 0.16 years per year for females and 0.23 years for males. However, in recent years and even before the pandemic, average life expectancy gains slowed in Ontario, partly due to an increase in opioid-related deaths, but mostly as a result of a slowdown in the improvement of survival rates from heart diseases, which was the main driver of increases in life expectancy over the past decades. It is assumed that other factors, such as continued progress in fighting cancer, will drive increases in the average lifespan at a gradual pace over the projection period.
The projected number of deaths each year is obtained by applying projected age-specific mortality rates to population cohorts of corresponding ages. Projections of age-specific death rates are derived
All three projection scenarios for Ontario reflect a continuation of the gains recorded in average life expectancy. Male life expectancy is expected to progress at a faster pace than that of females under the long-term mortality assumptions for each of the three scenarios. This is consistent with recent trends where males have recorded larger gains in life expectancy than females. This has resulted in a shrinking of the gap in life expectancy between males and females, a trend that is projected to continue. Furthermore, reflecting current trends, future gains in life expectancy are modelled to be concentrated at older ages and to be smaller for infants.
In the reference scenario, life expectancy in Ontario is projected to continue increasing, but slower than the average observed before the slowdown started in the middle of the 2010s, with the pace of increase gradually diminishing over the projection period. By 2051, life expectancy is projected to reach 84.8 years for males and 88.1 years for females. This represents total life expectancy gains of 4.1 years for males and 3.1 years for females between 2024 and 2051.
In the low-growth scenario, life expectancy increases at a slower pace, to 83.3 years for males and 86.7 years for females by 2051. In the high-growth scenario, life expectancy reaches 86.6 and 89.7 years in 2051 for males and females respectively.
Table B: Life expectancy in Ontario, 1991 to 2051
| Item | 1991 | 2001 | 2011 | 2021 | 2031 | 2041 | 2051 |
|---|---|---|---|---|---|---|---|
| Males at birth | 74.9 | 77.4 | 79.9 | 79.5 | 82.1 | 83.5 | 84.8 |
| Males at age 65 | 15.7 | 17.2 | 19.0 | 19.6 | 21.1 | 22.2 | 23.1 |
| Females at birth | 80.7 | 82.0 | 84.1 | 84.3 | 86.0 | 87.1 | 88.1 |
| Females at age 65 | 19.6 | 20.3 | 22.0 | 22.4 | 23.7 | 24.6 | 25.4 |
Sources: Statistics Canada, 1991–2021, and Ontario Ministry of Finance projections.
Mortality assumptions at the census division level
At the census division level, the mortality assumptions were developed using a ratio methodology. The Ontario-level mortality structure was applied to each census division’s age structure over the most recent ten years of comparable data and the expected number of deaths was computed. This was then compared to the actual annual number of deaths for each census division over this period to create ratios of actual-to-expected number of deaths. These ratios were then multiplied by provincial age-specific death rates to create death rates for each census division. These were then applied to the corresponding census division population to derive the number of deaths for each census division.
The ratio of actual-to-expected deaths for each census division was relatively stable over time and did not reveal a consistent pattern of convergence or divergence among regions. For this reason, the most recent ten-year average ratio for each census division was held constant over the projection period.
Components of net migration
The following sections discuss assumptions and methodology for the components of net migration, including immigration, emigration, non-permanent residents, interprovincial migration and intraprovincial migration.
Immigration
Immigration levels in Canada are determined by federal government policy. Immigration, Refugees and Citizenship Canada (IRCC) sets the national target and target range for the level of immigration to be achieved over the following year(s). For calendar years 2026 to 2028, the target is set at 380,000 annually. These targets represent a significant decrease from those set in recent years. The share of immigrants to Canada settling in Ontario increased slightly in calendar year 2025, from 42.6 per cent in 2024 to 43.1 per cent. These latest immigration shares are above Ontario’s share of the Canadian population (39.0%). This is projected to continue in the projections.
Exceptionally for calendar years 2026 and 2027, the federal immigration plan includes one-time programs that will bring total immigration levels above the announced targets. At the national level, this will add 148,000 more immigrants, of whom 84,600 are projected to settle in Ontario over 2025–26 to 2027–28.
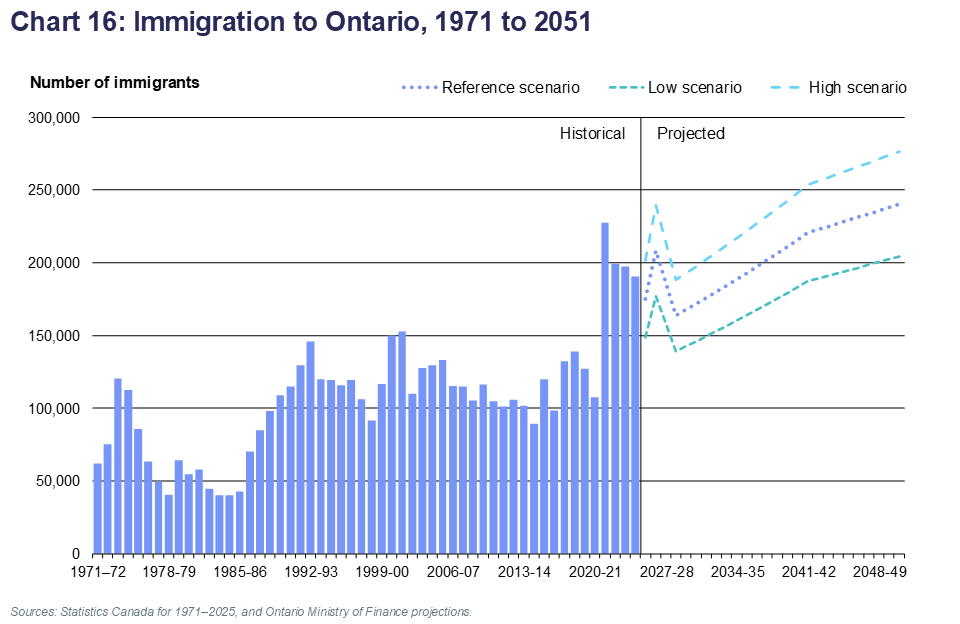
In the reference scenario, annual immigration levels to Canada are projected to follow the federal plan to 2028. Based on Ontario’s latest share of national immigration, by 2028–29 this will correspond to about 164,000 newcomers with a provincial immigration rate of 1.0 per cent. Over the rest of the projection period, the number of immigrants will increase slowly over time as population grows, such that annual immigration is projected to reach 240,000 by 2050–51. The immigration rate will rise gradually after 2028–29 to reach 1.2 per cent by 2041, remaining stable thereafter.
Immigration levels in the low-growth scenario are set at 85 per cent of reference scenario levels in the long term, resulting in immigration levels rising to 204,000 by 2050–51. In the high-growth scenario, immigration levels are set at 115 per cent of reference scenario levels in the long term, resulting in immigration rising strongly to reach 277,000 by 2050–51.
Immigration assumptions at the census division level
Projected immigration shares for each census division are based on the trends observed in the distribution of immigrants by census division over the recent past. These shares evolve throughout the projection period following established trends. The average age-gender distribution pattern for immigrants observed over the past five years is assumed to remain constant over the entire projection period. Nearly 90 per cent of immigrants coming to Ontario in 2024–25 were aged 0 to 44.
Emigration
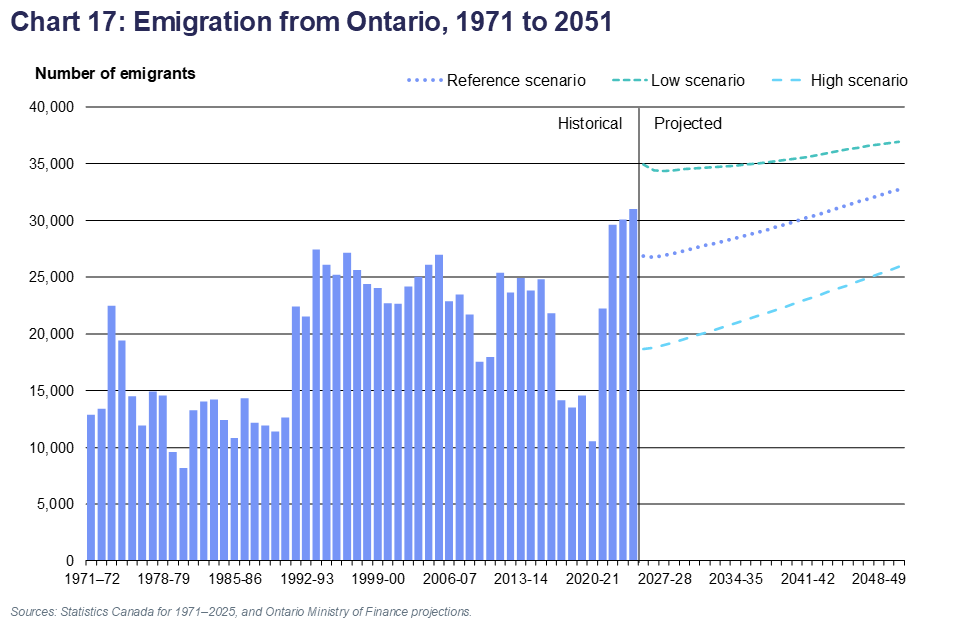
Total emigration is defined as the flow of international emigration, minus returning emigrants. The level of total emigration from Ontario was 31,000 in 2024–25, in line with levels observed over the previous two years.
In the reference scenario, the average emigration rates by age and gender for each census division over the 2019 to 2025 period (excluding pandemic year 2020–21) are used to model the projected number of people emigrating annually from each census division. The modelling is dynamic, taking into account the annual changes in age and gender structure within census divisions. For Ontario as a whole, this results in the number of emigrants increasing gradually over the projection period to reach 32,700 by 2050–51.
In the low-growth scenario, emigration rates by age and gender used in the reference scenario are increased by 30 per cent, making them 130 per cent of recently-observed rates. This results in emigration levels reaching 36,900 by 2050–51.
In the high-growth scenario, emigration rates by age and gender used in the reference scenario are reduced by 30 per cent, making them equivalent to 70 per cent of recently-observed rates. This results in the number of emigrants reaching 25,900 by 2050–51.
Non-permanent residents
As of July 2025, there were almost 1.4 million non-permanent residents (NPRs) living in Ontario. This group includes international students, temporary foreign workers, asylum claimants, and protected persons. These foreign residents are included in the base population as they are counted in the Census and are included in the components of population change. The year-to-year change in the total number of NPRs is accounted for as a component of population growth in the projections. Establishing assumptions for this component is complicated due to the transient nature of the group and annual fluctuations resulting from changes in federal policies.
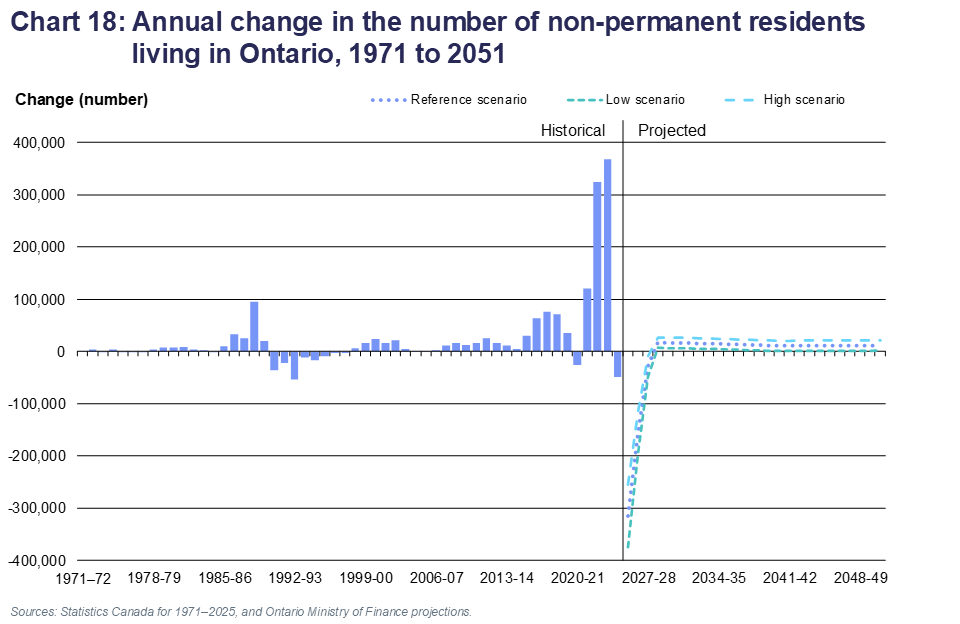
The increase in the number of NPRs in Ontario averaged 71,000 annually over the three years before the pandemic (2016–19), significantly higher than the average of the previous 20 years (11,000). In 2019–20 and 2020–21, travel restrictions combined with immigration initiatives favouring in-Canada temporary residents for permanent residency slowed the increase in the number of non-permanent residents in Ontario. However, record increased were recorded in 2021–22 (121,000), 2022–23 (325,000) and 2023–24 (368,000).
In March 2024, prompted by the record increases in the population of NPRs, the federal government began announcing measures aimed at reducing NPR numbers as a proportion of the Canadian population. The initial announcement set a target to reduce the share of non-permanent residents to 5.0 per cent of the national population by the end of 2026. However, the proportion of NPRs continued to increase, rising from 6.9 per cent in March 2024 to 7.6 per cent by November 2024. The number of NPRs in Canada eventually started to decline at the end of 2024, and by January 2026 they represented 6.5 per cent of the national population.
To meet the target of 5.0 per cent of national population, the share of NPRs in the national population would need to decrease by approximately one-quarter. The federal timeline to reach this goal has now been shifted to the end of 2027. Given the rapidly decreasing number of non-permanent residents during the second half of 2025, the updated timeline appears realistic and is likely to be achieved.
In the reference scenario, the proportion of NPRs in Ontario’s population is projected to decline according to the federal timeline. For 2025–26, the net decrease is set to 315,000, followed by further declines of 157,000 in 2026–27, and 29,000 in 2027–28. This is followed by a gradual return to more normal NPR flows by 2029–30, with an assumed annual growth of 2.0 per cent in the number of NPRs in Ontario, falling gradually to an assumption of 1.0 per cent growth each year from 2041 onwards, in line with the pace of overall population growth. By 2050–51, these assumptions produce an annual net increase of 12,000 NPRs in the reference scenario.
The low- and high-growth scenarios are set as a range of 10,000 below and above the reference scenario over the long term. By 2050–51, the annual net gain in NPRs reaches 2,000 in the low-growth scenario and 22,000 in the high-growth scenario.
Non-permanent resident assumptions at the census division level
Projected shares of the net change in non-permanent residents for each census division, as well as their distributions by age and gender, are based on the shares observed over the last five years. The distribution pattern is assumed to remain constant over the projection period.
Interprovincial migration
Interprovincial migration is a component of population growth that fluctuates significantly from year to year. Although Ontario continued to attract migrants from other provinces, trend analysis over the past three decades reveals a mixed pattern of several years of gains followed by several years of losses. This pattern is usually closely tied to economic cycles.
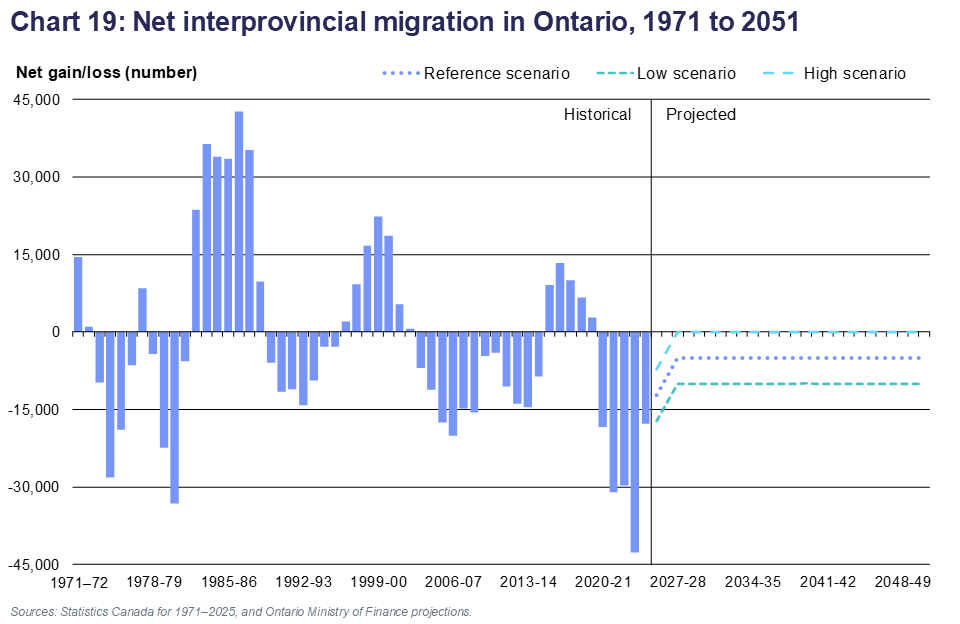
Over the past 30 years, net interprovincial migration has not contributed to Ontario’s population growth, with net losses averaging about 5,600 people per year. Between 2015 and 2019, net interprovincial migration to Ontario had been positive. However, the most recent data shows a reversal of this trend, with net losses recorded in the last five years.
In the reference scenario, annual net interprovincial migration to Ontario is set at -12,200 for 2025–26, reflecting the most recent data, followed by a net loss of 8,600 in 2026–27. The long-term assumption of a net annual loss of 5,000 starts in 2027–28, remaining at that level for the rest of the projection period.
The low- and high-growth scenarios are set as a range of 5,000 above and below the reference scenario’s net loss in the long term. From 2027–28 onward, these assumptions produce a net annual interprovincial migration loss of 10,000 in the low scenario and a net of zero in the high-growth scenario.
The annual in-flows corresponding to the long-term net migration levels in the low-growth, reference and high-growth scenarios are 62,000, 64,500 and 67,000, respectively. The corresponding annual out-flows are 72,000, 69,500 and 67,000.
Interprovincial migration assumptions at the census division level
For each census division, interprovincial migration flows reflect migration rates by age and gender observed during the last five years and vary over the projection period following Ontario-level fluctuations. Each census division’s share of Ontario inflow and outflow of interprovincial migrants over the last five years is applied to projected flows for the province and held constant throughout the projection period.
Intraprovincial migration
At the census division level, intraprovincial migration, or the movement of population from one census division to another within the province, is a significant component of population growth. This component directly affects population growth only at the census division and regional levels.
From 2001 to 2021, the annual number of intraprovincial migrants in Ontario had fluctuated within the 358,000 to 442,000 range. The propensity to migrate within Ontario increased during the pandemic, with 568,000 intraprovincial migrants in 2021–22. However, it has since come down, with 477,000 intraprovincial migrants in 2022–23 and 448,000 in 2023–24.
In the short term, the annual number of intraprovincial migrants is projected to decline from 495,000 in 2025–26 to 455,000 by 2029–30. Over the rest of the projection period, it is projected to increase slowly to reach 463,000 by 2050–51. The resulting rate of intraprovincial migration in Ontario declines from 3.0 per cent in 2025–26 to 2.7 per cent in 2030–31, and 2.3 by 2050–51.
Intraprovincial migration assumptions at the census division level
The projected number of people by age, leaving each census division for each year of the projections, as well as their destination within the province, is modelled using origin-destination migration rates by age and census division over the past five years. Given that migration rates are different for each census division and because age groups have different origin-destination behaviours, the methodology provides an approach to project movers based on observed age and origin-destination migration patterns. The modelling is dynamic, taking into account the annual changes in age structure within census divisions.
The evolution of intraprovincial migration patterns in each census division was studied to identify specific trends and the intraprovincial migration rate assumptions were adjusted to account for these trends.
Glossary
- Baby boom generation
- People born during the period following World War II, from 1946 to 1965, marked by a significant increase in fertility rates and in the number of births.
- Baby boom echo
- People born during the period 1972 to 1992. Children of baby boomers.
- Cohort
- Represents a group of persons who have experienced a specific demographic event during a given period, which can be a year. For example, the birth cohort of 1966 consists of the number of persons who were born in 1966.
- GTA
- The Greater Toronto Area, comprised of the census divisions of Toronto, Durham, Halton, Peel and York.
- International migration
- Movement of population between Ontario and a foreign country. International migration includes immigrants, emigrants and non-permanent residents. Net international migration is the difference between the number of people entering and the number of people leaving the province from foreign countries.
- Interprovincial migration
- Movement of population between Ontario and the rest of Canada. Net interprovincial migration is the difference between the number of people entering Ontario from the rest of Canada and the number of people leaving Ontario for elsewhere in Canada.
- Intraprovincial migration
- Movement of population between the 49 census divisions within Ontario. Net intraprovincial migration for a given census division is the difference between the number of people moving from the rest of Ontario to this census division and the number of people leaving it for elsewhere in the province.
- Life expectancy
- A statistical measure reflecting the average number of years of life remaining for members of a particular population at a specific age if they were to experience during their lives the age-specific mortality rates observed in a given year.
- Median age
- The median age is the age at which exactly one half of the population is older, and the other half is younger. This measure is often used to compare age structures between jurisdictions.
- Natural increase
- The number of births minus the number of deaths.
- Net migration
- Difference between the number of people entering and the number of people leaving a given area. This includes all the migration components included in net international migration, net interprovincial migration and net intraprovincial migration (for sub-provincial jurisdictions).
- Non-permanent residents
- Foreign citizens living in Ontario with a valid work, study, or other permit, or who have claimed refugee status (e.g., international students, foreign workers, and refugee claimants).
- Population aging
- An expression used to describe shifts in the age distribution of the population toward more people of older ages. One indicator of population aging is an increasing share of seniors (ages 65+) in the population.
- Population estimates
- Measures of current and historical resident population derived using Census and administrative data.
- Total fertility rate
- The sum of age-specific fertility rates during a given year. Indicates the average number of children that a generation of women would have if, over the course of their reproductive life, they had fertility rates identical to those of the year considered.
Statistical tables
View the related statistical tables at Ontario's Open Data Catalogue
Accessible chart descriptions
Chart 1: Ontario population, 1971 to 2051
This line chart shows the estimated total population of Ontario from 1971 to 2025, and the projection to 2051 for the three scenarios (reference, high and low). Over the historical period, Ontario’s population increased from 7.8 million in 1971 to 16.3 million in 2025. Over the projections period 2025-2051, the three scenarios gradually diverge. In the reference scenario, total population reaches 20.2 million in 2051. Ontario’s population reaches 22.9 million in the high scenario and 17.8 million in the low scenario at the end of the projection period.
Chart 2: Annual rate of population growth in Ontario, 1971 to 2051
This chart shows historical annual growth rates of Ontario’s population as bars from 1971 to 2024, and projected growth rates as lines for the three scenarios (reference, high and low). Over the historical period, annual growth rates start at 1.5% in 1971-72, and then decline to reach 0.8% in 1980-81. This is followed by higher growth rates culminating at 2.7% in 1988-89, with a lower peak of 1.8% in 2000-01, trending lower to 0.7% in 2014-15, and reaching 3.3% in 2023-24. The projected annual growth rate of Ontario’s population in the reference scenario is -1.0% in 2025-26, trending to reach 0.9% in 2050-51. In the high scenario, annual population growth goes from -0.3% in 2025-26 to 1.4% over the projection period. In the low scenario, population growth goes from -1.7% in 2025-26 to 0.4% in 2050-51.
Chart 3: Contribution of natural increase & net migration to Ontario’s population growth, 1971 to 2051
This area chart shows the annual contribution of natural increase and net migration to Ontario’s population growth from 1971 to 2051. Over the historical period, natural increase was more stable than net migration, starting at about 69,000 in 1971-72, with an intermediate high point of 79,000 in 1990-91, and a declining trend to 20,000 by 2024-25. Over the projection period, natural increase is projected to decrease gradually, reaching -26,000 by 2050-51. Net Migration was more volatile over the historical period, starting at about 45,000 in 1971-72, with a low point of 10,000 in 1978-79, peaks of 194,000 in 1988-89, 168,000 in 2000-01, and 493,000 in 2023-24. Annual net migration is projected to go from -179,000 in 2025-26 to 214,000 by 2050-51.
Chart 4: Age pyramid of Ontario’s population, 2024 and 2051
This population pyramid shows the number of people of each age in Ontario in 2025 and 2051 separately for males and females. In 2025, the pyramid starts at the bottom with about 70,000 each for males and females aged zero and gradually widens to over 130,000 people per cohort in their late520s. This is followed by a narrowing of the pyramid to about 90,000 at age 50, and a peak above 100,000 after age 60. The pyramid subsequently narrows to only a few thousand people per cohort at ages 95+. The 2051 line starts at around 90,000 each for both males and females at age zero with peak of 150,000 at age 35, followed by another peak of 140,000 at age 55, and a decline to age 95+.
Chart 5: Proportion of population aged 0–14, 15–64 and 65+ in Ontario, 1971 to 2051
This chart has three lines showing the evolution of the share of Ontario’s population in age groups 0-14, 15-64 and 65+ over the 1971-2051 period. The highest proportion is aged 15-64 and is fairly stable over the historical period between 60% and 70%, with a declining trend starting around 2010. Over the projection period, the share of people aged 15-64 is projected to fall from 66.5% to 64.3%. The share of population aged 0-14 is seen falling gradually from 28.4% in 1971 to 14.8% in 2025, with a further decline to 13.0% by 2051. The share of seniors increased slowly from 8.3% in 1971 to 18.9% in 2025, will keep rising to reach 22.9% in 2040 and subsequently decline to 22.7% by 2051. The share of seniors surpassed that of children in 2016.
Chart 6: Pace of growth of population age groups 0–14, 15–64 and 65+ in Ontario, 1971 to 2051
This line chart shows the pace of annual growth of population age groups 0-14, 15-64 and 65+ in Ontario from 1971 to 2051. The 65+ age group grows faster than the other two groups for most of the historical and the first half of the projection period, with a peak of 4.3% in 2011-12 and a low close to 0.8% in the early 2040s. The annual pace of growth of the 15-64 age group is seen trending gradually lower from 2.4% in 1971-72 to 0.2% in 2014-15, followed by a peak of 3.6% in 2022-23, annual declines from 2025 to 2027, then rising around 1.0 per cent from 2036 to 2051. The 0-14 age group recorded declines from 1971 to 1982 with a trough of -2.3% in 1978-79, and then again from 2002 to 2011. Over the projection period, the number of children is projected decline initially until 2033, and see growth for the rest of the projections, ending at 1.0% by 2050-51.
Chart 7: Evolution of natural increase by census division, 2025 to 2051
This map shows the evolution of natural increase by census division in Ontario over the projection period 2025-51. The census divisions are split in four categories.
Census divisions where natural increase is projected to be negative throughout 2025-2051 include: Rainy River, Thunder Bay, Cochrane, Algoma, Sudbury, Greater Sudbury, Timiskaming, Manitoulin, Parry Sound, Nipissing, Lambton, Chatham-Kent,
Huron, Bruce, Grey, Haldimand-Norfolk, Niagara, Muskoka, Haliburton, Kawartha Lakes, Peterborough, Northumberland, Hastings, Prince Edward, Lennox & Addington, Frontenac, Renfrew, Lanark, Leeds & Grenville, and Stormont, Dundas & Glengarry.
Census division where natural increase is projected to be positive in 2025-26, but negative by 2036: Essex, Elgin, Perth, Brant, Simcoe, York, Toronto, and Prescott & Russell.
Census division where natural increase is projected to be positive in 2025-26, but negative by 2051: Middlesex, Oxford, Wellington, Waterloo, Halton, and Hamilton.
Census divisions where natural increase is projected to be positive throughout 2025-2051 include: Kenora, Oxford, Waterloo, Peel, Durham, Ottawa.
Chart 8: Population of Ontario regions, 2025 and 2051
This chart shows a map of Ontario’s 6 regions with bars showing their total populations in 2025 and 2051.
For 2025, the chart shows total population in millions for each of the regions as:
Northwest 0.25, Northeast 0.62, Southwest 1.9, Central 3.6, GTA 7.7, East 2.2.
For 2051, the chart shows total population in millions for each of the regions as:
Northwest 0.28, Northeast 0.74, Southwest 2.5, Central 4.7, GTA 8.9, East 3.1.
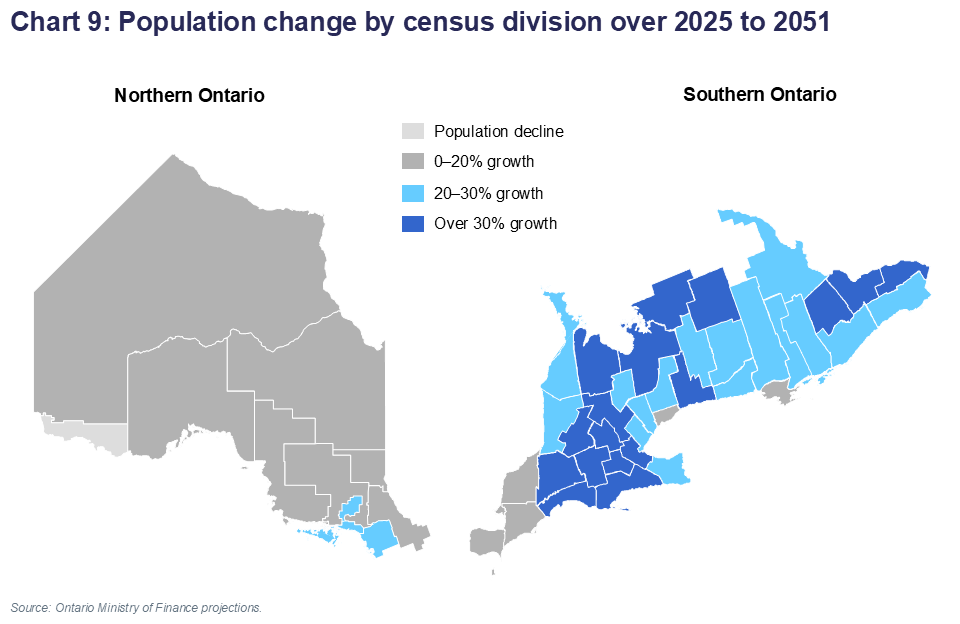
Chart 9: Population change by census division over 2025 to 2051
This map shows the population growth by census division in Ontario over the projection period 2025-51. The census divisions are split in four categories.
Census divisions where population is projection to decline include: Rainy River.
Census divisions where population is projected to increase between zero and 20% include: Kenora, Thunder Bay, Cochrane, Algoma, Sudbury, Nipissing, Essex, Lambton, Chatham-Kent, Toronto, Prince Edward.
Census divisions where population is projected to increase between 20% and 30% include: Greater Sudbury, Manitoulin, Parry Sound, Huron, Bruce, Dufferin, Niagara, Halton, Peel, York, Peterborough, Kawartha Lakes, Northumberland, Hastings, Lennox & Addington, Frontenac, Renfrew, Leeds & Grenville, and Stormont, Dundas & Glengarry.
Census divisions where population is projected to increase by over 30% include: Middlesex, Elgin, Oxford, Perth, Haldimand-Norfolk, Brant, Hamilton, Waterloo, Wellington, Grey, Simcoe, Muskoka, Haliburton, Durham, Lanark, Ottawa, Prescott & Russell.
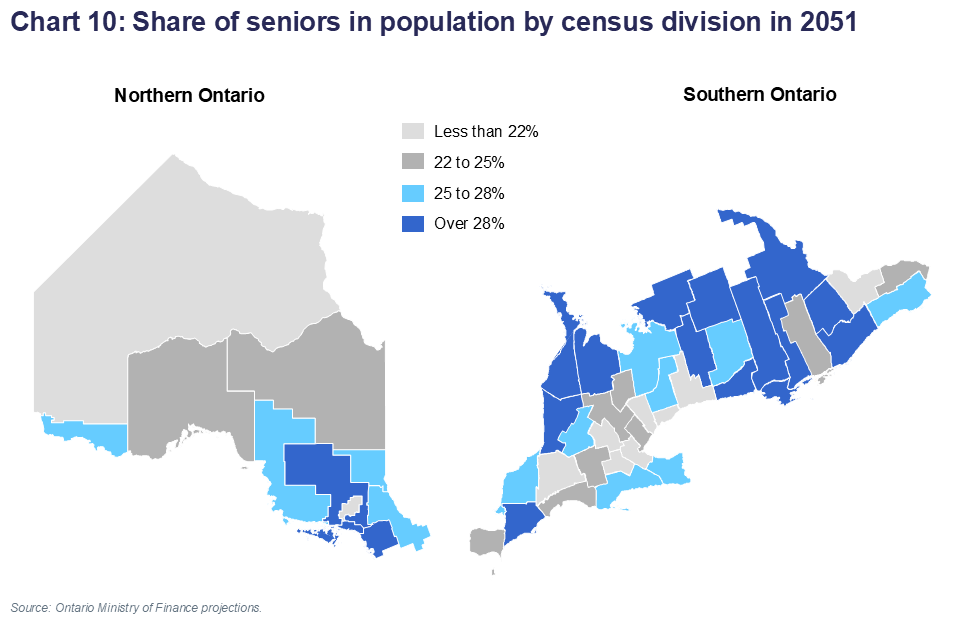
Chart 10: Share of seniors in population by census division in 2051
This map shows the projected share of seniors in the population of Ontario census divisions in 2051. The census divisions are split in four categories.
Census divisions with less than 22% seniors in 2051 include: Kenora, Greater Sudbury, Middlesex, Brant, Hamilton, Waterloo, Peel, Toronto, Durham, Ottawa.
Census divisions with between 22% and 25% seniors in 2051 include: Thunder Bay, Cochrane, Essex, Elgin, Oxford, Wellington, Dufferin, Halton, Frontenac, Prescott & Russell.
Census divisions with between 25% and 28% seniors in 2051 include: Rainy River, Algoma, Timiskaming, Nipissing, Lambton, Perth, Haldimand-Norfolk, Niagara, Simcoe, York, Peterborough, Stormont, Dundas & Glengarry.
Census divisions with over 28% seniors in 2051 include: Sudbury, Manitoulin, Parry Sound, Chatham-Kent, Huron, Bruce, Grey, Muskoka, Haliburton, Kawartha Lakes, Northumberland, Lennox & Addington, Renfrey, Lanark, Prince Edward, Leeds & Grenville.
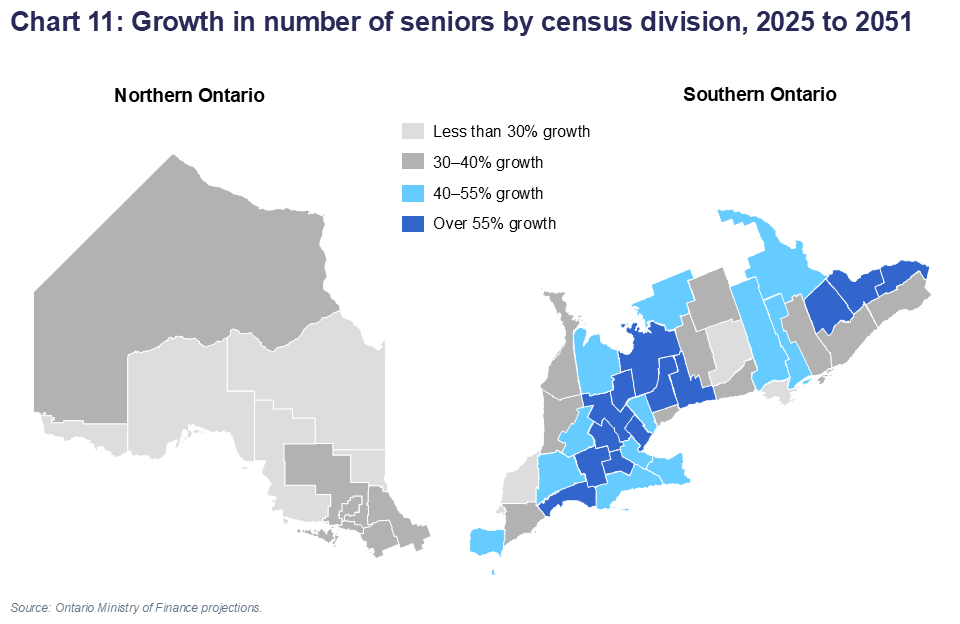
Chart 11: Growth in number of seniors by census division, 2025 to 2051
This map shows the growth in number of seniors in the population of Ontario census divisions between 2024 and 2051. The census divisions are split in four categories.
Census divisions with less than 35% projected growth in number of seniors over 2024-2051 include: Kenora, Rainy River, Thunder Bay, Cochrane, Timiskaming, Algoma, Manitoulin, Sudbury, Greater Sudbury, Nipissing, Lambton, Huron, Prince Edward.
Census divisions with between 35% and 50% projected growth in number of seniors over 2024-2051 include: Parry Sound, Chatham-Kent, Bruce, Grey, Toronto, Kawartha Lakes, Haliburton, Peterborough, Northumberland, Hastings, Lennox & Addington, Renfrew, Frontenac, Leeds & Grenville, Stormont, Dundas & Glengarry.
Census divisions with between 50% and 70% projected growth in number of seniors over 2024-2051 include: Essex, Middlesex, Elgin, Perth, Oxford, Brant, Haldimand-Norfolk, Hamilton, Niagara, Peel, Muskoka, Lanark.
Census divisions with over 70% projected growth in number of seniors over 2024-2051 include: Waterloo, Wellington, Dufferin, Simcoe, Halton, York, Durham, Ottawa, Prescott & Russell.
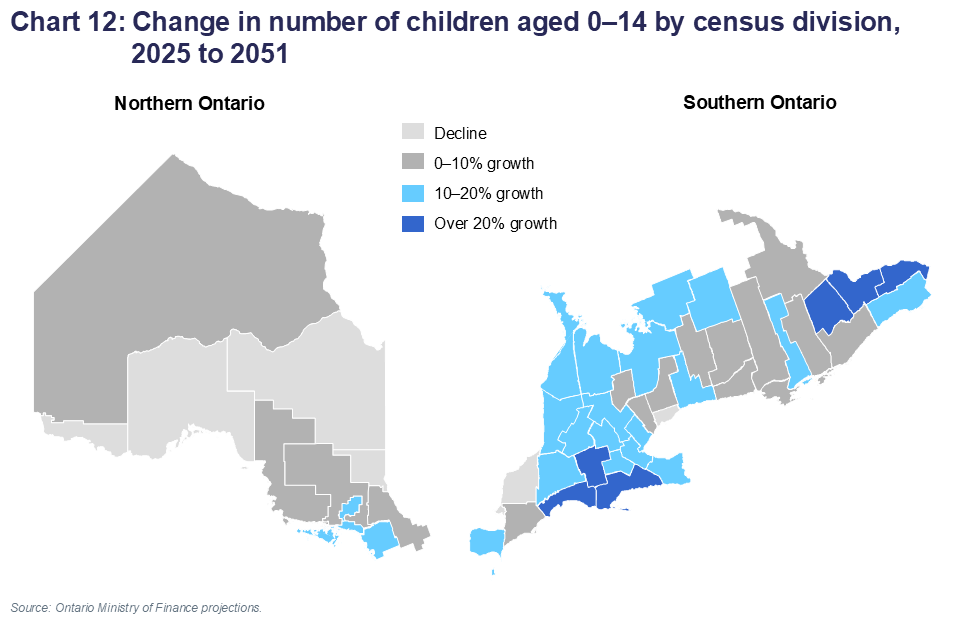
Chart 12: Change in number of children aged 0–14 by census division, 2025 to 2051
This map shows the growth in number of children aged 0-14 in the population of Ontario census divisions between 2025 and 2051. The census divisions are split in four categories.
Census divisions with a projected decline in number of children aged 0-14 over 2025-2051 include: Rainy River, Thunder Bay, Cochrane, Timiskaming, Lambton, Toronto.
Census divisions with between 0% and 10% projected growth in number of children aged 0-14 over 2025-2051 include: Kenora, Algoma, Sudbury, Greater Sudbury, Nipissing, Chatham-Kent, Dufferin, Peel, York, Kawartha Lakes, Peterborough, Northumberland, Hastings, Prince Edward, Renfrew, Frontenac, Leeds & Grenville.
Census divisions with between 10% and 20% projected growth in number of children aged 0-14 over 2025-2051 include: Manitoulin, Parry Sound, Essex, Middlesex, Huron, Bruce, Grey, Wellington, Waterloo, Brant, Niagara, Hamilton, Halton, Simcoe, Durham, Muskoka, Haliburton, Lennox & Addington, Stormont, Dundas & Glengarry.
Census divisions with over 20% projected growth in number of children aged 0-14 over 2025-2051 include: Elgin, Oxford, Haldimand-Norfolk, Lanark, Ottawa, Prescott & Russell.
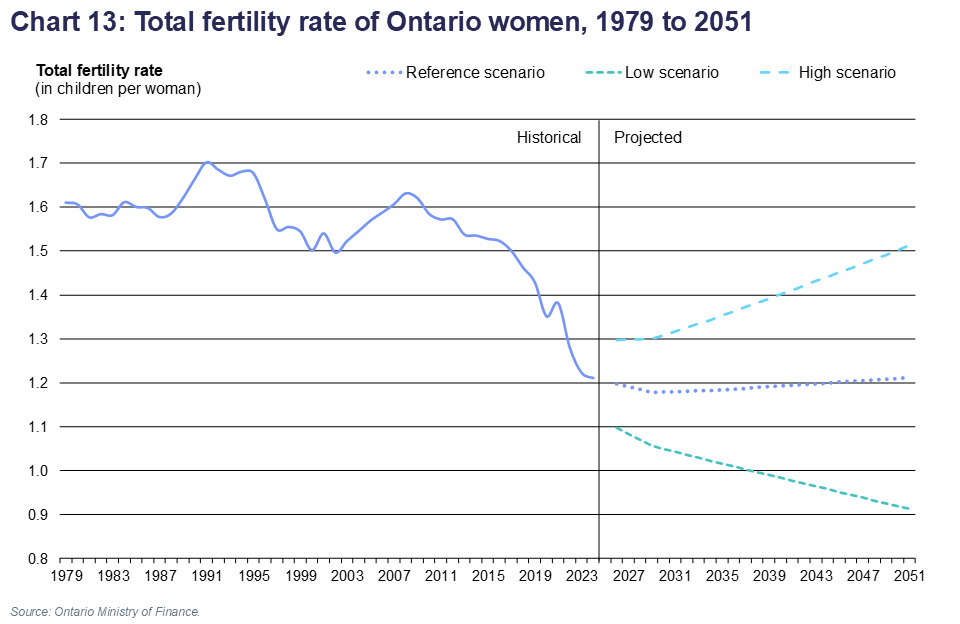
Chart 13: Total fertility rate of Ontario women, 1979 to 2051
This line chart shows the historical total fertility rate of Ontario women from 1979 to 2024, and projections under the three scenarios for 2025-2051. Over the historical period, the total fertility rate in Ontario was hovering within a narrow range between 1.70 and 1.50 from the late 1970s to about 2017. Then it fell to 1.21 in 2024. The total fertility rate is projected to reach 1.21 in 2050-51 under the reference scenario, 0.91 under the low scenario, and 1.51 under the high scenario.
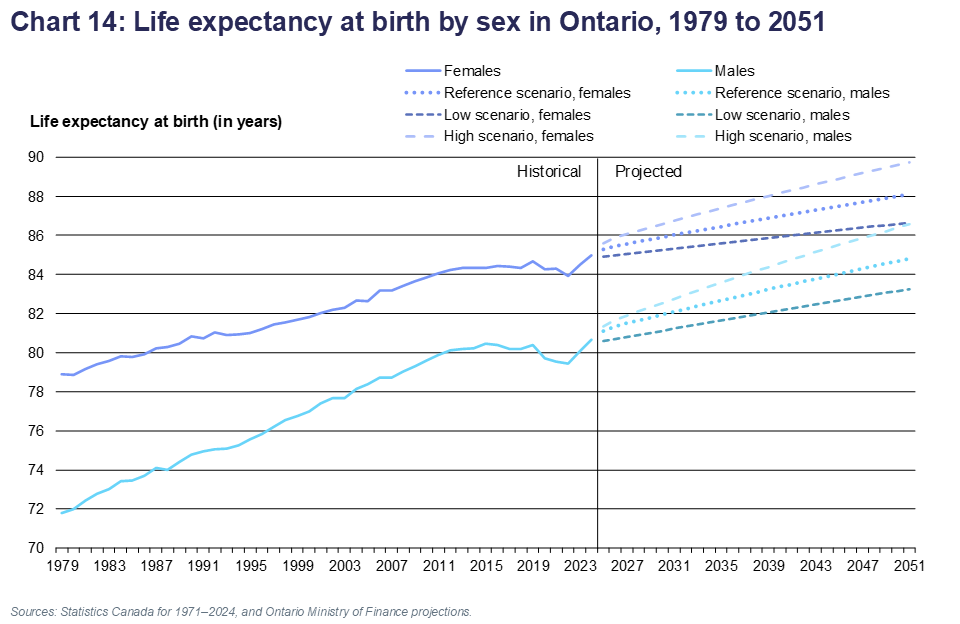
Chart 14: Life expectancy at birth by sex in Ontario, 1979 to 2051
This line chart shows the historical life expectancy at birth by gender in Ontario from 1979 to 2024, and projections under three scenarios for 2025-2051.
For females, life expectancy at birth rose from 78.9 years in 1979 to 85.0 years in 2024. Over the projection period to 2051, life expectancy of females is projected to increase gradually to reach 88.1 years under the reference scenario, 89.7 years under the high scenario, and 86.7 years under the low scenario.
For males, life expectancy at birth rose from 71.8 years in 1979 to 80.7 years in 2024. Over the projection period to 2051, life expectancy of males is projected to increase gradually to reach 84.8 years under the reference scenario, 86.6 years under the high scenario, and 83.3 years under the low scenario.
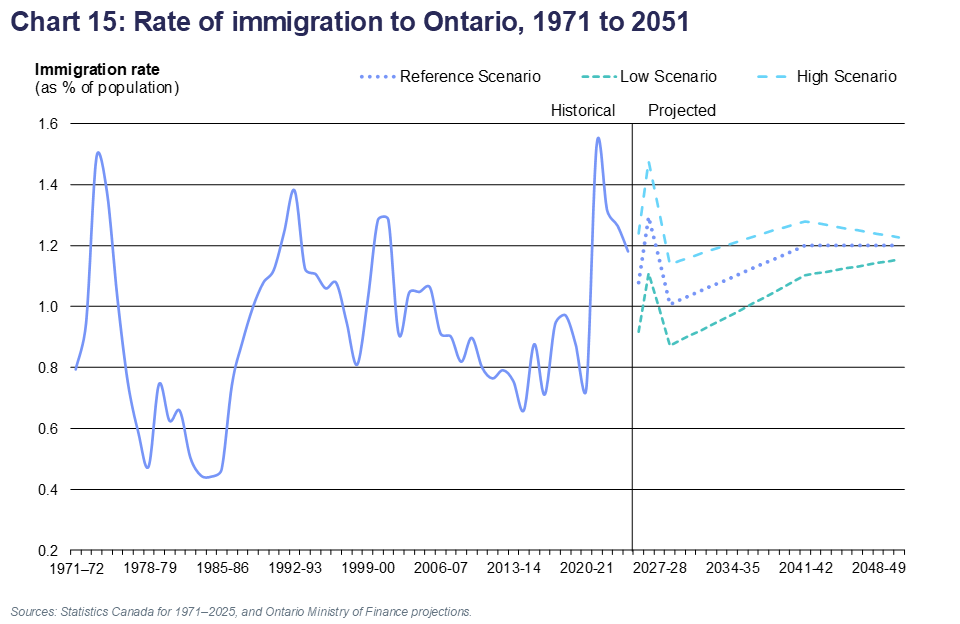
Chart 15: Rate of immigration to Ontario, 1971 to 2051
This line chart shows the historical immigration rate to Ontario from 1971 to 2025 and projections under three scenarios to 2051. Over the historical period, the immigration rate was very volatile, starting at 0.79% in 1971-72, rising to 1.49% by 1973-74, declining to a low of 0.44% by the mid-1980, rising again to 1.38% by 1992-93, then falling gradually to reach 0.66% in 2014-15, and rebounding 1.53% to in 2021-22.
Over the projections period 2025-2051, the immigration rate to Ontario is projected initially at 1.08% in the reference scenario in 2025-26, 1.24% in the high scenario, and 0.92% in the low scenario. This is followed by gradual changes to 2050-51 in all scenarios to reach 1.20% in the reference scenario, 1.23% in the high scenario, and 1.16% in the low scenario.
Chart 16: Immigration to Ontario, 1971 to 2051
This chart shows historical annual immigration levels to Ontario from 1971 to 2025 and projections under three scenarios to 2051. Over the historical period, immigration was very volatile, stating at about 62,000 in 1971-72, rising to 120,000 by 1973-74, falling to 40,000 in the mid-1980s, rising to peak at 153,000 in 2001-02, gradually declining thereafter to reach 90,000 in 2014-15, and rebounding to 227,000 in 2021-22.
Immigration to Ontario is projected to increase from 164,000 in 2028-29 to 240,000 by 2050-51 in the reference scenario, from 188,000 to 277,000 in the high-growth scenario, and from 139,000 to 204,000 in the low-growth scenario.
Chart 17: Emigration from Ontario, 1971 to 2051
This chart shows historical annual emigration levels from Ontario from 1971 to 2024, as well as projections of emigration under three scenarios to 2051. Over the historical period, emigration was very volatile, stating at about 13,000 in 1971-72, rising to 22,000 by 1973-74, falling to 8,000 in 1980-81, rising to peak at 27,000 in 1993-94 and hovering around 30,000 since 2022.
Emigration from Ontario is projected to increase from 27,000 in 2025-26 to 33,000 in 2050-51 in the reference scenario, from 19,000 to 26,000 in the high scenario, and from 35,000 to 37,000 in the low scenario.
Chart 18: Annual change in the number of non-permanent residents living in Ontario, 1971 to 2051
This chart shows historical annual net gains in non-permanent residents in Ontario from 1971 to 2024 and projections under three scenarios to 2051. Over the historical period, the net gain was very volatile, starting with values close to zero in the early 1970s, with a peak of 95,000 in 1988-89, a deep through of -54,000 in 1992-93, and another high level in 2023-24 at 368,000.
The projected annual net change in non-permanent residents in Ontario is projected to be negative from 2025 to 2028 in all scenarios, and reach a net gain of 12,000 by 2050-51 in the reference scenario, 22,000 in the high scenario, and 2,000 in the low scenario.
Chart 19: Net interprovincial migration in Ontario, 1971 to 2051
This chart shows the historical net interprovincial migration gain in Ontario from 1971 to 2025 and projections under three scenarios to 2051.
Over the historical period, net interprovincial migration followed cycles of net gains followed by net losses. Net interprovincial migration was generally negative during the 1970s, the late 1980s and early 1990s, and from 2003 to 2015. Positive cycles occurred during the early 1980s, the late 1990s, and from 2015 to 2020. In 2024-25, net interprovincial migration to Ontario was -18,000.
In the reference scenario, annual net interprovincial migration is set at -12,000 for 2025-26, rising to -5,000 by 2027-28, and remaining at -5,000 for the rest of the projections. In the high scenario, a net annual interprovincial migration is set at -7,000 for 2025-26, rising to zero by 2027-28, and remaining at that level for the rest of the projections. In the low scenario, net interprovincial migration is set at -17,000 for 2025-26, rising to -10,000 by 2027-28, and remaining at that level for the rest of the projections.
Map of Ontario census divisions
This map includes the following census divisions:
GTA:
- Toronto
- Durham
- Halton
- Peel
- York
Central:
- Brant
- Dufferin
- Haldimand–Norfolk
- Haliburton
- Hamilton
- Muskoka
- Niagara
- Northumberland
- Peterborough
- Simcoe
- Kawartha Lakes
- Waterloo
- Wellington
East:
- Ottawa
- Frontenac
- Hastings
- Lanark
- Leeds and Grenville
- Lennox and Addington
- Prescott and Russell
- Prince Edward
- Renfrew
- Stormont, Dundas and Glengarry
Southwest:
- Bruce
- Elgin
- Essex
- Grey
- Huron
- Chatham–Kent
- Lambton
- Middlesex
- Oxford
- Perth
Northeast:
- Algoma
- Cochrane
- Manitoulin
- Nippissing
- Parry Sound
- Greater Sudbury
- Sudbury
- Timiskaming
Northwest:
- Kenora
- Rainy River
- Thunder Bay
Return to map of Ontario census divisions
Related
Footnotes
- footnote[1] Back to paragraph Results are presented for Census years, which run from July 1 to June 30.
- footnote[2] Back to paragraph Based on the Pearsonian approach, a parametric model used to distribute estimated fertility rates by age of mothers.
- footnote[3] Back to paragraph Following the Lee-Carter method of mortality projection used to generate annual age-sex specific mortality rates. See Lee, Ronald D., and Carter, Lawrence, 1992. “Modeling and Forecasting the Time Series of U.S. Mortality,” Journal of the American Statistical Association 87, no 419 (September):659-71.