How to use AgMaps
Learn how to create custom maps and find agricultural information for Ontario using the AgMaps interactive mapping website.
Overview
AgMaps is an interactive online application that allows you to create custom maps and find agricultural information for Ontario.
With AgMaps, you can:
- view aerial photographs of your land
- create custom maps for your land
- customize and label your maps using mapping tools
- create farm sketches for government programs
- research soil information for your land
Search for your location
- Under the “Layers” tab, select the “Search by Location” button or the “Assessment Parcel” button to search using assessment parcel roll numbers.
- Select the button corresponding to how you’d like to search and fill out the input boxes and then select the “Search” button or “Find Parcel”. When searching by parcels you can find and create a list of parcels and then zoom to one or all of them.
Note: If a window appears on your screen indicating there was an “error”, go to your browser settings and clear your browsing data and/or empty your browser’s cache and try the search again.
Add information to your map
Once you have found your location, you can add information to the map.
- Under the “Layers” tab, select the “Select Map Layers” button.
- The layers are organized in groups so selecting the plus sign icon to the left of the groups will expand the group and show the individual layers in that group.
- Choose the layers you wish to include or exclude from your map by checking or unchecking the boxes on the left-hand side.
Note: Some of the layers can only be viewed when the map is zoomed to a certain scale. These layers will appear grey on the map until the map is zoomed to a viewable scale. - Some layers will require you to select the “Layer Symbology Legend” button between the check box and the layer name, to view its symbology legend.
You can also find more information about a particular layer.
- Under the “Layers” tab, select the “i” “identify” button, with “Point” labelled below it.
- Select a location of the map to see more information for that area. A list of results about the layers you checked will appear in the window to the left of the map. Select each result to view details about that layer.
Note: You may get multiple results when you click on the map. Try to click in the centre of the map feature you want information about. - To turn on the aerial photos, check the “Ontario Imagery/Air Photos” box at the bottom of the “Layers” list, under the “Background Map and Imagery” group.
- You may need to decrease the transparency of layer groups or uncheck them to see the “Ontario Imagery/Air Photos” layer.
- Some users have experienced issues with this layer not drawing due to secure VPN connections and\or their virus software blocking it.
Navigation
The buttons under the “Navigation” tab allow you to move around the map. You can also create and save bookmarks to use whenever you visit the AgMaps website.
Bookmarks allow you to save the location and zoom level for an area you are viewing so that you can quickly return to it another time.
Create, save and print maps
- Select the “Create Map” button under the “Markup & Printing” tab. A list of different map templates will appear.
- Select the type of map you would like to create.
- Fill in the fields in the left-hand column, then select “Print” or “Export Map”.
- If you select the button to the right of the text “Click on map to get location information”, then select a location on the map, some of the fields in the left-hand column will autofill with location information.
- The system will create a printable map. When the file is ready, select “Open File.” The map will open in a new browser window.
- In the new browser window, you can select to print or save your map.
Add text and draw shapes on your map
Select the down arrow beside the “Point” button under the “Markup & Printing” tab to see all of the tools available.
Identify imagery source information at your cursor location on your map
You can identify the imagery source, add text, determine latitude/longitude coordinates and other functions on your map. Right-click your mouse at the cursor location on your map and select the tool you would like to use from the window that pops open.
Draw field boundaries
- Under the “Markup & Printing” tab, select the drop-down arrow beside the “Point” button and select the “Polygon” tool from the “Markup Tools” drop down box section. You can change the style and colour of your polygon by selecting the “Styles” button that appears to the right of the polygon button after you select it.
- Select a starting point on the map and continue selecting points to add sides to the polygon. You can zoom in and out and pan around without affecting the polygon.
- Double-click the mouse to finish the polygon.
- To make changes to your field boundary, select the “Edit” button, then select the field boundary you've made on your map. You will see circles that you can select and move.
Measure distance or area
- Under the “Layers” tab, select the “Measure Distance” button or use the drop-down arrow beside the “Measure Distance” button and select the “Measure Area” button.
- Use the drop-down arrows that appear when you select either the “Measure Distance” or “Measure Area” button to select the desired unit of measurement. The defaults are “m” (metres) and “m2” (square metres).
- Select a starting point on the map and continue clicking to create, delineate a line or a polygon then double click to finish.
Register for a Premises Identification Number (PID)
To register for a PID through the Provincial Premises Registry, at least one of the following pieces of information is required:
- Assessment Roll Number
- 911 address
- geographic coordinates (such as latitude and longitude)
Obtaining your Assessment Roll Number (ARN)
- Select the “Select Map Layers” button under the “Layers” tab.
- Select the plus sign to expand the “Parcels” list, and then check the box to display the “Provincial Premise Registry” layer.
- Locate your land parcel either through the “Search by Location” function (refer to “Search for your location” section), or by locating your premises manually on the map if you do not know your 911 address or lot and concession.
- Once you have located your parcel of land, select the “Identify” button, to the right of the “Select Map Layers” button, and then select your parcel of land.
- In the window that appears on the left side of the screen, select the Premises Identification Number and a PID number will appear along with its Activity (ACT) Status. “Y” means the PID is active.
- To obtain the geographic coordinates of the Premises, select the “XY” button at the bottom of the map to show “Lat/Long” and place your cursor over your parcel of land to identify the geographic coordinates. You will see that the coordinates change as your cursor moves.
Agriculture and Agri-Food Canada crop inventory legend
Once you’ve selected a sub-layer, or year, you’d like to view, select the “Annual Crop Inventory” link in the bottom right corner of the map and it will open a new browser window. Scroll to the bottom of the page and select “Legend” which is in the “Child Resources” row. In the browser window that opens, you will see a box that contains a couple buttons. Select the “Legend (GET)” button and the crop inventory layer’s legend should appear.
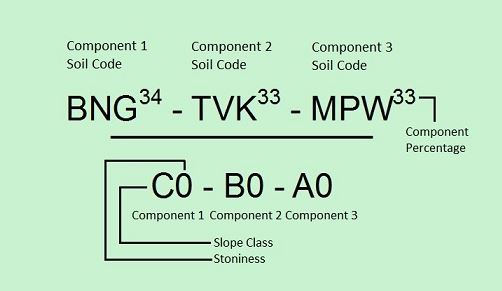
Ontario soil survey complex layer labels outline
The soil name label identifies the name of the soil in the outlined area.
Soil code
A component of the SOILTYPE Soil code was created by the federal government under the Canadian Soil Information Service (CanSIS).
Non-mineral soil codes begin with Z and are as follows:
- ZAL = bottom land
- ZUR = urban
- ZZZ = water
- ZBH = beach
- ZCR = breypen variable
- ZDL = disturbed land
- ZDN = dune
- ZER = eroded channel
- ZES = escarpment
- ZMD = man made
- ZMH = marsh
- ZMK = muck
- ZML = marl
- ZNM = not mapped
- ZOR = organic
- ZPT = peat
- ZQYT = quarry or gravel pit
- ZRD = ridge
- ZRL = rockland
- ZRV = ravine
- ZSC = scarp
- ZST = stream channel/course
- ZUN = unclassified (island)
- ZVC = valley complex
Slope class
A letter designation commonly used in soil surveys symbolizes both the slope magnitude and relative slope length. Each letter (either upper or lower case) represents a range of slope magnitude commonly expressed as a percent. If the letter is uppercase, it represents a simple slope meaning that it is >50 m in length. If the letter is lowercase, it represents a complex slope meaning that it is <50 m in length.
Soil symbol
Soil symbol refers the original map symbol used on original hardcopy soil survey maps. This character symbol is an abbreviation of the soil name. For example, the symbol for TAVISTOCK LOAM is Ta.
Figure 1 shows a three-component soil symbol label. Component percentages are a superscript of the Soil Symbol. In the numerator: Component 1 has soil symbol Wo with component percentage 30, Component 2 has soil symbol Co with component percentage 30 and Component 3 has soil symbol Mr with component percentage 40. In the denominator: Component 1 has a slope class B with stoniness 0, Component 2 has slope class B with stoniness 0 and Component 3 has slope class A with stoniness 0.

Stoniness
Stoniness refers to the occurrence of surface stoniness.
- N = not applicable
- 0 = non-stony
- 1 = slightly stony
- 2 = moderately stony
- 3 = very stony
- 4 = exceedingly stony
- 5 = excessively stony
In Peterborough, Leeds and Grenville rockiness was also included:
- 5 = rockfree
- 6 = slightly rocky
- 7 = moderately rocky
- 8 = very rocky
- 9 = exceedingly rocky
Figure 2 shows a three-component soil symbol label. Component percentages are a superscript of the soil symbol. In the numerator, Component 1 has soil symbol BNG with component percentage 34, Component 2 has soil symbol TVK with component percentage 33 and Component 3 has soil symbol MPW with component percentage 33. In the denominator: Component 1 has a slope class C with stoniness 0, Component 2 has slope class B with stoniness 0 and Component 3 has slope class A with stoniness 0.
Source: Field manual for describing soils in Ontario (Department of Land Resources, University of Guelph, 4th Edition.
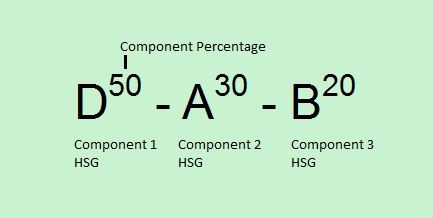
Hydrologic soil group
Hydrologic soil groups are used to estimate runoff from precipitation. Classification of soils by their reference to intake rate of infiltration of water is influenced by texture, organic matter content, stability of the soil aggregates and soil horizon development.
Soils are assigned to one of four groups. They are grouped according to the infiltration of water when the soils are thoroughly saturated.
Class A soils have a high infiltration rate (low runoff potential) when thoroughly wet. These consist mainly of deep, well drained to excessively drained sands or gravelly sands. These soils have a high rate of water transmission.
Class B soils have a moderate infiltration rate when thoroughly wet. These consist chiefly of moderately deep or deep, moderately well drained or well drained soils that have moderately fine texture to moderately coarse texture. These soils have a moderate rate of water transmission.
Class C soils have a slow infiltration rate when thoroughly wet. These consist chiefly of soils having a layer that impedes the downward movement of water or soils of moderately fine texture or fine texture. These soils have a slow rate of water transmission.
Class D soils have a very slow infiltration rate (high runoff potential) when thoroughly wet. They consist mostly of clays that have a high shrink-swell potential, soils that have a permanent high-water table, soils that have a claypan or clay layer at or near the surface, and soils that are shallow over nearly impervious material. These soils have a very slow rate of water transmission.
Figure 3 shows a three-component soil symbol label. Component percentages are a superscript of the Hydrologic Soil Group (HSG). Component 1 has HSG D with component percentage 50, Component 2 has HSG A with component percentage 30 and Component 3 has HSG B with component percentage 20.
Drainage
Drainage classes indicate how well the soil drains. They include:
- VR = very rapidly
- R = rapidly
- W = well
- MW = moderately well
- I = imperfectly
- P = poorly
- VP = very poorly
- WA = water
- VA = variable
Figure 4 shows a three-component soil symbol label. Component percentages are a superscript of the Drainage. Component 1 has Drainage W with component percentage 30, Component 2 has Drainage VP with component percentage 30 and Component 3 has Drainage WA with component percentage 40.

Soil capability for Agriculture (Canada Land Inventory Rating for Soil)
The Canada Land Inventory (CLI) for agriculture is an interpretative system for assessing the effects of climate and soil characteristics on the limitations of land for growing common field crops (corn, soybeans, small grains, forages).
In the CLI rating system there are seven classes. They are:
- Class 1: no significant limitations in use for crops
- Class 2: moderate limitations on use for crops
- Class 3: moderately severe limitations on use for crops
- Class 4: severe limitations on use for crops
- Class 5: very severe limitations preclude annual cultivation; improvements feasible
- Class 6: natural grazing only; no improvements feasible
- Class 7: no capability for agriculture
Additional values include O: Organics, W: Water and 0: not rated (for example, urban land).
Figure 5 shows a three-component soil symbol label. Component percentages are a superscript of the CLI Rating and Limitation Subclasses. Component 1 has CLI Rating 3 and Limitation Subclasses WF with component percentage 60, Component 2 has CLI Rating 3 and Limitation Subclasses DW with component percentage 20 and Component 3 has CLI Rating 4 and Limitation Subclasses DW with component percentage 20.

Source: Classifying Prime and Marginal Agricultural Soils and Landscapes: Guidelines for the Application of the Canada Land Inventory in Ontario.
Surface texture (soil texture)
Soil texture represents the surface or “A” horizon. Soil texture is determined by the relative proportion of sand, silt and clay found in a given soil. The term “texture” refers to the size of the individual soil particles and has nothing to do with the amount of organic matter present in the soil.
Texture descriptions include:
- C = clay
- CL = clay loam
- CSL = coarse sandy loam
- FS = fine sand
- FSL = fine sandy loam
- GL = gravelly loam
- GRAV = gravel
- GS = gravelly sand
- GSL = gravelly sandy loam
- L = loam
- LFS = loamy fine sand
- LS = loamy sand
- LVFS = loamy very fine sand
- ORG = organic
- S = sand
- SIC = silty clay
- SICL = silty clay loam
- SIL = silt loam
- SL = sandy loam
- VFSL = very fine sandy loam
- VAR = variable
Figure 6 shows a three-component soil symbol label. Component percentages are a superscript of the texture. For example, Component 1 has Texture GL with component percentage 60, Component 2 has Texture FSL with component percentage 20 and Component 3 has Texture SL with component percentage 20.

Some soil polygons will have the same attributes for more than one component. These polygons will present a label like the drainage label example in Figure 7. Component 1 has an “R” value representing 50% of the polygon, while the second component takes up 30% and the third component takes up 20%. Both component 2 and component 3 have the same drainage attribute value of a “W” value, so they were combined to represent one value with the combined percentage to show that 50% of the polygon represents a drainage value of “W", even though it consists of two components.

For more information on AgMaps, contact the Geographical Information Services at the Ministry of Agriculture, Food and Rural Affairs (OMAFRA) at omafra.gis@ontario.ca.