10-year trends and annual results
Concentrations of air contaminants measured at the ministry’s Air Quality Health Index air monitoring stations are generally representative of ambient air quality which reflects the contribution of all sources of air contaminants. These air monitoring stations are sited to be representative of general population exposure and thus do not necessarily reflect air quality at locations within a community that may be influenced by nearby local sources of air contaminants such as large industrial facilities or major transportation corridors. Concentrations of some air contaminants in neighborhoods located near local sources such as an industrial facility may be higher than those measured at the ministry’s Air Quality Health Index monitoring stations.
This section presents the 10-year trends and annual results for concentrations of key air contaminants listed below including volatile organic compounds such as benzene, toluene, ethylbenzene and xylene (BTEX) as measured at the ministry’s Air Quality Health Index air monitoring stations. Emission trends for these key air contaminants from major emissions sources in Ontario such as industry, electricity utilities, transportation, and residential properties are also provided. Further details on emissions can be found at Air Pollutant Emission Inventory (APEI) 1990-2023.
Nitrogen dioxide
Highlights
10-year trends
- NO2 concentrations have decreased by 28%
- NOx emissions have decreased by 31%
2023 results
- No exceedances of Ontario’s 1-hour and 24-hour Ambient Air Quality Criteria (AAQC) of 200 ppb and 100 ppb, respectively.
10-year trends
Trend of NO2 annual means across Ontario, 2014-2023
This is a line graph showing the trend of nitrogen dioxide annual means from 2014 to 2023. The nitrogen dioxide annual mean concentrations across Ontario have decreased 28% over this 10-year period. To view the data for a specific location, please select the 'Stations' radio button and use the drop-down menu.
Note:
- The Ontario 10-year trend is based on data from 34 ambient AQHI air monitoring stations.
- Ontario does not have an annual AAQC for NO2.
- Air quality in Ontario can vary from year to year due to a variety of factors including pollutant emissions, weather, natural events such as wildfires, and the long-range transport of air pollutants from the United States and elsewhere. Long term trends are thus a better reflection of any improvements or a deterioration in air quality over time versus year over year changes.
The 10-year trend for NO2 at individual AQHI air monitoring stations in Ontario is presented in the Appendix: 10-year trend for nitrogen dioxide (NO2).
Ontario NOx emission trend, 2014-2023
This is a stacked column chart displaying the Ontario NOX emissions trend from 2014 to 2023 indicating a decrease of approximately 31% or 81 kilotonnes, of which 54 kilotonnes of the decrease was due to the road vehicles. Twelve kilotonnes was due to other transportation (e.g. air, marine, rail transportation, and non-road vehicles/engines) and 6 kilotonnes was due to the electricity utilities sector. Please note this chart excludes emissions from open and natural sources (Air Pollutant Emission Inventory 1990-2023, 2025). Ontario’s former emissions trading regulations (O. Reg. 397/01 and O. Reg. 194/05) and Drive Clean light duty vehicle program, and the phase-in of more stringent emission and vehicle standards for new vehicles have contributed to the reduction in nitrogen oxides emissions over time.
2023 results
| Averaging time | Low range | High range | Number of sites with AAQC exceedances |
|---|---|---|---|
| NO2 1-hour max | 23.7 ppb at Grand Bend | 91.1 ppb at Toronto Downtown | 0 |
| NO2 24-hour max | 7.8 ppb at Parry Sound | 39.8 ppb at Toronto Downtown | 0 |
| NO2 annual mean | 2.0 ppb at Parry Sound | 14.1 ppb at Toronto Downtown | Not applicable |
The highest NO2 means were recorded in large, urbanized areas which are influenced by significant vehicular traffic, such as the Greater Toronto Area.
A summary of the 2023 NO2 annual statistics for individual AQHI air monitoring stations is detailed in the Appendix: 2023 nitrogen dioxide (NO2) annual statistics.
Ontario NOx emissions by sector, 2023
Other transportation
Road vehicles
Miscellaneous/Residential
Other industrial sources
Cement and concrete
Smelters/Primary metals
Electricity utilities
This is a chart depicting Ontario’s NOX emissions by sector based on 2023 estimates for point/area/transportation sources. Please note this chart excludes emissions from open and natural sources (Environment and Climate Change Canada, Air Pollutant Emission Inventory 1990-2023, 2025).
The transportation sector accounted for approximately 54% of total NOx emissions in 2023.
Ontario NOx emissions by census division, 2023
This is a map depicting Ontario’s NOX emissions by census division based on 2023 emission estimates for point/area/transportation sources. Please note this map excludes emissions from natural sources, such as biogenic sources and wildfires.
As seen on the map, census divisions with the highest NOx emissions are those located along the Highway 401 corridor, those with larger cities and urban areas (e.g., Greater Toronto Area and Ottawa), and those that have a higher amount of heavy industry (i.e. near Sarnia, Hamilton, and Sault Ste. Marie).
Fine particulate matter
Highlights
10-year trends
- PM2.5 concentrations have decreased by 12%
- PM2.5 emissions have decreased by 23%
2023 results
- 38 AQHI air monitoring stations measured above the 24-hour reference level of 27 µg/m3 on at least one occasion.
- 19 AQHI air monitoring station measured above the annual reference level of 8.8 µg/m3.
10-year trends
Trend of PM2.5 annual means across Ontario, 2014-2023
This is a line graph showing the trend of fine particulate matter annual means from 2014 to 2023. The fine particulate matter annual mean concentrations across Ontario have decreased 12% over this 10-year period. To view the data for a specific location, please select the 'Stations' radio button and use the drop-down menu.
Note:
- The Ontario 10-year trend is based on data from 37 ambient AQHI air monitoring stations.
- Ontario uses the annual PM2.5 Canadian Ambient Air Quality Standard (CAAQS) “as is” for comparison to a single annual average of air quality data; this value, 8.8 µg/m3, is considered a Reference Level.
- Air quality in Ontario can vary from year to year due to a variety of factors including pollutant emissions, weather, natural events such as wildfires, and the long-range transport of air pollutants from the United States and elsewhere. Long term trends are thus a better reflection of any improvements or a deterioration in air quality over time versus year over year changes.
The wildfire smoke events in 2023 were unprecedented and caused widespread, elevated PM2.5 concentrations across the province. Further information and analyses are provided in Wildfire smoke events in Ontario, 2023.
The 10-year trend for PM2.5 at individual AQHI air monitoring stations in Ontario is presented in the Appendix: 10-year trend for fine particulate matter (PM2.5).
Ontario PM2.5 emission trend, 2014-2023
This is a stacked column chart displaying the Ontario PM2.5 emissions trend from 2014 to 2023 indicating a decrease of approximately 23% or 11 kilotonnes, of which 7 kilotonnes was attributed to reductions in residential wood combustion, 3 kilotonnes was due to the transportation sector (e.g. road vehicles, air, marine, rail transportation, and non-road vehicles/engines), 1 kilotonnes was contributed by various industries, (e.g. smelters, iron and steel, cement). Please note this chart excludes emissions from open and natural sources (Air Pollutant Emission Inventory 1990-2023, 2025).
The phase-in of more stringent emission and vehicle standards for new vehicles, Ontario’s closure of coal burning electricity generating utilities (which decreased secondary particulate formation through a reduction in SO2), and reduced emissions from industrial processes have contributed to the reduction in PM2.5 emissions in Ontario.
2023 results
| Averaging time | Low range | High range | Number of sites with reference level exceedances |
|---|---|---|---|
| PM2.5 1-hour max | 98 µg/m3 at Thunder Bay | 668 µg/m3 at North Bay | Not applicable |
| PM2.5 24-hour max | 33.8 µg/m3 at Thunder Bay | 400.4 µg/m3 at North Bay | 38 |
| PM2.5 annual mean | 6.17 µg/m3 at Thunder Bay | 10.88 µg/m3 at Windsor West | 19 |
A summary of the 2023 PM2.5 annual statistics for individual AQHI air monitoring stations is detailed in the Appendix: 2023 fine particulate matter (PM2.5) annual statistics.
Wildfire smoke events in Ontario, 2023
Wildfires in Canada
Canada has about 9% of the world’s forests. Approximately 8,000 wildfires occur each year in Canada burning on average 2.5 million hectares (ha) per year (Natural Resources Canada, 2025). It’s estimated that 45% of wildfires are caused by lightning strikes, usually in remote areas, and account for 81% of the area burned (Environment and Climate Change Canada, 2020). About 55% of wildfires are caused by human activities, usually in more populated areas and are more likely to be reported and extinguished (World Resources Institute, 2024).
Wildfires occur most frequently in British Columbia, followed by the boreal forest zones of the Prairie provinces, Ontario, Quebec, Yukon and the Northwest Territories. The forest fire perimeters across Canada generally lie within its boreal forest zone.
Maps of Canada’s boreal forest zone and forest fire perimeters
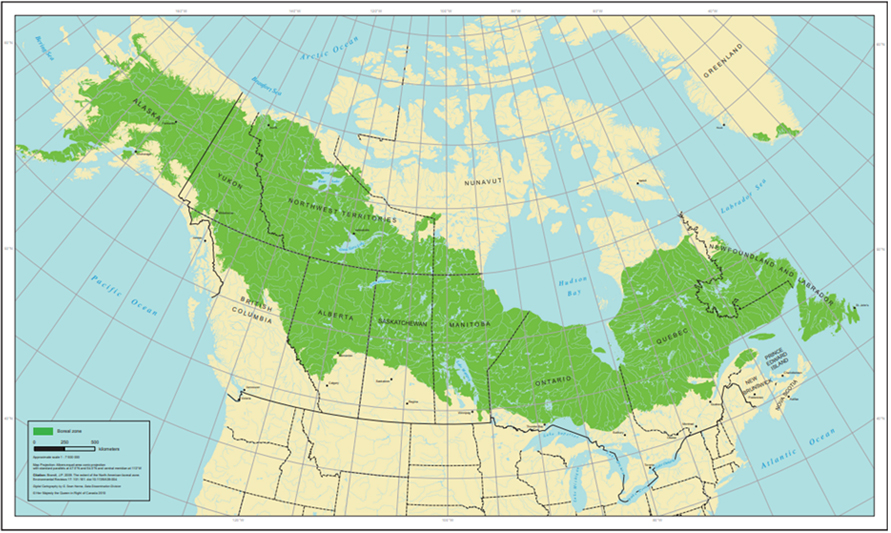
This map presents the boreal forest zone across Canada.
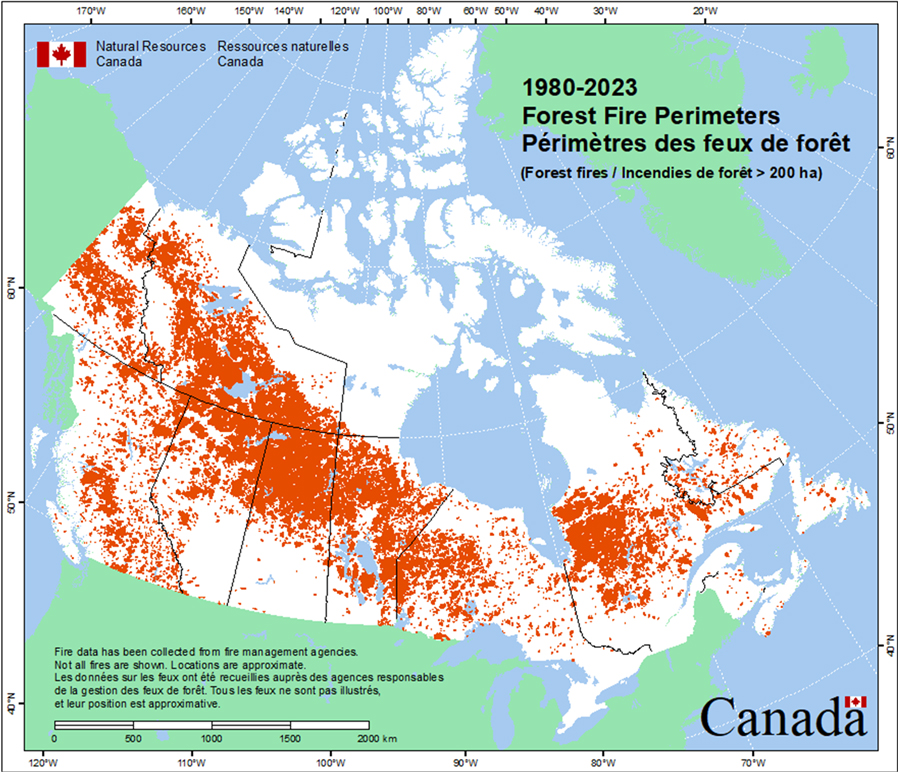
This map presents the forest fire perimeters across Canada from 1980 to 2023
Canadian Wildland Fire Information System | Canadian National Fire Database (CNFDB)
Wildfires are episodic and have a high spatial variability. Three primary factors influence burned areas: fuels, weather conditions, and the topography. Approximately 2.5 million hectares of forest area burn across Canada in a typical year, however, for the unprecedented wildfire season of 2023, approximately 15 million hectares of forest burned across Canada – an area that is roughly the size of the island of Newfoundland.
Wildfire season typically occurs from early April to late October in Ontario. As wildfires burn through forests and grasslands, they produce dense smoke. The hot smoke is lifted several kilometres above the ground and can travel over hundreds or thousands of kilometres from the fire zone (Environment and Climate Change Canada, 2023). Secondary air pollutants, such as fine particulate matter are formed during long-range transport. The smoke can remain aloft, or it can mix down to ground-level. It is challenging to predict when and where wildfires will occur, how big they will be, how much smoke they will generate and what direction the smoke will travel.
Air pollutants in wildfire smoke impact human health and the environment. Fine particulate matter is the key contaminant of concern in wildfire smoke which also contains air pollutants such as black carbon (soot), volatile organic compounds, carbon monoxide and polycyclic aromatic hydrocarbons. Young children, the elderly, and people with pre-existing respiratory diseases (e.g., asthma) and heart problems are most vulnerable to the impacts of wildfire PM2.5. Vulnerability also depends on an individual’s ability to avoid exposure to wildfire smoke.
Wildfire smoke events in Ontario, 2023
In 2023, Ontario issued 13 air quality alerts - Special Air Quality Statements (SAQS) - which covered 55 days. Seven of these SAQS were issued due to forecasts of elevated PM2.5 concentrations from wildfire smoke, accounting for 49 of those 55 days.
Wildfire smoke event, May 29 to June 10
The wildfire smoke event from May 29 to June 10 caused widespread, elevated PM2.5 concentrations across the province with the most intense period of the event occurring from June 5-9. The event was driven by a unique and distinct weather pattern involving a stagnant low-pressure system over the Canadian maritime provinces. This resulted in persistent northeasterly winds directing the smoke from ongoing wildfires burning in Quebec to travel to southern Ontario. The wildfire smoke caused deteriorating air quality and reduced visibility as the smoke descended to the ground. Hazy skies were obvious in some communities as smoke drifted across regions.
Satellite images from June 6, 2023
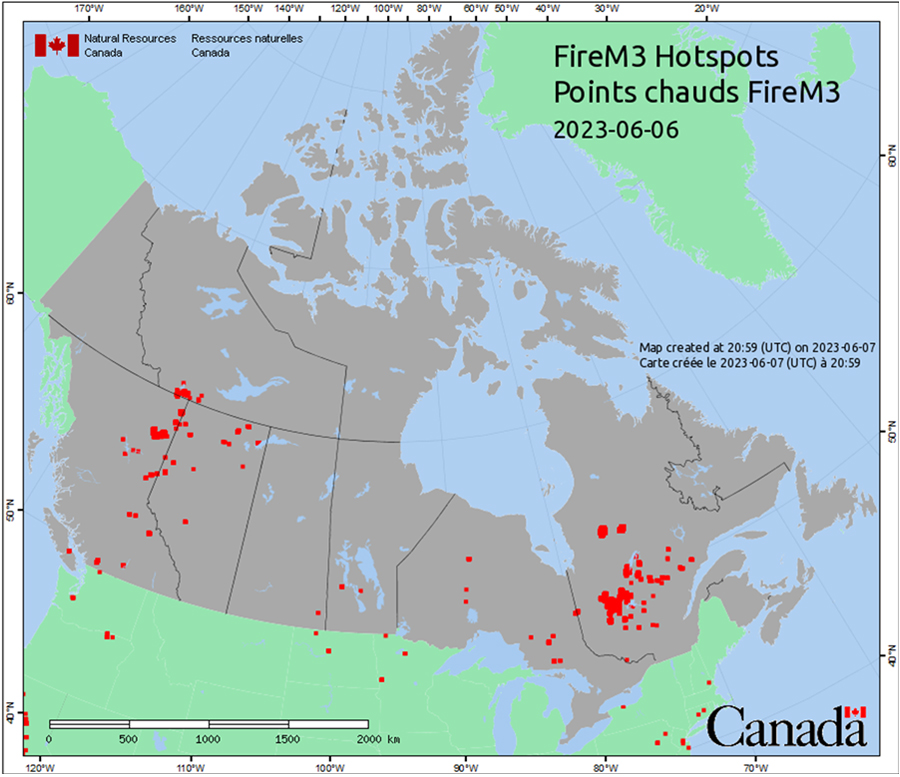
This map indicates heat sources from vegetation fires (e.g., forest, grass, cropland, or logging debris), across Canada, including the areas of Quebec (Natural Resources Canada, 2023).
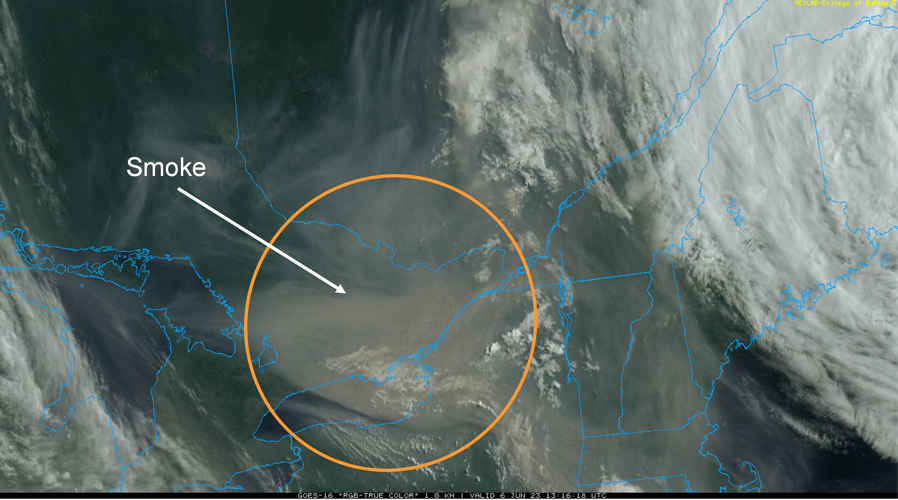
This satellite image shows the grey smoke from the Quebec wildfires over southern Ontario, on June 6, 2023 (NASA Worldview, 2023).
24-hour back trajectory at 500m arriving in Ontario on June 7, 2023
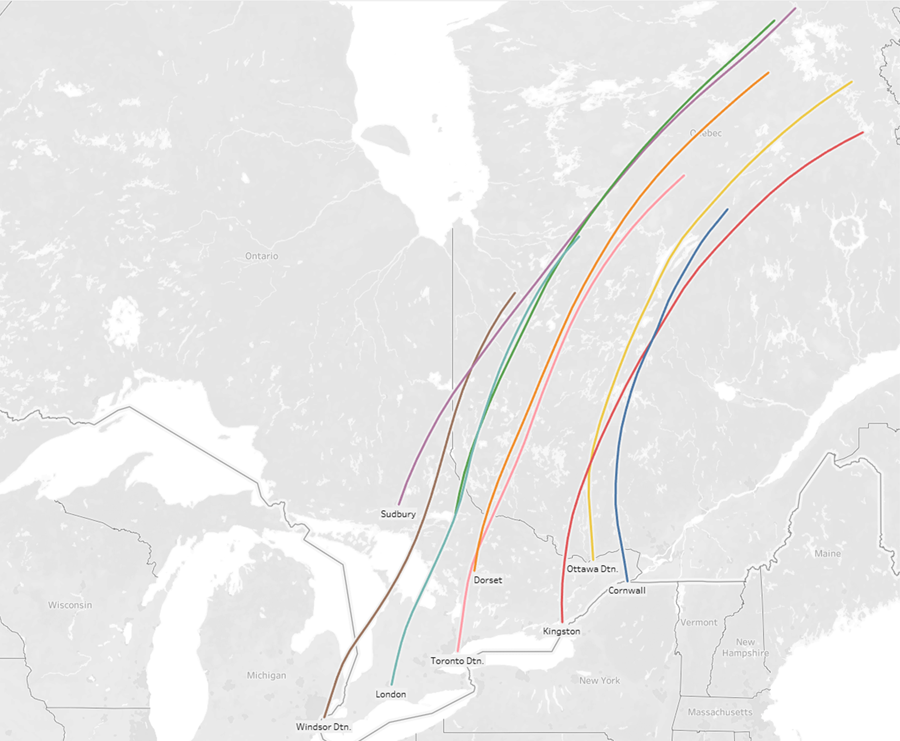
This map is a 24-hour back trajectory analysis at a height of 500 metres which determines the origin of air masses by modelling the path of air backward in time (National Oceanic and Atmospheric Administration, 2023). The back trajectories show that air that arrived in southern Ontario on June 7, 2023, originated and travelled through areas where wildfires were occurring in Quebec.
The smoke plumes from the active fires prompted the issuance of a SAQS for most of the province throughout the event. On June 7, 2023, the Ottawa Downtown AQHI air monitoring station reported the highest 1-hour PM2.5 concentration of 510 µg/m3, while the Kingston AQHI air monitoring station reported the highest 24-hour PM2.5 concentration of 204.1 µg/m3. Thirty-seven AQHI air monitoring stations, including as far south and west as Windsor, exceeded the PM2.5 24-hour Reference Level of 27 µg/m3 during the event due to wildfire smoke.
Maximum PM2.5 concentrations across Ontario, May 29 - June 10, 2023
This is a bar graph showing the maximum fine particulate matter concentrations during the wildfire smoke event from May 29 to June 10, 2023.
Note:
- The Thunder Bay station was temporarily offline during this wildfire smoke event due to technical issues with the PM2.5 monitoring instrument; however, local low-cost non-regulatory air pollution sensors confirmed that the plume did reach this area.
From the evening of June 9 and into June 10, the stationary low-pressure system over the Maritime provinces began to move northeastward towards the Atlantic Ocean. This resulted in a gradual shift to northwesterly winds for Ontario, causing the smoke to move out of the province.
The ministry’s website provides information on air quality alerts and allows users to sign up to receive email notifications when an air quality alert is issued for their forecast region(s) of interest.
Wildfire smoke event, June 11 to July 1
Another wildfire smoke event that caused widespread, elevated PM2.5 concentrations across the province occurred from June 11 to July 1, 2023. The most intense period of the event occurred from June 27 to June 30. Wildfires burning in northern Ontario and in Quebec combined with northerly winds directed the smoke into southern Ontario. The wildfire smoke caused deteriorating air quality and reduced visibility as the smoke descended to the ground. Hazy skies were obvious in some communities as smoke drifted across regions.
Satellite images from June 25, 2023
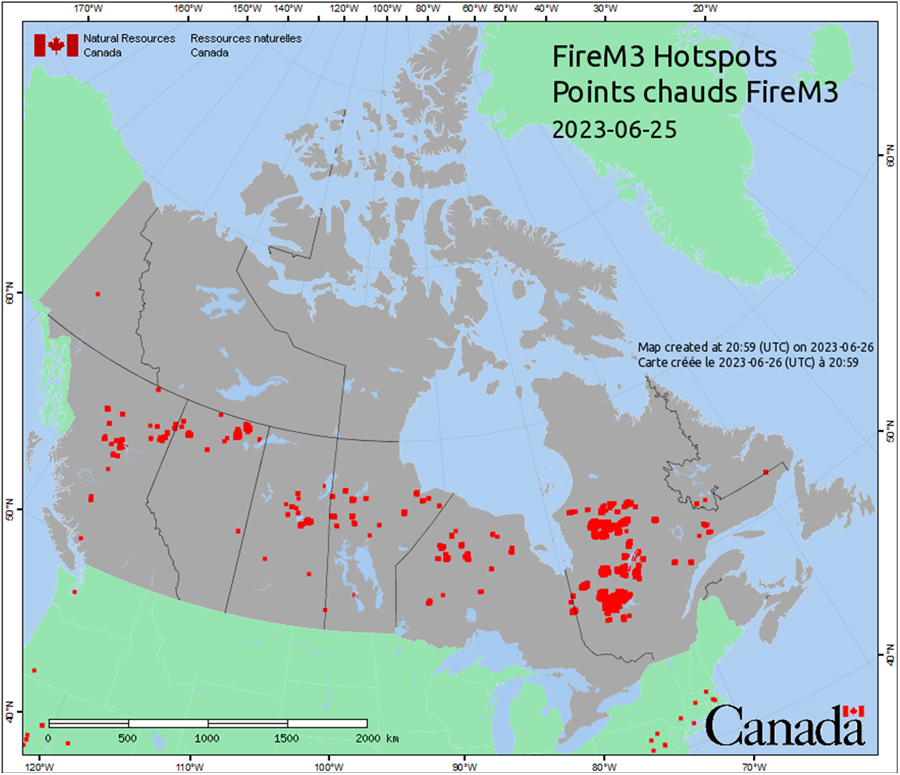
This map indicates heat sources from vegetation fires (e.g., forest, grass, cropland, or logging debris), across Canada, including the areas of Ontario and Quebec (Natural Resources Canada, 2023).
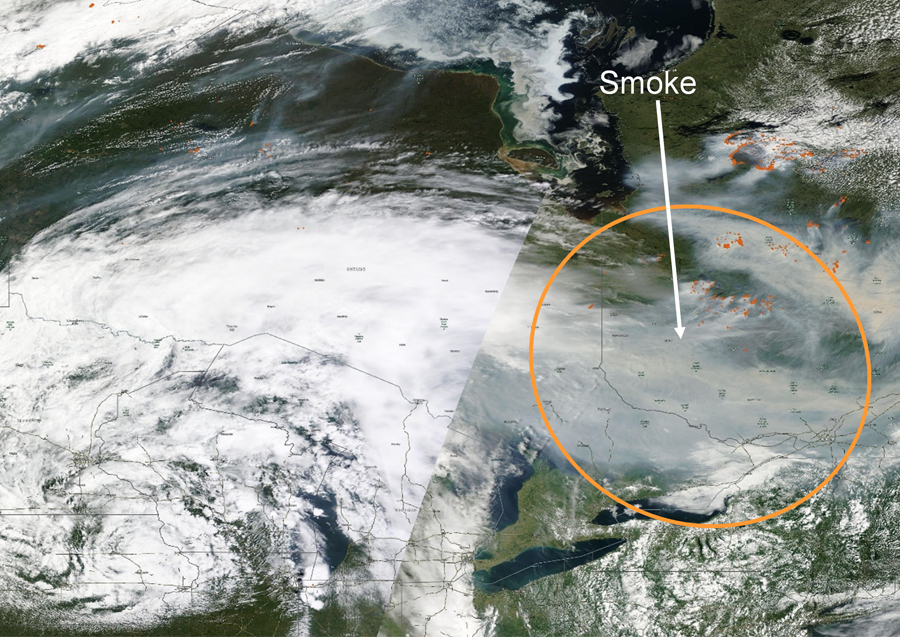
This satellite image shows the grey smoke from the northern Ontario and Quebec wildfires over southern Ontario, on June 25, 2023 (NASA Worldview, 2023).
60-hour back trajectory at 1000m arriving in Ontario on June 28, 2023
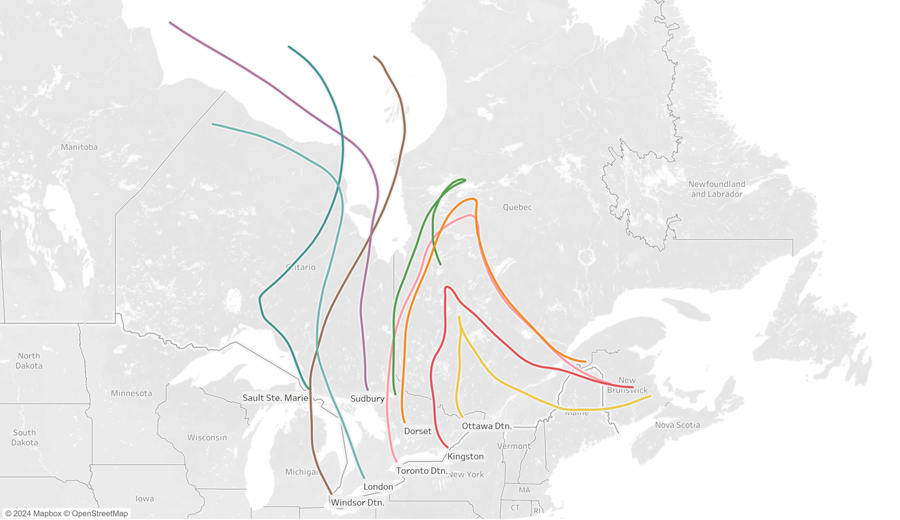
This map is a 60-hour back trajectory analysis at a height of 1,000 metres which determines the origin of air masses by modelling the path of air backward in time (National Oceanic and Atmospheric Administration, 2023). The back trajectories show that air that arrived in southern Ontario on June 28, 2023, originated and travelled through areas where wildfires were occurring in northern Ontario and in Quebec.
The smoke plumes from the active fires prompted the issuance of a SAQS for the entire province throughout the event. On June 25, 2023, the North Bay AQHI air monitoring station reported both the highest 1-hour and 24-hour PM2.5 concentration of 668 µg/m3 and 400.4 µg/m3, respectively. Thirty-seven AQHI air monitoring stations, including as far south and west as Windsor, exceeded the PM2.5 24-hour Reference Level of 27 µg/m3 during the event due to wildfire smoke.
Maximum PM2.5 concentrations across Ontario, June 11 to July 1, 2023
This is a bar graph showing the maximum fine particulate matter concentrations during the wildfire smoke event from June 11 to July 1, 2023.
Note:
- The Thunder Bay station was temporarily offline during this wildfire smoke event due to technical issues with the PM2.5 monitoring instrument; however, local low-cost non-regulatory air pollution sensors confirmed that the plume did reach this area.
On June 30, a low-pressure weather system began to move across the province which led to increased atmospheric mixing and dispersion of pollutants. This, combined with a shift in wind direction, enabled cleaner air to flow throughout the province.
Forecasting wildfire smoke
Predicting the concentration of PM2.5 at ground-level caused by wildfire smoke can be challenging. The height and concentration of PM2.5 within a wildfire smoke plume can vary significantly and depends on the weather conditions. Forecasters use various computer models combined with meteorological observations of smoke or reduced visibility from nearby or upwind weather stations, satellite imagery, data from air monitoring networks, and measurements from non-regulatory air pollution sensors to forecast ground-level PM2.5 concentrations.
Non-regulatory air pollution sensors are an emerging technology designed to detect gases or particles in the air. These sensors are low-cost, portable, and easy to install and operate. However, their measurements generally tend to be less accurate and precise compared to the monitors used in compliance and air quality monitoring networks. Despite this, they are often sufficient for screening-level activities, such as identifying hotspots, as well as for educational purposes or qualitative personal monitoring. Additionally, these sensors can fill monitoring gaps and help ground truth model results. Air quality forecasters leverage sensor data to assist in air quality predictions and guide decisions on issuing air quality alerts in remote areas.
Ontario PM2.5 emissions by sector, 2023
Residential
Miscellaneous
Other industrial sources
Smelters/Primary metals
Other transportation
Cement and concrete
Road vehicles
This is a chart depicting Ontario’s PM2.5 emissions by sector based on 2023 estimates for point/area/transportation sources. Please note this chart excludes emissions from open and natural sources, such as wildfires (Environment and Climate Change Canada, Air Pollutant Emission Inventory 1990-2023, 2025).
Residential fuel combustion accounted for approximately 28% of the total PM2.5 emissions in 2023. The major contributor to residential emissions is fuel wood combustion in fireplaces and wood stoves.
PM2.5 emissions from wildfires vary from year to year and generally depend on the total number of hectares burned. Wildfire season typically occurs from early April to late October in Ontario. As wildfires burn through forests and grasslands, they produce dense smoke. Wildfire smoke may be carried hundreds or thousands of kilometres from the fire zone.
Ontario PM2.5 emissions by census division, 2023
This is a map depicting Ontario’s PM2.5 emissions by census division based on 2023 emission estimates for point/area/transportation sources. Please note this map excludes emissions from natural sources, such as biogenic sources and wildfires.
As seen on the map, census divisions with the highest PM2.5 emissions are those in Ontario’s Far North, partly due to higher residential wood combustion and winter snowmobile use in comparison to southern Ontario, but also in large measure due to emissions of fugitive dust from unpaved roadways. There are also several southern Ontario census divisions with significant PM2.5 emissions due to heavy industry (i.e. near Sarnia, Nanticoke, etc.).
Note that many of the census divisions in northern Ontario are considerably larger in size than those in southern Ontario. Because of this the total census division-level PM2.5 emissions appear to be significant across much larger areas in the north. However, when the emissions are viewed on a finer scale (i.e., by grid instead of census division), the majority are concentrated in local urban centers (i.e., Dryden and Kenora) and other communities located along the north shore of Lake Superior.
Ground-level ozone
Highlights
10-year trends
- No trend in the ozone maximum concentrations
- No trends in the ozone annual and summer means
- Ozone winter means increased by 6%
2023 results
- 20 AQHI air monitoring stations measured ozone levels above the 1-hour AAQC of 80 ppb on at least one occasion.
10-year trends
Trend of ozone maximums across Ontario, 2014-2023
This is a line graph showing the trend of ozone one-hour maximums from 2014 to 2023. There was no trend detected for Ontario over this 10-year period. To view the data for a specific location, please select the 'Stations' radio button and use the drop-down menu.
Note:
- The Ontario 10-year trend is based on data from 37 ambient AQHI air monitoring stations.
- The Ontario one-hour AAQC for ozone is 80 ppb.
- The 10-year trend of one-hour maximum ozone for individual AQHI air monitoring stations in Ontario is presented in the Appendix: 10-year trend for ozone (O3) maximums.
Trend of ozone means across Ontario, 2014-2023
This is a line graph showing the trend of ozone annual, summer and winter means from 2014 to 2023. There were no trends detected in the ozone annual and summer means for Ontario over this 10-year period, however, the winter ozone means increased by 6%. To view the data for a specific location, please select the 'Stations' radio button and use the drop-down menu.
Note:
- The Ontario 10-year trend is based on data from 37 ambient AQHI air monitoring stations.
- Summer: May - September; Winter: January - April, October - December.
- Ontario does not have an annual or seasonal AAQC for ozone.
- Air quality in Ontario can vary from year to year due to a variety of factors including pollutant emissions, weather, natural events such as wildfires, and the long-range transport of air pollutants from the United States and elsewhere. Long term trends are thus a better reflection of any improvements or a deterioration in air quality over time versus year over year changes.
There has been no increasing or decreasing trend in annual and summer ozone means over the past 10 years. The increase in the ozone winter means can be mainly attributed to rising global background concentrations and reduced scavenging effect (Xu et. al., 2019).
Ozone levels continue to exceed Ontario’s 1-hour AAQC for ozone during the warmer months and remain a challenge in some areas of the province, such as southwestern Ontario. However, ozone concentrations during the winter months were well below Ontario’s ozone 1-hour AAQC of 80 ppb across Ontario in 2023.
The 10-year trend of annual, summer and winter ozone for individual AQHI air monitoring stations in Ontario is presented in the Appendix: 10-year trend for ozone (O3), 10-year trend for ozone (O3) summer means, and 10-year trend for ozone (O3) winter means.
Ozone annual means for urban and rural Ontario, 2014-2023
This is a line graph displaying the ozone annual means for urban and rural Ontario from 2014 to 2023.
Note:
- Urban S. are urban areas in southern Ontario - Windsor, London, Hamilton, Toronto.
- Urban N. are urban areas in northern Ontario - Thunder Bay, Sault Ste. Marie, Sudbury, North Bay.
- Rural areas in Ontario - Port Stanley, Tiverton, Parry Sound, Dorset.
- Ontario does not have an annual AAQC for ozone.
Ozone annual mean concentrations in urban areas in southern Ontario have been more comparable to those of urban areas in northern Ontario in recent years.
Generally, ozone concentrations are higher in rural, transboundary-influenced sites on the northern shore of Lake Erie and the eastern shore of Lake Huron. Ozone concentrations are lower in urban areas because it is depleted (scavenged) by reacting with NO emitted by vehicles and other local combustion sources.
2023 results
| Averaging time | Low range | High range | Number of sites with AAQC exceedances |
|---|---|---|---|
| Ozone 1-hour max | 64 ppb at Thunder Bay | 98 ppb at Belleville | 20 |
| Ozone 24-hour max | 46.5 ppb at Toronto West | 59.8 ppb at Sarnia | Not applicable |
| Ozone annual mean | 22.6 ppb at Toronto West | 32.2 ppb at Tiverton | Not applicable |
A summary of the 2023 ozone annual statistics for individual AQHI air monitoring stations is detailed in the Appendix: 2023 ozone (O3) annual statistics.
Sulphur dioxide
Highlights
10-year trends
- SO2 concentrations have decreased by 42%
- SO2 emissions have decreased by 62%
2023 results
- Four AQHI air monitoring stations measured sulphur dioxide levels above the 10-minute AAQC of 67 ppb on at least one occasion.
- Four AQHI air monitoring stations measured sulphur dioxide levels above the 1-hour AAQC of 40 ppb on at least one occasion.
- No exceedances of Ontario’s annual AAQC.
10-year trends
Trend of SO2 annual means across Ontario, 2014-2023
This is a line graph showing the trend of sulphur dioxide annual means from 2014 to 2023. The sulphur dioxide annual mean concentrations across Ontario have decreased 42% over this 10-year period. To view the data for a specific location, please select the 'Stations' radio button and use the drop-down menu.
Note:
- The Ontario 10-year trend is based on data from 8 ambient AQHI air monitoring stations.
- The Ontario annual AAQC for SO2 of 4 ppb was introduced in 2018.
- Air quality in Ontario can vary from year to year due to a variety of factors including pollutant emissions, weather, natural events such as wildfires, and the long-range transport of air pollutants from the United States and elsewhere. Long term trends are thus a better reflection of any improvements or a deterioration in air quality over time versus year over year changes.
The 10-year trend for SO2 at individual AQHI air monitoring stations in Ontario is presented in the Appendix: 10-year trend for sulphur dioxide (SO2).
Ontario SO2 emission trend, 2014-2023
This is a stacked column chart displaying the Ontario SO2 emissions trend from 2014 to 2023 indicating a decrease of approximately 62% or 158 kilotonnes, of which 140 kilotonnes of the decrease was due to the smelter sector and 6 kilotonnes was due to the petroleum refineries sector. The electricity utilities sector accounted for less than 1 kilotonnes and may not be visibly displayed on the chart. Please note this chart excludes emissions from open and natural sources (Air Pollutant Emission Inventory 1990-2023, 2025).
Emissions reductions at Ontario smelters through the implementation of site-specific standards under the Local Air Quality Regulation (O. Reg. 419/05) and the sector specific smelter regulation (O. Reg. 652/21), Ontario’s closure of coal burning electricity generating utilities, Ontario’s former emissions trading regulations (O. Reg. 397/01 and O. Reg. 194/05), the introduction of new requirements for petroleum refineries (O. Reg. 88/21 and 89/21), and federal and provincial low sulphur content in transportation fuels have contributed to the reduction in SO2 emissions in Ontario.
2023 results
| Averaging time | Low range | High range | Number of sites with AAQC exceedances |
|---|---|---|---|
| SO2 10-minute max | 8.0 ppb at Toronto West | 208.2 ppb at Sudbury | 4 |
| SO2 1-hour max | 5.7 ppb at Toronto North | 111.1 ppb at Hamilton Downtown | 4 |
| SO2 24-hour max | 1.2 ppb at Toronto North | 30.5 ppb at Hamilton Mountain | Not applicable |
| SO2 annual mean | 0.12 ppb at Toronto North | 3.39 ppb at Hamilton Downtown | 0 |
Concentrations of sulphur dioxide in neighborhoods that are located in close proximity to local sources such as an industrial facility may be higher than those measured at the ministry’s AQHI monitoring stations which are sited to be representative of general population exposure.
A summary of the 2023 SO2 annual statistics for individual AQHI air monitoring stations is detailed in the Appendix: 2023 sulphur dioxide (SO2) annual statistics.
There are local air quality monitoring networks operated by industrial associations in the communities of Hamilton (Hamilton Air Monitoring Network), Sarnia (Clean Air Sarnia and Are) and Sudbury (Greater Sudbury Air Quality) that provide additional air quality information for these communities. These data have not been integrated into this ministry report; however, they are being addressed with regulations which aim to decrease local concentrations of SO2, namely O. Reg. 88/22 which addresses SO2 emissions from the petroleum refining sector and O. Reg. 65/21 which addresses SO2 emissions from nickel smelting facilities, which are located primarily in the Sudbury area.
Ontario SO2 emissions by sector, 2023
Smelters
Petroleum refineries
Other industrial sources
Iron and steel
Cement and concrete
Miscellaneous/Residential
Transportation
This is a chart depicting Ontario’s sulphur dioxide emissions by sector based on 2023 estimates for point/area/transportation sources. Please note this chart excludes emissions from open and natural sources (Environment and Climate Change Canada, Air Pollutant Emission Inventory 1990-2023, 2025).
Although they have achieved significant reductions in the past several years, smelters in northern Ontario remain the major sources of SO2 emissions in Ontario, accounting for approximately 45% of the provincial SO2 emissions.
Ontario SO2 emissions by census division, 2023
This is a map depicting Ontario’s sulphur dioxide emissions by census division based on 2023 emission estimates for point/area/transportation sources. Please note this map excludes emissions from natural sources, such as biogenic sources and wildfires.
As noted previously, industrial sources are the highest emitters of SO2. The map shows that census divisions with the highest SO2 emissions are those near Sarnia, Hamilton, Sudbury and Sault Ste. Marie which all have industrial facilities in the petroleum refining, steel production, and base metal smelting sectors.
Volatile organic compounds
Volatile organic compounds (VOC) are measured at select ambient air monitoring stations across Ontario as part of a co-operative federal-provincial program under the National Air Pollution Surveillance program.
Note: No VOC samples were collected in 2020 and only limited VOC samples were collected in 2021 and 2022 due to COVID-19 measures put in place by Environment and Climate Change Canada’s laboratories following Public Health guidelines. As a result, only three of six AQHI air monitoring stations were operational for VOC monitoring in 2021 and 2022. All six stations were operational in 2023.
Highlights
10-year trends
- Benzene concentrations have decreased by 30%
- Toluene concentrations have decreased by 51%
- Ethylbenzene concentrations have decreased by 48%
- m- and p-xylene concentrations have decreased by 46%
- No trend available for o-xylene concentrations
- No trend available for 1,3-butadiene concentrations
2023 results
- Ontario’s AAQC for these volatile organic compounds (where applicable) were met except for one AQHI air monitoring station that measured benzene levels above the 24-hour AAQC of 2.3 µg/m3 and two AQHI air monitoring stations that measured benzene above the annual AAQC of 0.45 µg/m3.
10-year trends
VOCs are measured at six AQHI air monitoring stations (Windsor West, Sarnia, London, Kitchener, Hamilton Downtown, and Newmarket), however only three (Windsor West, Sarnia and Hamilton Downtown) were operational for VOC monitoring in 2021 and 2022 due to COVID-19 measures put in place following Public Health guidelines.
In 2023, 107 VOCs were analyzed and reported for each sample at each site. For the purposes of this report, commonly detected VOCs (benzene, toluene, ethylbenzene, xylene and 1,3-butadiene) between 2014 and 2023 are included in this discussion.
As a reporting guideline for 10-year trends,
- a valid reporting year requires at least 50% of the concentrations to be above the method detection limit; and
- a provincial 10-year trend for VOCs requires at least seven valid reporting years for at least 50% of the reporting stations.
Trend of benzene annual means across Ontario, 2014-2023
This is a line graph showing the trend of benzene annual means from 2014 to 2023. The benzene annual mean concentrations across Ontario have decreased 30% over this 10-year period. To view the data for a specific location, please select the 'Stations' radio button and use the drop-down menu.
Note:
- The Ontario 10-year trend is based on data from 6 ambient AQHI air monitoring stations.
- The 2021 and 2022 averages are based on 3 ambient AQHI air monitoring stations.
- VOC samples were not collected in 2020 as Environment and Climate Change Canada’s laboratories were shut down due to COVID-19 measures put in place following Public Health guidelines.
- The Ontario annual AAQC for benzene of 0.45 µg/m3 was introduced in 2016.
- Air quality in Ontario can vary from year to year due to a variety of factors including pollutant emissions, weather, natural events such as wildfires, and the long-range transport of air pollutants from the United States and elsewhere. Long term trends are thus a better reflection of any improvements or a deterioration in air quality over time versus year over year changes.
Trend of toluene annual means across Ontario, 2014-2023
This is a line graph showing the trend of toluene annual means from 2014 to 2023. The toluene annual mean concentrations across Ontario have decreased 51% over this 10-year period. To view the data for a specific location, please select the 'Stations' radio button and use the drop-down menu.
Note:
- The Ontario 10-year trend is based on data from 6 ambient AQHI air monitoring stations.
- The 2021 and 2022 averages are based on 3 ambient AQHI air monitoring stations.
- VOC samples were not collected in 2020 as Environment and Climate Change Canada’s laboratories were shut down due to COVID-19 measures put in place following Public Health guidelines.
- Ontario does not have an annual AAQC for toluene.
- Air quality in Ontario can vary from year to year due to a variety of factors including pollutant emissions, weather, natural events such as wildfires, and the long-range transport of air pollutants from the United States and elsewhere. Long term trends are thus a better reflection of any improvements or a deterioration in air quality over time versus year over year changes.
Trend of ethylbenzene annual means across Ontario, 2014-2023
This is a line graph showing the trend of ethylbenzene annual means from 2014 to 2023. The ethylbenzene annual mean concentrations across Ontario have decreased 48% over this 10-year period. To view the data for a specific location, please select the 'Stations' radio button and use the drop-down menu.
Note:
- The Ontario 10-year trend is based on data from 6 ambient AQHI air monitoring stations.
- The reporting guidelines for a valid annual mean across Ontario were not met in 2023.
- The 2021 and 2022 averages are based on 3 ambient AQHI air monitoring stations.
- VOC samples were not collected in 2020 as Environment and Climate Change Canada’s laboratories were shut down due to COVID-19 measures put in place following Public Health guidelines.
- Ontario does not have an annual AAQC for ethylbenzene.
- Air quality in Ontario can vary from year to year due to a variety of factors including pollutant emissions, weather, natural events such as wildfires, and the long-range transport of air pollutants from the United States and elsewhere. Long term trends are thus a better reflection of any improvements or a deterioration in air quality over time versus year over year changes.
Trend of m- and p-xylene annual means across Ontario, 2014-2023
This is a line graph showing the trend of m-, and p-xylene annual means from 2014 to 2023. The m- and p-xylene annual mean concentrations across Ontario have decreased 46% over this 10-year period. To view the data for a specific location, please select the 'Stations' radio button and use the drop-down menu.
Note:
- The Ontario 10-year trend is based on data from 6 ambient AQHI air monitoring stations.
- The 2021 and 2022 averages are based on 3 ambient AQHI air monitoring stations.
- VOC samples were not collected in 2020 as Environment and Climate Change Canada’s laboratories were shut down due to COVID-19 measures put in place following Public Health guidelines.
- Ontario does not have an annual AAQC for m-, p-xylene.
- Air quality in Ontario can vary from year to year due to a variety of factors including pollutant emissions, weather, natural events such as wildfires, and the long-range transport of air pollutants from the United States and elsewhere. Long term trends are thus a better reflection of any improvements or a deterioration in air quality over time versus year over year changes.
There is no reporting trend for o-xylene and 1,3-butadiene since the reporting guidelines for a valid annual mean trend across Ontario were not met.
The 10-year trend for VOCs at individual AQHI air monitoring stations in Ontario is presented in the Appendix: 10-year trend for benzene, 10-year trend for toluene, 10-year trend for ethylbenzene, and 10-year trend for m- and p-xylene, 10-year trend for o-xylene and 10-year trend for 1,3-butadiene.
Ontario VOC emission trend, 2014-2023
This is a stacked column chart displaying the Ontario VOC emissions trend from 2014 to 2023 indicating a decrease of approximately 23% or 75 kilotonnes, of which 37 kilotonnes was due to the transportation sector and 31 kilotonnes was due to the solvent use, surface coating and printing sectors. Please note this chart excludes emissions from open and natural sources (Environment and Climate Change Canada, Air Pollutant Emission Inventory 1990-2023, 2025).
The introduction of more stringent federal vehicle and engine emission standards for new vehicles, the former Drive Clean light duty vehicle program and various regulations, and Canadian Council of Ministers of the Environment VOC emissions guidelines and codes of practice for VOC emitting products and materials have contributed to the reduction in VOC emissions in Ontario.
2023 results
| Averaging time | Low range | High range | Number of sites with AAQC exceedances |
|---|---|---|---|
| Benzene 24-hour max | 0.958 µg/m3 at Kitchener | 2.350 µg/m3 at Sarnia | 1 |
| Benzene annual mean | 0.323 µg/m3 at Newmarket | 0.565 µg/m3 at Sarnia | 2 |
| Toluene 24-hour max | 2.528 µg/m3 at London | 9.354 µg/m3 at Windsor West | 0 |
| Toluene annual mean | 0.463 µg/m3 at Newmarket | 1.377 µg/m3 at Windsor West | Not applicable |
| Ethylbenzene 24-hour max | 0.328 µg/m3 at London | 1.152 µg/m3 at Sarnia | 0 |
| Ethylbenzene annual mean | 0.075 µg/m3 at Newmarket | 0.159 µg/m3 at Sarnia | Not applicable |
| m- and p-xylene 24-hour max | 1.110 µg/m3 at London | 2.216 µg/m3 at Sarnia | 0 |
| m- and p-xylene annual mean | 0.190 µg/m3 at Newmarket | 0.394 µg/m3 at Windsor West | Not applicable |
| o-xylene 24-hour max | 0.390 µg/m3 at London | 0.754 µg/m3 at Sarnia | 0 |
| o-xylene annual mean | 0.074 µg/m3 at Newmarket | 0.157 µg/m3 at Windsor West | Not applicable |
| 1,3-butadiene 24-hour max | 0.050 µg/m3 at Windsor West, London, Hamilton Downtown and Newmarket | 1.932 µg/m3 at Sarnia | 0 |
| 1,3-butadiene annual mean | 0.050 µg/m3 at Windsor West, London, and Newmarket | 0.126 µg/m3 at Sarnia | 0 |
Concentrations of some VOCs in neighborhoods that are located in close proximity to local sources such as an industrial facility may be higher than those measured at the ministry’s AQHI monitoring stations which are sited to be representative of general population exposure.
There are local air quality monitoring networks operated by industrial associations in the communities of Hamilton (Hamilton Air Monitoring Network) and Sarnia (Clean Air Sarnia and Area) that provide additional air quality information for these communities. These data have not been integrated into this ministry report; however, they are being addressed with regulations and requirements which aim to decrease local concentrations of VOCs including benzene.
There are also requirements that require certain facilities to conduct property line monitoring of benzene and publicly report it. For example, the Sarnia (CASA) website provides links to facility property line monitoring data. The property line monitoring concentration may be higher than those measured at the ministry’s AQHI monitoring stations which are sited to be representative of general population exposure.
A summary of the 2023 VOCs annual statistics for individual AQHI air monitoring stations is detailed in the Appendix: 2023 benzene annual statistics, 2023 toluene annual statistics, 2023 ethylbenzene annual statistics, 2023 m- and p-xylene annual statistics, 2023 o-xylene annual statistics and 2023 1,3-butadiene annual statistics.
Ontario VOC emissions by sector, 2023
General solvent use
Industrial
Printing/Surface coating
Other transportation
Miscellaneous
Road vehicles
Residential
This is a chart depicting Ontario’s VOC emissions by sector based on 2023 estimates for point/area/transportation sources. Please note this chart excludes emissions from open and natural sources (Environment and Climate Change Canada, Air Pollutant Emission Inventory 1990-2023, 2025).
General solvent use (e.g., degreasing, adhesives and sealants, consumer and commercial products) accounted for 28% of VOC emissions in 2023; and transportation sector accounted for 22% (Air Pollutant Emission Inventory 1990-2023, 2025).
Ontario VOC emissions by census division, 2023
This is a map depicting Ontario’s VOC emissions by census division based on 2023 emission estimates for point/area/transportation sources. Please note this map excludes emissions from natural sources, such as biogenic sources and wildfires.
As seen on the map, census divisions with the highest VOC emissions are located in urbanized areas of southern Ontario which is expected due to the extent of general solvent use (typically for cleaning and degreasing at commercial facilities), production in industrial facilities and printing/surface coating applications in this area. Census divisions in Ontario’s Far North also have relatively high emissions due to high snowmobile use during the winter months in comparison to areas in southern Ontario.
Note that many of the census divisions in northern Ontario are considerably larger in size than those in southern Ontario. Because of this the total census division-level VOC emissions appear to be significant across much larger areas in the north. However, when the emissions are viewed on a finer scale, the majority are concentrated in local urban centers such as Dryden, Thunder Bay and Sault Ste. Marie.
Ontario Ambient Air Quality Criteria
Ambient air quality refers to general air quality resulting from all sources of contaminants to air. Ambient Air Quality Criteria (AAQC) are a concentration of a contaminant in air that is protective against adverse effects on health and/or the environment.
AAQC are not regulatory values but are used to assess general (ambient) air quality resulting from all sources (i.e., industrial and non-industrial sources) of a contaminant to air. AAQC are most commonly used in environmental assessments, special studies using ambient air monitoring data, assessment of general air quality in a community and annual reporting on air quality across the province.
| Contaminant | 10-minute AAQC Assesses protection against acute effects | 1-hour AAQC Assesses protection against acute effects | 8-hour AAQC Assesses protection against acute effects | 24-hour AAQC Assesses protection against chronic effects | Annual AAQC Assesses protection against chronic effects |
|---|---|---|---|---|---|
| NO2 | N/A | 200 ppb | N/A | 100 ppb | N/A |
| PM2.5 | N/A | N/A | N/A | 27 μg/m3 | 8.8 μg/m3 |
| O3 | N/A | 80 ppb | N/A | N/A | N/A |
| SO2 | 67 ppb | 40 ppb | N/A | N/A | 4 ppb |
| CO | N/A | 30 ppm | 13 ppm | N/A | N/A |
| Benzene | N/A | N/A | N/A | 2.3 μg/m3 | 0.45 μg/m3 |
| Toluene | N/A | N/A | N/A | 2,000 μg/m3 | N/A |
| Ethylbenzene | 1,900 μg/m3 | N/A | N/A | 1,000 μg/m3 | N/A |
| Xylene | 3,000 μg/m3 | N/A | N/A | 730 μg/m3 | N/A |
| 1,3-Butadiene | N/A | N/A | N/A | 10 μg/m3 | 2 μg/m3 |
| Manganese in PM2.5 | N/A | N/A | N/A | 0.1 μg/m3 | N/A |
Notes:
- ppb – parts (of contaminant) per billion (parts of air) – by volume.
- μg/m3 – micrograms (of contaminant) per cubic metre (of air) – by weight.
- ppm – parts (of contaminant) per million (parts of air) – by volume.
Footnotes
- footnote[1] Back to paragraph Ontario uses the 24-hour PM2.5 CAAQS “as is” for comparison to the 24-hour measurement of air quality data; this value is considered a Reference Level.
- footnote[2] Back to paragraph Ontario uses the annual PM2.5 CAAQS “as is” for comparison to a single annual average of air quality data; this value is considered a Reference Level.
- footnote[3] Back to paragraph Based on odour.