NORDIC index netting manual
Manual of Instructions and Provincial Biodiversity Benchmark Values
April 2005
Ministry of Natural Resources
George E. Morgan and Ed Snucins
Cooperative Freshwater Ecology Unit
Department of Biology
Laurentian University
Sudbury, Ontario P3E 2C6
Phone number:
Fax number:
E-mail: gmorgan@laurentian.ca
Cette publication spécialisée n’est disponsible qu’en anglais
Single copies of this publication are available at no charge from the address noted below. Bulk orders may involve charges.
Ontario Ministry of Natural Resources
Fish and Wildlife Branch
P.O. Box 7000
300 Water Street
Peterborough, ON K9J 8M5
1.0 Introduction
The main objectives of any fish community index netting survey are:
- to characterize the diversity of the entire fish assemblage,
- to assess the relative abundance/biomass of the various fish species, and
- to provide other biological measures or indicators of the populations status (such as size structure).
This manual describes a standardised method for sampling fish in lakes with multi-mesh gillnets and discusses some biomass and biodiversity benchmark values. These benchmarks should help fisheries managers compare their Nordic results to other lakes in Ontario. The Nordic method provides a whole-lake estimate for species occurrence, quantitative relative abundance and biomass (Appelberg 2000). The Nordic method is an international standard gillnetting procedure for monitoring programmes in many Scandinavian countries (Finland, Norway, and Sweden with nearly 2000 lakes now sampled). The method is intended for sampling fish populations in lakes of various sizes. In this manual, gear specifications, recommendations for gear deployment, a framework for selecting sampling locations and determining sample size requirements, procedures for processing fish samples, and procedures for data entry in Fishnet 2.0 are included.
The most important thing to remember when deciding to use the Nordic method is that the specified standard requirements must be followed to allow comparison of results to other surveys and established benchmarks. If the minimum standard cannot be achieved then the survey should not be conducted.
2.0 Survey design and methods
The Nordic method utilizes a stratified random sampling design in which the individual sampling units are selected without replacement. The number of strata and the number of nets set within each stratum are determined by the lakes surfacearea (in hectares) and maximumdepth (in metres). Once the number of nets sets within each depth stratum is determined, the location and angle of each gillnet in relation to shoreline contours is randomised. Thus each gillnet will act as an independent sample of the fish community. The selection of sampling sites is done randomly to minimize bias in locating sites and setting gear. Sites must not be substituted without a substantial reason (e.g.., water too shallow or too deep, areas with high shoreline development, impeding boat traffic, unsuitable topography, etc.). Randomising the selection of sample sites is essentially a map exercise that is completed in the office by using a depth map, co-ordinate grid, and a random number table to select specific sites.
2.1 Sampling methods
The standard Nordic sampling methods are summarized in Table 1. The sampling window begins in the last week of June and extends until the second week of September. Sampling either starts once a lakes epilimnetic temperature has reached 15°C or has started to thermally stratify, or July 1st, whichever occurs first. Sampling ends once the lakes begin to de-stratify or epilimnetic temperature drops below 15°C (and well before fall turnover). The Nordic sampling period is 10 to 12 weeks.
The multi-mesh Nordic net is made up of 12 panels of different size mesh, ranging from 5mm to 55mm knot-to-knot in a standard randomised order. The mesh-sizes follow a geometric series according to Jensen (1986), with an average 1.25 ratio between mesh sizes. At each site, one gillnet gang is set randomly to shore contour between 1800 and 2000 hours, left to fish overnight, and lifted between 0600 and 0800 hours the next morning. The target is a 12 hour set with fishing times of 10.5 to 13.5 hours being within the acceptable range. The number of sites which can be sampled in a day will depend on catch size, daily travel time to the lake, lake size and shape, crew experience, and fish sampling protocols. For a typical lake, 8 to 10 sets and the associated sampling of fish can be handled in an 8 hour work day by a two person crew. Table 1. Summary of methods for Nordic netting.
| Criteria | Target |
|---|---|
| Season | Preferably July and August (acceptable range last week in June to second week of September) |
| Set duration | 12 hours (acceptable range 10.5 to 13.5 hours) |
| Gear | Gillnet Gang
|
| Orientation | Random to shore contour |
| Depth | Multiple strata, 1.5m to maximum depth |
| Spatial Stratification | Not required for most lakes. Lakes >5000 hectares require stratification. |
2.2 Sample size
The amount of sampling effort required is determined by:
- the desired precision of the estimate,
- the lake surface area, and
- the maximum depth of the lake.
The higher the precision, and the larger and deeper the lake, the more sampling effort is required. Nyberg and Degerman (1988) determined the sampling effort required to statistically detect a 50% difference between sampling periods or between lakes. The recommended standard sampling intensity for lakes of different sizes and maximum depths is presented in Table 2.Table 2. Number of Nordic sets in relation to lake area and maximum depth.
Lake Area (hectares)
| Maximum Depth (m) | <20 ha | 21-50 ha | 51-100 ha | 101-250 ha | 251-1000 ha | 1001-5000 ha |
|---|---|---|---|---|---|---|
| 0 to 5.9 | 8 sets | 8 sets | 16 sets | 16 sets | 24 sets | 24 sets |
| 6 to 11.9 | 8 sets | 16 sets | 24 sets | 24 sets | 32 sets | 32 sets |
| 12 to 19.9 | 16 sets | 16 sets | 24 sets | 32 sets | 40 sets | 40 sets |
| 20 to 34.9 | 16 sets | 24 sets | 32 sets | 40 sets | 48 sets | 56 sets |
| 35 to 49.9 | 16 sets | 32 sets | 32 sets | 40 sets | 48 sets | 56 sets |
| 50 to 74.9 | 40 sets | 40 sets | 56 sets | 64 sets | ||
| ≥75 | 56 sets | 64 sets |
Following the recommended sampling intensity in Table 2 is strongly recommended. Any reduction in the number of net sets will reduce the ability to compare an individual survey to other survey results. Any estimates from lakes with less than the minimum number of net sets should be interpreted cautiously.
Lakes larger than 5000 hectares require such large sampling efforts (unless the maximum depth is <20m) that they are unfeasible to sample. It is recommended that lakes >5000 hectares should be divided into basins, and that each basin treated as a separate lake.
3.0 Gear description
The standard Nordic gillnet is a 1.5m (≈5 feet) deep by 30.0m (≈100 feet) long. The gillnets are made of homogeneous, uncoloured nylon consisting of 12 mesh sizes and mounted on 30.0m (≈100 feet) buoyancy line and 33.0m (≈110 feet) lead line made out of light grey plastic. The buoyancy rope is 6g•m-1 and the plastic sinking rope is 9.9g•m-1 in water. Each mesh panel is 2.5m (≈8 feet) long. Thread diameter varies from 0.10mm for the 5mm mesh to 0.23mm for the 55mm mesh. The hanging ratio is 0.5 for all mesh sizes. The mesh panels are randomised within the Nordic net but all Nordic nets have the same order of mesh panels. The panels are seamlessly sewn together with no spacers:
- Mesh number 1: 43mm (Knot-to-knot measurement (double for stretched mesh size)), thread diameter 0.20mm
- Mesh number 2: 19.5mm, thread diameter 0.15mm
- Mesh number 3: 6.25mm, thread diameter 0.10mm
- Mesh number 4: 10mm, thread diameter 0.13mm
- Mesh number 5: 55mm, thread diameter 0.23mm
- Mesh number 6: 8mm, thread diameter 0.10mm
- Mesh number 7: 12.5mm, thread diameter 0.13mm
- Mesh number 8: 24mm, thread diameter 0.16mm
- Mesh number 9: 15.5mm, thread diameter 0.15mm
- Mesh number 10: 5mm, thread diameter 0.10mm
- Mesh number 11: 35mm, thread diameter 0.20mm
- Mesh number 12: 29mm, thread diameter 0.16mm
The Nordic nets (approximately $700.00 CAD each) are available from Lundgrens Fiskredskapsfabrik, Storkyrkobrinken 12 S-111 28, Stockholm, Sweden, Telephone: 46 8 10 21 22, Fax: 46 8 20 10 22, Email: info@lundgrensfiske.com, Contact: Magnus Lofqvist
For each net you will also require two 2m (≈7 feet) bridles of 6mm (1/4in) diameter rope, and two 35m (≈115 feet) lengths of 6mm (1/4in) diameter rope for use as the anchor- marker buoy lines, and two marker buoys (net anchors are not used).
4.0 Pre-field activities
4.1 Random selection of sampling sites
The selection of sampling sites and development of the sampling schedule are completed prior to the commencement of field work.
Area stratification
Step One. Using the lake surface area and maximum depth data determine the total netting effort required according to the standard design in Table 2. If the area/volume of the deepest depth stratum is small, exclude it from the determination of total netting effort but include this area of the lake in the next shallowest depth stratum for sampling.
Step Two. A lake bathymetric map (or topographic map if a contour map is unavailable) should be obtained. Next, a numbered 250m x 250m grid for lakes > 200 hectares or a 100m x 100m grid for lakes ≤200 hectares is superimposed over the map to produce a number of distinct, non-overlapping sampling units. The sampling sites are selected using a random numbers table. If a bathymetric map is not available beforehand, total sampling effort and net locations should be determined in the field after sounding transect lines to develop an impression of the lakes bottom contours.
Waterbodies > 200 hectares in size
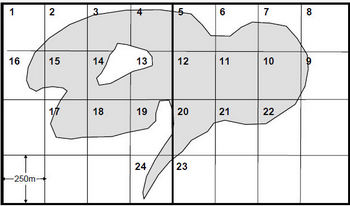
The total number of 250m x 250m grids, including whole grids and portions of grids, which overlay the entire lakes surface should be assigned their own unique number (see Figure 1).
Figure 1. Example illustrating the partitioning and labelling of a large lake (>200ha) into discrete sampling units (bold lines represent universal transverse mercator (UTM) grids).
Waterbodies ≤200 hectares in size
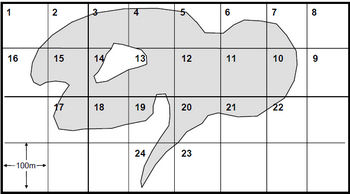
The total number of 100m x 100m grids, including whole grids and portion of grids, which overlay the entire lakes surface should be assigned its own unique number (see Figure 2).
Figure 2. Example illustrating the partitioning and labelling of a small lake (≤200ha) into discrete sampling units.
Step Three. Involves the selection of the sample sites. Using a random number table begin selecting from the numbered grids (Note: Random numbers can also be selected from a telephone book. Pick a page and use the last four digits in the telephone number). Once a grid is selected it cannot be selected again for the same depth stratum (i.e., sampling without replacement). Further selections are made from the remaining potential candidate numbered grids.
Depth stratification
Step Four. Determines in which depth stratum/zone the net is to be set. The depth zones are determined in relation to the volume of each stratum so that each depth stratum equalised (approximately) the same volume of water. An approximation of the depth strata based upon lake morphometric data (Andersson et al. 1987 referenced in Appelberg 2000) should be used as a standardised scheme for depth stratification (Table 3).
Table 3. Proposed depth distribution of Nordic net sets in lakes with different area and maximum depth.
| Lake Area | Depth Zone | <6 m | 6 to 11.9 m | 12 to 19.9 m | 20 to 34.9 m | 35 to 49.9 m | 50 to 75 m | >75 m |
|---|---|---|---|---|---|---|---|---|
| <20 ha | <3m | 4 sets | 3 sets | 4 sets | 4 sets | 3 sets | ||
| <20 ha | 3 to 5.9m | 4 sets | 3 sets | 4 sets | 3 sets | 3 sets | ||
| <20 ha | 6 to 11.9m | 2 sets | 4 sets | 3 sets | 3 sets | |||
| <20 ha | 12 to 19.9m | 4 sets | 3 sets | 3 sets | ||||
| <20 ha | 20 to 34.9m | 3 sets | 2 sets | |||||
| <20 ha | 35 to 49.9m | 2 sets | ||||||
| Total Number of Sets | 8 sets | 8 sets | 16 sets | 16 sets | 16 sets | |||
| 21 to 50 ha | <3m | 4 sets | 5 sets | 5 sets | 5 sets | 5 sets | ||
| 21 to 50 ha | 3 to 5.9m | 4 sets | 6 sets | 5 sets | 5 sets | 5 sets | ||
| 21 to 50 ha | 6 to 11.9m | 5 sets | 3 sets | 5 sets | 6 sets | |||
| 21 to 50 ha | 12 to 19.9m | 3 sets | 5 sets | 6 sets | ||||
| 21 to 50 ha | 20 to 34.9m | 4 sets | 6 sets | |||||
| 21 to 50 ha | 35 to 49.9m | 4 sets | ||||||
| Total Number of Sets | 8 sets | 16 sets | 16 sets | 24 sets | 32 sets | |||
| 51 to 100 ha | <3m | 8 sets | 8 sets | 7 sets | 7 sets | 7 sets | 7 sets | |
| 51 to 100 ha | 3 to 5.9m | 8 sets | 8 sets | 7 sets | 7 sets | 7 sets | 7 sets | |
| 51 to 100 ha | 6 to 11.9m | 8 sets | 5 sets | 9 sets | 7 sets | 10 sets | ||
| 51 to 100 ha | 12 to 19.9m | 5 sets | 6 sets | 4 sets | 4 sets | |||
| 51 to 100 ha | 20 to 34.9m | 3 sets | 4 sets | 4 sets | ||||
| 51 to 100 ha | 35 to 49.9m | 3 sets | 4 sets | |||||
| 51 to 100 ha | 50 to 75m | 4 sets | ||||||
| Total Number of Sets | 16 sets | 24 sets | 24 sets | 32 sets | 32 sets | 40 sets | ||
| 101 to 250 ha | <3m | 8 sets | 8 sets | 8 sets | 7 sets | 7 sets | 7 sets | |
| 101 to 250 ha | 3 to 5.9m | 8 sets | 8 sets | 8 sets | 7 sets | 7 sets | 7 sets | |
| 101 to 250 ha | 6 to 11.9m | 8 sets | 8 sets | 10 sets | 10 sets | 6 sets | ||
| 101 to 250 ha | 12 to 19.9m | 8 sets | 8 sets | 6 sets | 6 sets | |||
| 101 to 250 ha | 20 to 34.9m | 8 sets | 6 sets | 6 sets | ||||
| 101 to 250 ha | 35 to 49.9m | 4 sets | 4 sets | |||||
| 101 to 250 ha | 50 to 75m | 4 sets | ||||||
| Total Number of Sets | 16 sets | 24 sets | 32 sets | 40 sets | 40 sets | 40 sets | ||
| 251 to 1000 ha | <3m | 12 sets | 11 sets | 10 sets | 10 sets | 10 sets | 10 sets | 10 sets |
| 251 to 1000 ha | 3 to 5.9m | 12 sets | 11 sets | 10 sets | 10 sets | 10 sets | 10 sets | 10 sets |
| 251 to 1000 ha | 6 to 11.9m | 10 sets | 10 sets | 10 sets | 10 sets | 10 sets | 10 sets | |
| 251 to 1000 ha | 12 to 19.9m | 10 sets | 10 sets | 8 sets | 8 sets | 8 sets | ||
| 251 to 1000 ha | 20 to 34.9m | 8 sets | 6 sets | 8 sets | 5 sets | |||
| 251 to 1000 ha | 35 to 49.9m | 4 sets | 6 sets | 5 sets | ||||
| 251 to 1000 ha | 50 to 75m | 4 sets | 4 sets | |||||
| 251 to 1000 ha | >75m | 4 sets | ||||||
| Total Number of Sets | 24 sets | 32 sets | 40 sets | 48 sets | 48 sets | 56 sets | 56 sets | |
| 1001 to 5000 ha | <3m | 12 sets | 11 sets | 10 sets | 10 sets | 10 sets | 10 sets | 10 sets |
| 1001 to 5000 ha | 3 to 5.9m | 12 sets | 11 sets | 10 sets | 10 sets | 10 sets | 10 sets | 10 sets |
| 1001 to 5000 ha | 6 to 11.9m | 10 sets | 10 sets | 12 sets | 12 sets | 10 sets | 10 sets | |
| 1001 to 5000 ha | 12 to 19.9m | 10 sets | 12 sets | 9 sets | 10 sets | 10 sets | ||
| 1001 to 5000 ha | 20 to 34.9m | 12 sets | 9 sets | 10 sets | 10 sets | |||
| 1001 to 5000 ha | 35 to 49.9m | 6 sets | 10 sets | 6 sets | ||||
| 1001 to 5000 ha | 50 to 75m | 4 sets | 4 sets | |||||
| 1001 to 5000 ha | >75m | 4 sets | ||||||
| Total Number of Sets | 24 sets | 32 sets | 40 sets | 56 sets | 56 sets | 64 sets | 64 sets |
Following the order in which they were randomly selected, each grid is then assigned to a depth stratum. The total number of sampling sites within each depth stratum is determined by consulting Table 3.
Step Five. Determines which combination of the chosen sites will be sampled on a specified day. It is important that the sampling sites be distinct and non-overlapping so that sampling at a given site will not likely be affected by sampling at adjacent sites.
This is accomplished by maintaining a minimum 100m spacing between nets (i.e., for all the nets set during a single day, the nearest net to any other net should be more than 100m away). An effort should be made to distribute the nets around the lake, and in all the required depth zones.
Using the sites selected, mark the site locations on a field map. On lakes ≤200 hectares in size, sites will be sampled in the order they were randomly selected. The order in which nets are set within a given day is not important and can be determined by the easiest route of travel to those sites.
On lakes greater than 1000 hectares the selected sites may be grouped so that the travel time between sites is minimized (i.e. systematically choose a sub-set of sites from the total available number of selected sites so that your daily netting activity is confined to a smaller portion of the lake). However, it is important to remember that on any day, individual nets should be spaced greater than 100m apart, regardless of lake size.
When assigning the sampling locations for any one day, it is important to make a concerted effort to distribute the nets around the entire lake, in all depth zones, and to keep them well-spaced apart (so the nets don’t interfere with each other).
4.2 Preparation of field forms and equipment
Before any field work can begin, it is important that each survey crew is familiar with the lake to be surveyed (i.e., directions on how to find the lake, boat launching sites, and navigational hazards). The survey crew should have all the necessary maps, including sampling site locations before going into the field. In this manual, we have assumed that each survey crew is familiar with safe boat handling procedures (and at least one crew member has a valid Pleasure Craft Operator Card), use of gillnets, basic fish identification and fish sampling techniques. A valid Licence to Collect Fish for Scientific Purposes must be obtained from the local Ministry of Natural Resources work centre prior to the commencement of the field work (the work centre should also be notified of the intended survey dates).
Prior to the first field sampling day, crews will need to prepare enough Nordic Forms to record their results while in the field. A minimum of one Nordic Survey Sample Record and several Fish Sample Forms are required per net. Additional copies of these forms may be required if catch numbers are large.
Nordic Forms can be printed or copied onto waterproof paper for working in inclement weather. It is recommended that a set of waterproof forms be made available to the field crews for days when such forms would be required. A supplier of both weatherproof photocopy paper (Rite in the Rain Copier Pak @ $18.75 US/200 sheets) and waterproof photocopy paper (Rite in the Rain Dura-Copy @ $52.45 US/100 sheets) is the J.L. Darling Corp., 2614 Pacific Highway East, Tacoma, Washington, USA, 98424-1017 252 922-5000.
All equipment should be checked and serviced (if necessary) at least one week before the survey is to begin. To prepare the gillnet for use in the field attach one end of the bridle to the buoyancy rope and one end to the sinking rope. At the mid-point of the bridle, double the rope and tie a single half hitch knot to form a loop. Each panel in the Nordic net is marked with a small clothe tab and labelled with the appropriate mesh size (knot-to-knot measurement). This will make it easier to determine which fish came from which panel.
Each Nordic gillnet should be stored in its own container (e.g.., 68.1 L Rubbermaid Roughneck storage tub) or netting tub with the same end of the gillnet at the top (either the 29 or 43mm mesh) of every container (i.e., all nets are stored the same). Each netting container or tub should have small openings made in the bottom to allow for fluids to drain out. Marker buoys and anchor-marker buoy lines should be stored in a separate container from the nets. The containers should have lids that can be sealed for transport and storage.
An equipment checklist is included in Appendix A.
4.3 Licence to collect fish for scientific purposes
Nordic netting and other methods of capturing fish for management purposes are critical tools used by fisheries managers. However, this activity must occur under licence regardless of whether MNR staff carry out the work or it is completed by a contractor.
The Fisheries Act (Sec 3(2)) and the Ontario Fishery Regulations (OFR) (Sec 4(1)) are binding in the Province and requires fishers to have an appropriate licence for any means of fishing. In the case of index netting, the Licence to Collect Fish for Scientific Purposes as provided for in Section 36.1 of the OFR provides the appropriate authority. This licence is issued under Section 34.1(1) of the Fish Licensing Regulations under the Fish and Wildlife Conservation Act (FWCA) by any of the following: Area Supervisor, Regional Operations Manager, Great Lakes Manager, and Manager Fisheries Section.
4.3 Preparation of a fish disposal plan
It is strongly recommended that a Fish Disposal Plan be completed and approved by MNR fisheries and compliance staff prior to conducting a Nordic project. Because overnight sets of gillnets are used, Nordic generally results in mortality of captured fish. Based on Section 36(5) of the FWCA it is illegal to abandon fish or to let its flesh spoil if it is fit for human consumption. Although the FWCA is not binding on the Crown, reasonable efforts should be made to maintain the fish captured in your Nordic project in a fresh state. Following sampling, the fish should be distributed equitably to willing recipients (e.g.., individuals, groups or organisations).
General principles that should be considered or addressed in a fish disposal plan and an example of a disposal plan can be found in Appendix B.
4.5 Preparing a public information sheet
If working on a lake with cottage or tourism development, it is a good idea to prepare an Information Sheet to give to property owners and other members of the public when encountered near your sampling sites (see Figure 3). Public Information Sheets can be left on docks or between doors of residents that appear to be away for the day. These Information Sheets tend to satisfy most people's curiosity and significantly reduce the occurrence of negative reactions which can lead to net tampering or unnecessary complaints.
In some cases, project leaders may want to contact local interest groups (e.g.., cottage associations, First Nations, angler groups, etc.) prior to conducting the field program, to inform them about the Nordic program that will be taking place on the lake.
A typical Information Sheet or contact letter should identify who is conducting the Nordic program, why, for how long, and provide a telephone number to contact for more information.
Figure 3. Example of a public information sheet.
5.0 Field procedures
5.1 Safety and communication
Nordic surveys take place in the summer months when surface water temperatures are generally >15°C. Delay sampling if there are severe weather conditions. All safety equipment should be accessible and personal flotation devices should be worn while on the water. Everybody participating in the Nordic survey should be aware of their rights and obligations according to the Occupational Health and Safety Act. A designated person should know where the field crew is on any given day and how to contact them. Crews will contact their supervisor at prearranged times on a daily basis using satellite phones.
5.2 Site selection
Use the lake map and sampling schedule you prepared in the office (as described in Section 4.1) to determine where and when to set each Nordic gillnet. On reaching the predetermined site use a depth sounder (“fish finder”) to locate the appropriate depth zone. Avoid net locations along steep gradient drop-offs, bottoms with large woody debris or areas with abundant aquatic vegetation. Do not set nets from shore-to- shore (i.e., across a narrows). Gillnets are set at random angles to the shore contour.
5.3 Setting the net
To set the Nordic net one crew member is positioned in the bow of the boat and the second member at the rear operating the motor.
- Upon reaching the desired depth zone, shift the outboard motor into neutral. Attach the marker buoy to one end of the anchor-marker buoy line.
- Attach the other end of the anchor-marker buoy line to the bridle loop (Note: Net anchors are not used for Nordic nets).
- Play out enough of the anchor-marker buoy line for the desired depth required. Drop the anchor-marker buoy line into the water, shift the outboard motor into reverse, and begin to play out the Nordic net.
- Make sure that the Nordic nets buoyancy line and lead line are playing out evenly, free from twists and tangles, with the float line handled at a higher level and toward the water.
- When the Nordic net is fully played out shift the outboard motor into neutral.
- Attach the other anchor-marker buoy line to the bridle loop at the other end of the Nordic net.
- Play out enough of the anchor-marker buoy line for the desired depth required, attach the marker buoy to end of the anchor-marker buoy line, and drop the anchor-marker buoy line into the water. The Nordic net is now set.
- Proceed to the next site location to set a Nordic net.
- Repeat steps 1 to 8 until all of the Nordic nets have been set for the day.
5.4 Information to record at set
Prior to setting any nets on the first day, temperature-dissolved oxygen profiles should be done at the deepest point in the lake with the boat anchored while taking measurements. Using a YSI meter, the field crew should measure dissolved oxygen and temperature at 1.0m intervals beginning at the surface and down to bottom (i.e., the station depth). Also record the YSI meter model number and serial number. All temperature and dissolved oxygen data is recorded in pencil.
Immediately following each set all necessary data is recorded in pencil on the Nordic Survey Sample Record (Appendix D). The information outlined below is the minimum requirement for entry into Fishnet 2.0 (FN121).
Waterbody Name [WBY_NM] - Record the official name of the lake in which the Nordic net was set (e.g.., Example Lake).
Field Crew - Record the names or initials of the field crew members who set the net - note this data will not be entered in Fishnet.
Wind Direction and Speed [WIND] - Record the wind direction in degrees (e.g.., 000 = no wind, 090 = east, 180 = South, 270 = west, and 360 = north) and the wind speed in knots.
| Kilometres•hour-1 | Knots | Surrounding Signs |
|---|---|---|
| 0 | 0 to 1 | Lake surface is mirror smooth |
| 2 to 5 | 1 to 3 | Ripples on lake surface |
| 6 to 12 | 4 to 6 | You can feel wind on your face |
| 13 to 20 | 7 to 10 | Small waves appear on lake |
| 21 to 30 | 11 to 16 | Fairly frequent whitecaps occur |
| 31 to 40 | 17 to 21 | Surface waves form on water |
| 41 to 50 | 22 to 27 | Some spray from lake surface |
| 51 to 61 | 28 to 33 | Unsafe to be on the water |
| 62 to 74 | 34 to 40 | Unsafe to be on the water |
| 75 to 89 | 41 to 47 | Unsafe to be on the water |
| 90 to 103 | 48 to 55 | Unsafe to be on the water |
| 104 to 119 | 56 to 63 | Unsafe to be on the water |
Cloud Cover [CLOUD] - Record the fraction of the sky covered by clouds in ⅛ increments.
Precipitation [PRECIP] - Record the type of precipitation according to the listed codes on the Nordic Survey Sample Record.
Sample Number [SAM] - Record the unique (and sequential) number given to each individual setting of a net (i.e. the first set of project would be sample #001, the next set would be sample #002, the 26th set would be sample #026, etc). Sam is a Fishnet key field and cannot be left blank.
Gear [GR] - Use gl01 as the identifier code for the standard 12 panel multi-mesh Nordic net.
Gear Use [GRUSE] - Record the depth zone according to the listed codes on the Nordic Survey Sample Record.
Set Date [EFFDTO] - The date that the net was set (year.month.day).
Set Time [EFFTMO] - Record the time that the net was set (24 hr clock in hours and minutes). Set time is recorded as the time when the anchor- marker buoy line is dropped into the water (i.e., step 7 completed in Section 5.3).
Minimum Gear Depth [GRDEPMIN] - Record the depth of the net at one end of the set in metres to one decimal place (i.e., step 3 completed in Section 5.3).
Maximum Gear Depth [GRDEPMAX] - Record the depth of the net at the other end of the set in metres to one decimal place (i.e., step 7 completed in Section 5.3).
UTM Zone [UTMZONE] - If a global positioning system (GPS) unit is available record the universal transverse mercator (UTM) zone for the lake. Also mark the Nordic net set location on a map of the lake (use on map for recording the locations of all nets set during the entire Nordic survey).
Easting [UTMEAST] - If a GPS unit is available record the “Easting” (number of metres from the Central Meridian in each UTM Zone).
Northing [UTMNORTH] - If a GPS unit is available record the “Northing” (number of metres from the Equator).
Net Identifier Code - This field is used to record a uniquely assigned gear inventory code for each Nordic net - note this data will not be entered in Fishnet.
5.5 Lifting the net
Lift the Nordic nets the next day in the same order as they were set (remember, the target for set duration is 12 hours). The person lifting the net is in the front of the boat. Generally the outboard motor can be stopped, but on windy days the outboard motor operator may need to control the boat’s position so that the net does not get fouled as a result of wind or boat movement. To lift the net:
- Retrieve the marker buoy from the Detach the marker buoy (while retaining hold of the line) and pull in the anchor-marker buoy line to the bridle loop.
- Detach the anchor-marker buoy line (while retaining hold of the line) from the bridle loop (while retaining hold of the bridle). Place the marker buoy and anchor-marker buoy line in a separate storage container away from the net.
- Grasp the Nordic nets buoyancy rope and lead rope in the left hand and pull the net into the boat as the other partially closed right hand slides down the net to the arm's length. Close the right hand around the net and release the left hand. Pull the net into the boat with the right hand as the other partially closed left hand slides down the net to the arm's length. Continue to pull in the net alternating each hands position. The net should be placed with care into one of the storage containers to prevent tangling. Detach the other anchor-marker buoy line from the bridle loop (while retaining hold of the bridle). Detach the marker buoy from the anchor-marker buoy line. Place the marker buoy and anchor-marker buoy line in the same container as the other buoy and line. Record all necessary data on the Nordic Survey Sample Record in pencil.
- The entire net should be retrieved, placed into a separate storage container, placing a piece of paper inside labelled in pencil with the appropriate sample number, and moved to the back of the boat.
- Proceed to the next net to be lifted.
- Repeat steps 1 to 5. A maximum of 10 to 12 Nordic nets can be lifted and kept in the boat.
5.6 Information to record at lift
Immediately following each lift (i.e., before going to the next lift) the following data are recorded in pencil on the Nordic Survey Sample Record: lift date, lift time and effort status. This information is the minimum requirement for entry into Fishnet 2.0 (FN121). Also record on the back of the Nordic Survey Sample Record any additional pertinent observations.
| Lift Date [EFFDT1] | Record the date the net was set (year.month.day). |
|---|---|
| Lift Time [EFFTM1] | Record the time that the net was lifted (24hr clock in hours and minutes). The lift time is the time when you start to retrieve the first panel (i.e., step 1 completed in Section 5.5). |
| Effort Status [EFFST] | Record the condition of the net set at the time of lifting (1 = net good fishing order at the time of lifting; 2 = net has been tampered with or twisted during set; 3 = wind and waves blew the net onto shore; any other number is user defined). |
5.7 Processing the catch
The day's catch should never be processed in the boat. Fish processing should take place on the shore (or indoors if possible). Depending on the weather you may want to find a sheltered bay or shore location to pick the nets. The storage containers (with nets) should be unloaded from the boat and placed in a cool, shaded location before beginning to process the daily catch. The day's catch should be sorted by sample and effort number (Note: Only process one net at a time). Fish captured in the Nordic net are to be processed by individual panel (i.e., mesh size). All of the fish captured in each panel are therefore removed from that panel and placed into a clearly labelled grocery bag. The bag should be labelled with the net number and mesh size using a medium or thick permanent waterproof felt tip marker. For data entry into Fishnet 2.0 each Nordic net set is assigned a sample number while each mesh size is an effort number. For example, fish caught in the 29 mm mesh of the third Nordic net set are placed in a bag labelled 3-29 (i.e., sample number-effort number). Once all of the fish have been removed from the net, the net should be stretched out on the ground until dry. Once the net is dry, it can be untangled and re-packed.
The first step is to identify, count and record all fish caught in each panel of each net. When processing by panel identify, count, and record by mesh size [EFF] all fish caught in each net set [SAM]. This information is recorded, in pencil, on the Nordic Survey Sample Record (FN123). A separate Form is used for each set.
Mesh Size [EFF] - The knot-to-knot mesh size (in mm) of the panel being sampled (e.g.., 5, 6, 8, 10, 12, 15, 19, 24, 29, 35, 43, or 55) or 999 if a loose fish is found in the storage container (and can’t be related to a particular mesh size).
Fish Species [SPC] - Identifies the fish species caught in the panel being sampled using the number coding system included in Appendix C.
Number Caught [CATCNT] - The number of fish caught in the panel being sampled (referenced to [SPC]). If applicable increase the number caught based upon field notes (See Lifting the Net #4).
Number Sampled [BIOCNT] - The number of fish caught in the panel that are biologically sampled (referenced to [CATCNT]). It should be the same or less than [CATCNT].
Total Weight [CATWT] - The sum of the biomass (in grams) for each species and mesh size combination (referenced to [CATCNT]). For common fish species this calculation is performed later in the office during data entry (See 6.1 Completing the Catch Summary (FN123) Form). For uncommon or rare species this is calculated from the individual fish measurements on the Nordic Fish Sample Form (FN125).
5.8 Fish sampling
A two person crew is used to sample the fish. A number of biological attributes can be collected from the fish samples. A minimum requirement for Nordic surveys is that all sportfish will be completely biologically sampled, all common fish species will be sampled for total length (or fork length if total length cannot be measured due to damage), and all uncommon or rare species with be sampled for fork length, total length, and round weight.
5.8.1 Sampling sportfish species
It is recommended that the following data should be collected for the sportfish species: fork length, total length, round weight (but see Section 5.8.2 Sampling Other Fish Species), sex, and maturity. These data are recorded on the Nordic Fish Sampling Form (FN125). In addition, a scale sample and at least one other secondary ageing structure is collected.
Optional data that can be collected on sportfish are: visceral fat, gonad (testes or ovary) wet weight, fecundity samples, and stomach samples. Guidelines for processing fish for this information are not covered in this manual.
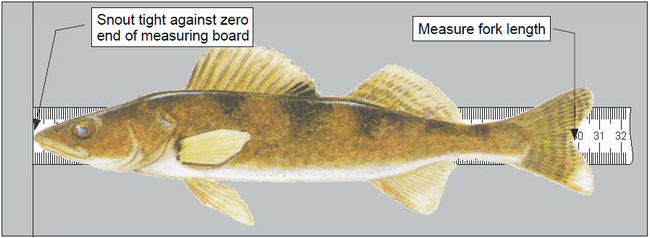
- The fish handler selects a fish, identifies the mesh size and species, and places it on the measuring board such that the snout is snug against the zero end of the board and the fish is laying flat across the ruler (see Figure 3). The recorder completes the first two columns ([EFF] and [SPC]) of the Fish Sampling Form.
- Measure the fork length (see Figure 4) and total length to the nearest 1 millimetre and record the fish number [FISH], [FLEN] and [TLEN] on the Fish Sample Form. To measure total length, compress the upper and lower lobes of the caudal fin rays to obtain the maximum length.
Weigh the fish using a hand held spring-loaded weigh scale or an electronic balance (preferred). Hand held spring-loaded scales should be calibrated every one or two days. If you are using a hand held scale do not record weights that are <10% of the minimum scale capacity (e.g.., 100g for a 1kg scale) and make sure it has an appropriate capacity (i.e., do not use a 1kg scale to weigh 80g fish, use a 100g scale). If using an electronic balance, measure the round weight to the nearest 1g. Record [RWT] on the Nordic Fish Sample Form in pencil.
Figure 4. Measuring the fork length of a fish.
To collect a scale sample, gently wipe away, with the blade of your knife, any excess mucous and dirt from the area to be sampled. Clean the knife blade carefully by wiping with a cloth or rinsing in water. With the tip of the knife gently pull the scales from the left side of the body and place in a scale envelope. For spiny rayed fish (walleye, sauger, yellow perch, smallmouth bass, etc.) remove at least ten scales from below the lateral line and posterior to the insertion of the pectoral fin. For soft rayed fish (northern pike, salmonids, coregonids, etc.) remove at least twenty scales from above the lateral line and anterior to the dorsal fin. Record, in pencil, on every scale sample envelope the following information:
Scale Sample Envelope Fishnet 2.0 Field Name Species [SPC] Party No. [SAM]+[EFF] No. [FISH] Date [EFFDT1] Locality [WBY_NM] Age [AGEST] For any fish that is scale sampled, collect a secondary calcified ageing structure and place it into a second scale envelope that has been labelled as above (except otoliths which are stored in a vial and placed into the first scale envelope). The following table lists, by species, the secondary calcified structures which may be collected for ageing. Record on the Nordic Fish Sample Form the type of structure [AGEST] that was collected.
Fish Species Calcified Structure footnote 2 Walleye and other Percids Otoliths, or first three dorsal spines or opercular bones Northern pike or Muskellunge Otoliths or cleithrum Smallmouth bass and other Centrarchids Otoliths, or first three dorsal spines or opercular bones Lake trout and other Salmonids; Lake whitefish and other Coregonids Otoliths or first four marginal pectoral finrays Other species Otoliths - Using a filleting knife cut the fish ventrally from the urogenital opening to the pelvic girdle and determine the sex and maturity. Record [SEX] and [MAT] information on the Nordic Fish Sample Form in pencil.
- Also record on the Nordic Fish Sample Form any observed clipped fins[CLIPC] and additional tissues collected [TISSUE] using the codes provided.
5.8.2 Sampling other fish species
- The fish handler selects a fish, identifies the species, and places it on the measuring board such that the snout is snug against the zero end of the board and the fish is laying flat across the ruler (see Figure 4).
- Measure the total length (or fork length if total length cannot be measured due to damage) to the nearest 1mm but do not measure round weight for the following fish species (MNR fish species codes): 080, 081, 082, 091, 093, 102, 121, 131, 141, 162, 163, 182, 183, 185, 194, 196, 198, 199, 200, 201, 204, 206, 208, 209, 210, 211, 212, 213, 214, 233, 271, 281, 282, 283, 291, 311, 313, 314, 316, 317, 331, 334, 338, 342, 381, 382, and 383. Total length – round weight regression models are provided in Appendix E for these fish species.
- Round weights should be measured for any species not listed in #2 above. Record the mesh size [EFF], species [SPC], fish number [FISH], fork length [FLEN], total length [TLEN], and round weight [RWT] on the Fish Sample Form
5.9 Recording the fish data
Biological information is recorded with an hb pencil on the Nordic Fish Sampling Form. If more than one Form is required to record the biological data then the lake name, date, and sample number are repeated on the second Form. Use the boxes on the lower right corner of the Form to indicate the total number of pages used to record data for that net set.
Sample Number [SAM] - The unique number given to the individual net set being sampled.
Mesh Size [EFF] - The knot-to-knot mesh size (in mm) of the panel being sampled (e.g.., 5, 6, 8, 10, 12, 15, 19, 24, 29, 35, 43, or 55) or 999 if a loose fish is found in the storage container (and can’t be related to a particular mesh size).
Fish Species [SPC] - Identifies the fish species caught in the panel being sampled using the fish species coding system provided in Appendix C.
Fish Number [FISH] - A serial number assigned to the individual fish being sampled for identification purposes. This number is also used to link all information for a single fish (i.e., the number on the Fish Sampling Form must correspond to the fish number on the scale sample envelopes). The recommended protocol is to assign the first fish sampled the number 1 with each subsequent fish numbered consecutively upwards until the last fish in the entire Nordic survey is sampled.
Fork Length [FLEN] - The length, measured to the nearest 1mm, of the individual sampled fish from the anterior tip of the snout, with the mouth closed, to the posterior edge of the median caudal fin rays (i.e., the fork in the caudal fin). For fish without a fork in their caudal fin (e.g.., burbot or brown bullhead), fork length is defined to be the same as [TLEN].
Total Length [TLEN] - The length, measured to the nearest 1mm, of the individual sampled fish from the anterior tip of the snout, with the mouth closed, to the most distant lobe of the caudal fin (compress the upper and lower lobes of the caudal fin rays to obtain the maximum length).
Round Weight [RWT] - The round weight of the individual fish, measured in grams with hand held spring-loaded scales or to the nearest gram using an electronic balance, The hand held spring-loaded scales should be calibrated every one or two days. Weigh fish with appropriate capacity spring scale. Do not record weights of fish that are <10% of the minimum scale capacity (100g for a 1kg scale) whenever spring-loaded mechanical scales are used; spring- loaded scales are too insensitive for weighing such small fish (i.e., do not weight a 80g fish on the 1kg scale, use the 100g scale).
Sex [SEX] - The sex of the individual sampled fish based upon internal examination. The Ontario Fisheries Information System (OFIS) codes for sex are: 1 = male, 2 = female, and 9 = unknown.
Maturity [MAT] - The reproductive maturity of the individual sampled fish based upon internal examination (see [SEX]). The OFIS codes for maturity are: 1 = immature, 2 = mature, and 9 = unknown.
Ageing Structures Collected [AGEST] - The age structures collected from the individual sampled fish. The OFIS codes for age structures are: 0 = no structure collected, 2 = scales (collected from the left side of the fish), 4 = pectoral ray, 7 = dorsal spine, A = otolith, B = operculum, and D = cleithrum.
Clips Observed at Capture [CLIPC] - Any observed fin clips at capture. The OFIS codes for fin clips are: 0 = no clip, 1 = right pectoral, 2 = left pectoral, 3 = right pelvic, 4 = left pelvic, 5 = adipose, 6 = anal, and 7 = dorsal.
Tissues Sampled [TISSUE] - Any additional tissues collected and preserved for later processing. The OFIS codes are: 0 = none, 1 = flesh sample, 8 = stomach, 9 = gonads, and A = whole fish
6.0 Post field activities
6.1 Completing the catch summary (FN123) form
The biomass for sportfish, uncommon, and rare fish species is determined by summing the individual round weight ([RWT]) observations from each panel collected during the fieldwork. For common species (i.e., those with only total length ([TLEN]) measurements taken during the fieldwork) individual fish weights are estimated from the total length-to-round weight regression models provided in Appendix E. These are then summed for each panel biomass ([CATWT]) and recorded on the appropriate Nordic Survey Sample Record.
6.2 Processing the collected fish tissues
After the completion of field work there is still some fish processing left to do. Opercles and cleithra must be immediately cleaned and otoliths placed in small vials for storage.
Calcified ageing structures.
Otoliths should be removed from scale envelopes and placed in small vials. Vials should be stored upright in the original scale envelope. Any excess muscle or connective tissue must be removed from the calcified structure (e.g.., opercles or cleithra). To remove the excess flesh, immerse the sample into gently boiling water for 5-10 seconds then remove the non-calcified tissue with your fingers or scrub with a toothbrush. Repeat until clean. Ensure that opercles and cleithra are completely dry before placing them into their labelled scale sample envelope.
Scale sample envelopes should be organized before being sent for age interpretation. The flap of the scale envelope should be folded over but not tucked in. Ageing tissues from each individual fish should be stored together. Samples from each species should be shipped in separate boxes.
6.3 Disposing of dead fish
Dead fish should be disposed of according to your Fish Disposal Plan. If a formal Plan was not prepared and approved for your project then dispose of fish in keeping with the principles and requirements outlined in Appendix 2.
Dead fish (and offal) not destined for human consumption should be buried at an appropriate burial site. Do not bury or dispose of fish in areas with human or bear activity.
6.4 Net storage and replacement
Nordic nets should be dried completely following each Nordic survey to avoid transporting invasive species from lake to lake. It is strongly recommended that if a lake is know or suspected to contain invasive species, the Nordic nets should be washed in antibacterial soap and hot water (≈40°C) and allowed to thoroughly dry before using them in another lake. Drying time varies with the weather; however, in general, nets should be dried for a minimum of four days. Small tears in the panels should be repaired as soon as possible. Nets with large tears or damaged panels should be sent back to the manufacturer for replacement. The nets should be stored in their individually sealed containers in a dry place. All ropes and marker buoys should be dried out and stored in their sealed container in a dry place.
6.5 Other equipment
Other equipment should be checked for damage and serviced if necessary. Outboard motors should receive a maintenance servicing at the conclusion of the field season. All metal equipment should be dried and lubricated before being stored in a dry place. Batteries should be re-charged and stored in a dry place.
7.0 Data management
The data recorded on the Nordic forms are in a format compatible with the software package Fishnet 2.0 and as such data entry can be done directly from the forms into Fishnet 2.0. Other database programs are not compatible and as such will not be supported.
Ministry of Natural Resources field offices may obtain copies of Fishnet 2.0 from the Ontario Fisheries Information System (OFIS) in Peterborough. A copy of the Fishnet 2.0 Nordic Project Template (a modified Index Adult template) and data entry assistance can be obtained from the Cooperative Freshwater Ecology Unit (CFEU) at the following address:
Michael Malette, Data Manager
Cooperative Freshwater Ecology Unit
Department of Biology, Laurentian University
Sudbury, Ontario P3E 2C6
Completed Nordic projects should be compressed and e-mailed to CFEU orcopied onto computer diskettes and sent to CFEU. The CFEU will maintain the Nordic database and provide Fishnet outputs and comparative databases upon request. A digital copy of the manual and data record forms will be available on the Cooperative Freshwater Ecology Unit website (coopunit@laurentian.ca).
8.0 Benchmarks
Between 1999 and 2004 a total of 179 Nordic surveys from 152 lakes were completed; largely in the northeast administrative region of the Ministry of Natural Resources. These Fishnet projects are archived in a central Nordic database at the Cooperative Freshwater Ecology Unit. Relative comparisons between lakes (or years), that have been sampled according to the Nordic protocol can be made using a classification system based upon descriptive statistics from the Nordic database. This report summarizes proposed benchmarks for biomass (g•net-1) and biodiversity indices. To use these classification systems, it is recommended that individual Nordic estimates should be compared to percentiles, quartiles, and ranges calculated from the 1999 to 2004 Nordic database.
8.1 Biomass
Whole-lake Nordic biomass estimates (g•net-1) for the most commonly encountered species and the entire fish community can be compared to the values reported in Table 4. The ranges for either individual fish species or the entire fish community can used to classify biomass as very low (≤5% percentile), low (>5% percentile and ≤25% quartile), below average (>25% quartile and <median), above average (>median and <75% quartile), high (≥75% quartile and <95% percentile), and very high (≥95% percentile).
Table 4. Nordic survey biomass (g•net-1) summary statistics for common fish species and entire lake community. [Biomass Estimate (g•net-1)]
| Fish Species | N | Mean (±95% C.I.) | Median | Minimum | 5% Percentiles | 25% Percentiles | 75% Percentiles | 95% Percentiles | Maximum |
|---|---|---|---|---|---|---|---|---|---|
| Lake Tout | 122 | 666 (552 to 779) | 465 | <1 | 55 | 281 | 845 | 1999 | 3588 |
| Lake herring | 57 | 239 (183 to 296) | 189 | 15 | 41 | 89 | 300 | 683 | 1152 |
| Northern pike | 48 | 203 (140 to 266) | 130 | 2 | 20 | 62 | 255 | 693 | 943 |
| White sucker | 149 | 657 (554 to 760) | 496 | 5 | 52 | 224 | 840 | 1930 | 4395 |
| Smallmouth bass | 68 | 423 (352 to 494) | 365 | 6 | 37 | 194 | 564 | 865 | 1702 |
| Yellow Perch | 117 | 400 (314 to 486) | 202 | 2 | 10 | 62 | 586 | 1299 | 2560 |
| Walleye | 38 | 384 (271 to 497) | 319 | 4 | 13 | 121 | 522 | 1187 | 1323 |
| Cyprinid species | 145 | 71 (51 to 91) | 26 | <1 | <1 | 5 | 81 | 295 | 810 |
| Entire community | 178 | 2088 (1936 to 2240) | 1921 | 30 | 675 | 1344 | 2675 | 3907 | 5894 |
The average fish community biomass in the Nordic database is 2088 g•net-1 but this value can vary considerably (coefficient of variation = 49%) between lakes. Simple linear correlation between the different fish species suggest that increases (and much of the variation) in overall fish community biomass are positively correlated with the biomass of predatory fish (i.e., lake trout, northern pike or walleye) or white sucker (Table 5). Higher walleye biomass is correlated with increases in lake herring biomass. Northern pike biomass increases with increases in both white sucker and yellow perch biomass. Surprisingly higher smallmouth bass biomass is correlated with lower yellow perch biomass and vice versa. White sucker and yellow perch biomass are positively correlated as are lake herring and Cyprinid biomass.
Table 5. Correlation matrix of fish species biomass estimates (g•net-1) in Nordic surveys.
| Lake trout biomass | Lake herring biomass | Northern pike biomass | White sucker biomass | Smallmouth bass biomass | Yellow perch biomass | Walleye biomass | Cyprinid biomass | |
| Lake trout biomass | ||||||||
| Lake herring biomass, Northern pike biomass | Not significant | |||||||
| Lake herring biomass, Northern pike biomass | Not significant | Not significant | ||||||
| White sucker biomass, Smallmouth bass biomass, Yellow perch biomass | Not significant | Not significant | r=0.3801 n=42 p<0.05 | |||||
| White sucker biomass, Smallmouth bass biomass, Yellow perch biomass | Not significant | Not significant | Not significant | Not significant | ||||
| White sucker biomass, Smallmouth bass biomass, Yellow perch biomass | Not significant | Not significant | r=0.4858 n=46 p<0.01 | r=0.2883 n=98 p<0.01 | r=-0.4275 n=58 p<0.01 | |||
| Walleye biomass | Not significant | r=0.5947 n=15 p<0.05 | Not significant | Not significant | Not significant | Not significant | ||
| Cyprinid biomass | Not significant | r=0.2898 n=49 p<0.05 | Not significant | Not significant | Not significant | Not significant | Not significant | |
| Entire community biomass | r=0.4790 n=122 p<0.001 | Not significant | r=0.5106 n=48 p<0.001 | r=0.5570 n=149 p<0.001 | Not significant | Not significant | r=0.6690 n=38 p<0.001 | Not significant |
Biomasses of lake trout, northern pike, and the Cyprinid species are significantly lower in lakes where they co-exist with smallmouth bass (Table 6).
Table 6. Comparison of Nordic survey lake trout, northern pike, and Cyprinid biomass (g•net-1) based on the occurrence (i.e., absence or presence) of smallmouth bass in the fish community.
| Co-existing Species | Smallmouth Bass Absent | Smallmouth Bass Present | Significance (One-way Analysis of Variance) |
|---|---|---|---|
| Lake Trout biomass | 817 g•net-1 Standard error=66 n=83 | 343 g•net-1 Standard error=97 n=39 | F(1,120) = 16.697, p<0.0001 |
| Northern Pike biomass | 330 g•net-1 Standard error=52) n=15 | 145 g•net-1 Standard error=35 n=39 | F( 1,46 ) = 8.8226, p<0.01 |
| Cyprinid biomass | 100 g•net-1 Standard error=11 n=97 | 13 g•net-1 Standard error=16 n=48 | F(1,143) =19.274, p<0.0001 |
8.2 Biodiversity
Diversity measures take into account two factors: species richness, that is the number of species present in a sample, and evenness, that is how equally abundant the various species are in the sample (Magurran 1988). As such diversity indices can be classified as either:
- species richness indices, or the number of species in a defined sampling unit (i.e., lake),
- proportional abundance indices which merge species richness and evenness into a single factor, or
- species abundance models which mathematically describe the relationship between the number of species and the number of individuals in those species.
The majority of the projects (168 of 178) in the Nordic database conform to the logarithmic series model of species abundance. These characteristic patterns suggest that fish species in these northern lakes arrived at irregular (or random) intervals and that those species arriving later occupied smaller fractions of the remaining available niches or habitats (i.e., lakes containing a small number of abundant species and a larger proportion of “rare” species).
The recommended species richness and proportional abundance indices that can be derived from a Nordic survey are:
- The number of species caught.
- The Shannon diversity index (H = -∑pi•lnpi where p i is the proportional abundance of the ith species = (ni•N-1); ni is the number of individuals in one species and N is the total number of individuals of all species caught in the Nordic survey; ln is Napierian logarithms). Community diversity or evenness increases linearly with increases in the Shannon H index.
- the Berger-Parker dominance index (d = N•Nmax-1 where N is the total number of individuals of all species caught in the Nordic survey and Nmax is the number of individuals in the most abundant species caught in the Nordic survey). An increase in the value of the Berger-Parker d index accompanies an increase in diversity and a reduction in dominance of the most abundant species in the Nordic survey.
Biodiversity indices from a single Nordic survey can be compared to the values reported in Table 7. The derived values can be used to classify diversity as very low (≤5% percentile), low (>5% percentile and ≤25% quartile), below average (>25% quartile and <median), above average (>median and <75% quartile), high (≥75% quartile and <95% percentile), and very high (≥95% percentile).
Table 7. Summary of diversity indices statistics for Nordic surveys.
| Diversity Index | N | Mean (±95% C.I.) | Median | Minimum | 5% Percentiles | 25% Percentiles | 75% Percentiles | 95% Percentiles | Maximum |
|---|---|---|---|---|---|---|---|---|---|
| Number of species | 179 | 8.2 (7.7 to 8.7) | 8 | 0 | 2 | 6 | 10 | 14 | 21 |
| Shannon H (Diversity) | 178 | 1.09 (1.01 to 1.18) | 1.14 | 0 | 0.09 | 0.73 | 1.52 | 1.90 | 2.19 |
| Berger Parker d (Dominance) | 178 | 1.92 (1.79 to 2.04) | 1.61 | 1.00 | 1.02 | 1.24 | 2.39 | 3.47 | 5.11 |
Correlation analysis between the fish species biomass estimates and diversity indices suggest that overall diversity increases as the fish community biomass increases (Table 8). Increases in the biomass of northern pike, white sucker, and yellow perch are correlated with declines in species richness and evenness in the fish community. Increases in smallmouth bass biomass appear to result in an increase in community diversity by decreasing the dominance of yellow perch. However, as white sucker and yellow perch biomass increases these species tend to become dominant in the fish community. The dominance effect of these two species (yellow perch and white sucker) appears to be more related to changes in yellow perch biomass than white sucker biomass. For lakes ≤median community biomass, yellow perch and white sucker each comprise an average 29% of the total biomass (combined 58%) but for lakes >median community biomass yellow perch declines to 15% while white sucker remains unchanged (29% of the total biomass).
Table 8. Correlation matrix of common fish species biomass estimates (g•net-1) and diversity indices for Nordic surveys. [Diversity Index]
| Fish Species Biomass (g•net-1) | Number of Species (Richness) | Shannon H (Evenness) | Berger-Parker d (Dominance) |
|---|---|---|---|
| Lake trout | Not significant | Not significant | Not significant |
| Lake herring | Not significant | Not significant | Not significant |
| Northern pike | r=-0.3402 n=48 p<0.05 | r=-0.2891 n=48 p<0.05 | Not Significant (p=0.06) |
| White sucker | r=-0.1662 n=149 p<0.05 | r=-0.2119 n=149 p<0.01 | r=-0.1986 n=149 p<0.05 |
| Smallmouth bass | Not significant | Not significant | r=0.2693 n=68 p<0.05 |
| Yellow perch | r=-0.5950 n=117 p<0.001 | r=-0.7622 n=118 p<0.001 | r=-0.6109 n=117 p<0.001 |
| Walleye | Not significant | Not Significant | Not significant |
| Cyprinids | Not significant | Not significant | Not significant |
| Entire community | r=0.2575 n=178 p<0.01 | r=0.2158 n=178 p<0.01 | Not significant |
9.0 Acknowledgements
10.0 References
Andersson, P.H., Borg, H., Holmgren, K., and L. Hakansson. 1987. Typsjoar I tillrinningsomraden I projektet kalkning-kvicksilver vid Naturvardsverkets pu-lab. Naturvardsverket Rapp. 3398. 80pp. (In Swedish with English summary).
Appelberg, M. 2000. Swedish standard methods for sampling freshwater fish with multi- mesh gillnets. Fiskeriverket Information 2000:1. 29pp.
Jensen, J.W. 1986. Gillnet selectivity and the efficiency of alternative combinations of mesh sizes for some freshwater fish. J. Fish Biol. 28:637-646.
Magurran, A.E. 1988. Ecological diversity and its measurement. Princeton University Press, New Jersery. 179pp.
Mann, S.E. 1992. Collection techniques for fish ageing structures (northwest region). Technical Report #73. Ontario Ministry of Natural Resources, Northwest Region Science and Technology Unit, Regional Ageing Laboratory, Dryden, Ontario. 20p.
Ministry of the Environment. 2005. Guide to eating Ontario sport fish. Ontario Ministry of the Environment. Toronto. Ontario. 196p.
Snucins, E., Tunney, T., Kleinboeck, T, and J. Gunn. (under review) Establishing a standard sampling season for fish assemblages in Ontario lakes using the international Nordic method. North American Journal of Fisheries Management.
Appendix B. General principles, requirements, and example of a fish disposal plan
General principles
- First priority for index netting projects is to meet the biological sampling requirements of the study.
- All reasonable measures should be taken to maintain the quality of fish flesh so that it is fit for human consumption.
- Responsibility for disposal must be clearly Unless otherwise explicitly stated then responsibility rests with the MNR.
- Fish for human consumption should be distributed equitably, however this is not a legal requirement. Priority should be given to individuals or groups that are willing to expedite the distribution process.
- Generally, processing of fish for human consumption should be the responsibility of the MNR.
- However, there may be exceptions.
General requirements
- The Fish Disposal Plan should address the following points:
- The name of the index netting project, the lake(s) it is being conducted on, and the timeframe.
- The donation process outlining who, when, where and how fish fit for human consumption will be disposed Plans should document measures taken to find a recipient and the rationale for the donation process (if no recipients were located then should still document efforts in this regard), and responsibility for processing the fish (i.e. filleting etc).
- Efforts that will be taken (by MNR, partner or contractor) to avoid spoilage of It is recognized that in remote situations it may not be possible to keep fish for subsequent donation.
- Criteria to determine whether fish are fit for human May include:
- Species – it may be difficult to dispose of some species of fish for human consumption. For example, most individuals may not be interested in suckers, herring, burbot, If someone is willing to utilize these less desirable species then the plan should outline arrangements for pick up and the number of fish they are prepared to process for consumption.
- Size – although species dependant, small fish (less than 20cm) may be impractical to clean and can be considered for disposal versus donation (unless a recipient indicates desire to process these small fish.
- Contamination – the consumption guidelines outlined in the Guide to Eating Ontario Sport Fish (MOE 1999) should be identified in the plan and Recipients of donated fish should be made aware consumption restrictions or if are from a lake(s) that hasn’t been tested.
- Spoiled – fish are considered unfit for human consumption if gills are white, the flesh is soft or has fungus, or if bones are separating from the flesh.
- Parasites – fish that are parasitized with black spot, yellow grub, fish lice, or gill flukes may be considered fit for human Although the presence of Triaenophorous crassus cysts in whitefish and herring are not harmful to humans their unsightly appearance may render the flesh unsuitable for human Fish that are known to be parasitized with tapeworms such as Diphyllobothrium sp. should not be donated for human consumption.
Example Fish Disposal Plan - Example Lake Nordic Survey Fish Disposal Plan
This Fish Disposal Plan has been prepared for the Nordic netting project to be carried out on Example Lake during the summer of 2001.
Donation
Based on the 2005 Guide To Eating Ontario Sport Fish the following guidelines apply for walleye and northern pike taken from Example Lake:
| Species | Consumption Guidelines | Consumption Guidelines | Consumption Guidelines | Consumption Guidelines | No Consumption |
|---|---|---|---|---|---|
| 8 meals per month | 4 meals per month | 2 meals per month | 1 meal per month | ||
| Walleye | 15-30cm | 30–45cm | 45–55cm | 55-65cm | |
| N. Pike | 25–45cm | 45–65cm | 65-75cm | >75cm |
Note that fish lengths referenced in above table are total length measurements.
The following table identifies the individuals, groups and organisations that were contacted regarding their interest in accepting fish harvested during the Example Lake Nordic netting project. Note conditions regarding acceptance.
| Name | Contact | Prepared to pick up and clean fish | Acceptable Species | Acceptable Size | Deliver cleaned fish only |
|---|---|---|---|---|---|
| Joe Fisher |
| No | Walleye | All sizes | Yes |
| Example Lake First Nation | The Chief | Yes | Walleye, N. Pike, Whitefish | All sizes | |
| Local Homeless Shelter | H. Cook | Yes | Walleye, N. Pike, Whitefish | Fish > 1lb | |
| Ms. J. Doe |
| Not interested in fish donations at this time |
Requirements of MNR and/or Netting Contractor
Fish are to be processed within 3 hours of the net being lifted or else fish will be iced or refrigerated until there is adequate time for biological processing (and cleaning). Fish are to be biologically processed in the following order: walleye > 25cm, N. Pike > 45cm, and whitefish > 1 pound.
Fish will be considered unfit for human consumption when:
- Fish of a species and size are not recommended for consumption by the Guide To Eating Ontario Sport Fish or no recipients are prepared to accept fish from waters that have not been tested.
- Fish that are know to be parasitized with tapeworms, such as Diphyllobothrium sp or Triaenophorous crassus.
- Fish that have gills that are white, flesh is soft or skin has fungus and/or rib bones are separating from the flesh.
- If after a reasonable effort there are no known recipients for certain species or sizes of fish.
Fish offal and all fish not fit for human consumption will be buried as soon as conveniently possible above the high water mark by MNR staff or contractor. Fish should not be buried in areas of human or bear activity. The burial location, numbers and reasons for not making use of the fish flesh will be recorded in the field notes and immediately reported to the compliance supervisor.
Approved by:
(Compliance Supervisor)
(Area Biologist)
Appendix C. Master List of Species Codes and Common Names of Ontario Fish (May 1998)
Appendix D. Nordic Sampling Forms
The following blank copies of the Nordic Sampling Forms are required to record your results in the field and in the laboratory. To facilitate direct photocopying these Forms are full size. Save them as master copies for use in future Nordic projects.
- Nordic Survey Sample Record – Sample Description Form (FN121) and Catch Summary (FN123)
- Nordic Fish Sample Form (FN125)
Appendix E. Total Length – Round Weight Regression Models for Common Fish Species.
A geometric mean predictive regression model [log10Weight (g) = Intercept +Slope•Log10Total Length (mm)] was fitted to logarithmically transformed (base 10) individual observations from Nordic surveys conducted between 1999 and 2004. Only regression models with slopes and intercepts significantly different from 0 (p<0.05) are included in this table.
| Fish Species and Code | Slope | Standard Error | Intercept | Standard Error | Standard Error of the Estimate | Sample Size | R2 |
|---|---|---|---|---|---|---|---|
| Brook trout (080) | 3.1829 | 0.02395 | -5.4178 | 0.05772 | 0.05435 | 277 | 0.98 |
| Lake trout (081) | 3.1530 | 0.00504 | -5.4978 | 0.01296 | 0.05996 | 4418 | 0.99 |
| Splake (082) | 3.2794 | 0.05276 | -5.7720 | 0.13209 | 0.04483 | 17 | 0.99 |
| Lake whitefish (091) | 3.2462 | 0.00821 | -5.6857 | 0.01970 | 0.06966 | 1965 | 0.99 |
| Lake herring (093) | 3.1850 | 0.00518 | -5.5554 | 0.01165 | 0.06704 | 6437 | 0.98 |
| Round whitefish (102) | 3.1346 | 0.04410 | -5.4619 | 0.11088 | 0.04989 | 147 | 0.97 |
| Rainbow smelt (121) | 3.0887 | 0.02965 | -5.4868 | 0.06258 | 0.07916 | 571 | 0.95 |
| Northern pike (131) | 2.9877 | 0.01564 | -5.2029 | 0.04127 | 0.05558 | 385 | 0.99 |
| Central mudminnow (141) | 3.1217 | 0.14147 | -5.2353 | 0.26586 | 0.04774 | 26 | 0.95 |
| Longnose sucker (162) | 3.1159 | 0.00609 | -5.3013 | 0.01396 | 0.04719 | 2085 | 0.99 |
| White sucker (163) | 3.1361 | 0.00244 | -5.3314 | 0.00576 | 0.05141 | 10511 | 0.99 |
| Northern redbelly dace (182) | 2.9984 | 0.01815 | -5.0671 | 0.03417 | 0.10219 | 1555 | 0.95 |
| Finescale dace (183) | 3.3128 | 0.05327 | -5.6172 | 0.09853 | 0.10785 | 412 | 0.90 |
| Lake chub (185) | 3.1366 | 0.01348 | -5.3404 | 0.02642 | 0.09100 | 3718 | 0.94 |
| Golden shiner (194) | 2.9793 | 0.02958 | -5.0161 | 0.05796 | 0.08096 | 852 | 0.92 |
| Emerald shiner (196) | 3.5143 | 0.04304 | -6.0863 | 0.08271 | 0.09076 | 316 | 0.96 |
| Common shiner (198) | 3.4508 | 0.01499 | -5.9193 | 0.02969 | 0.08947 | 2463 | 0.96 |
| Blackchin shiner (199) | 2.6306 | 0.20729 | -4.2674 | 0.38759 | 0.08189 | 19 | 0.90 |
| Blacknose shiner (200) | 3.2252 | 0.03222 | -5.5345 | 0.06174 | 0.11019 | 759 | 0.93 |
| Spottail shiner (201) | 3.0293 | 0.04185 | -5.1686 | 0.07891 | 0.06907 | 509 | 0.91 |
| Sand shiner (204) | 1.6997 | 0.31188 | -2.4782 | 0.57420 | 0.08206 | 27 | 0.54 |
| Mimic shiner (206) | 3.5657 | 0.15556 | -6.1515 | 0.27603 | 0.04052 | 18 | 0.97 |
| Bluntnose minnow (208) | 3.3049 | 0.04030 | -5.6710 | 0.07462 | 0.10687 | 818 | 0.89 |
| Fathead minnow (209) | 3.1540 | 0.04818 | -5.2420 | 0.08816 | 0.07483 | 585 | 0.88 |
| Blacknose dace (210) | 2.9440 | 0.04935 | -4.9948 | 0.09637 | 0.09261 | 228 | 0.94 |
| Longnose dace (211) | 2.5881 | 0.25055 | -4.2820 | 0.47355 | 0.07496 | 17 | 0.88 |
| Creek chub (212) | 3.1543 | 0.01820 | -5.2887 | 0.03828 | 0.06546 | 850 | 0.97 |
| Fallfish (213) | 3.3039 | 0.05579 | -5.6336 | 0.11089 | 0.08723 | 115 | 0.97 |
| Pearl dace (214) | 3.0444 | 0.02035 | -5.1411 | 0.03980 | 0.06782 | 1439 | 0.94 |
| Brown bullhead (233) | 3.1077 | 0.00709 | -5.1442 | 0.01634 | 0.05366 | 2606 | 0.99 |
| Burbot (271) | 3.1772 | 0.01924 | -5.6550 | 0.04759 | 0.07744 | 678 | 0.98 |
| Brook stickleback (281) | 2.3081 | 0.30867 | -3.9693 | 0.51991 | 0.27193 | 175 | 0.24 |
| Threespine stickleback (282) | 2.0308 | 0.20662 | -3.5715 | 0.34330 | 0.14259 | 176 | 0.36 |
| Ninespine stickleback (283) | 2.0710 | 0.17449 | -3.6727 | 0.29380 | 0.11515 | 156 | 0.48 |
| Trout-perch (291) | 3.3307 | 0.03982 | -5.7134 | 0.07563 | 0.06529 | 449 | 0.94 |
| Rock bass (311) | 3.0340 | 0.00560 | -4.8243 | 0.01166 | 0.07248 | 6969 | 0.98 |
| Pumpkinseed (313) | 3.2276 | 0.01096 | -5.2279 | 0.02084 | 0.08120 | 2148 | 0.98 |
| Blue gill (314) | 3.3118 | 0.02769 | -5.4274 | 0.05260 | 0.08161 | 228 | 0.98 |
| Smallmouth bass (316) | 3.0849 | 0.00408 | -5.0980 | 0.00924 | 0.06704 | 5780 | 0.99 |
| Largemouth bass (317) | 3.1028 | 0.03099 | -5.1289 | 0.05479 | 0.16164 | 419 | 0.96 |
| Yellow perch (331) | 3.1307 | 0.00329 | -5.2952 | 0.00668 | 0.07615 | 20600 | 0.98 |
| Walleye (334) | 3.1635 | 0.00470 | -5.4895 | 0.01121 | 0.03995 | 2185 | 0.99 |
| Iowa darter (338) | 2.8383 | 0.36384 | -4.8634 | 0.62130 | 0.13598 | 103 | 0.38 |
| Logperch (342) | 3.2036 | 0.08303 | -5.5181 | 0.15510 | 0.10787 | 237 | 0.86 |
| Mottled sculpin (381) | 2.1282 | 0.66946 | -3.4655 | 1.21340 | 0.11784 | 13 | 0.48 |
| Slimy sculpin (382) | 3.5592 | 0.14492 | -6.0982 | 0.26886 | 0.11895 | 82 | 0.88 |
| Spoonhead sculpin (383) | 3.1040 | 0.20199 | -5.3030 | 0.38193 | 0.10085 | 34 | 0.88 |
Footnotes
- footnote[2] Back to paragraph For a detailed description of collection methods for fish calcified ageing structures refer to: Mann, S.E. 1992. Collection techniques for fish ageing structures (northwest region). Technical Report #73. Ontario Ministry of Natural Resources, Northwest Region Science and Technology Unit, Regional Ageing Laboratory, Dryden, Ontario. 20p.
- footnote[1] Back to paragraph Arithmetic mean (lower and upper 95% confidence interval).
- footnote[3] Back to paragraph One lake (Caswell Lake, 46°52″00′N 80°42″00′W, Sudbury District) was fishless.
- footnote[4] Back to paragraph Most lakes sampled between 1999 and 2004 had low numbers of fish species (generally between 6 and 10 species caught). However, twenty-one fish species were caught in Bear Lake (46°11″21′N 81°27″02′W, Sudbury District).