Create vibrant and complete communities
The Growth Plan promotes the development of complete communities where people can live, work, shop and access services in close proximity. The Growth Plan requires municipalities to plan for a mix of housing types, land uses, employment opportunities and an urban form that supports walking, cycling and transit. These goals are not always associated with specific targets, and in many cases they are to be implemented through official plan policies that are tailored to fit local circumstances.
The indicators in this section are intended to measure attributes of a livable community that support transit and encourage people to walk or cycle to their destinations: a good mix of land uses, amenities that are close enough to walk to, and a well-connected street network.
Mix of housing types
The supporting indicator
The range and mix of housing types (single-detached dwellings, semidetached dwellings, row and town houses and apartments) that have been completed each year in upper- and single-tier municipalities across the Greater Golden Horseshoe, and the mix of the existing housing stock.
Why it matters
A mix of housing types is a component of vibrant and complete communities, and helps to meet the needs for people’s daily living throughout a lifetime. This indicator monitors the year-over-year change in the mix of completed housing units by structure type since 2006, as well as the total mix of existing housing in these areas at five-year intervals corresponding with census periods.
How was it measured?
Housing completion data from CMHC Housing Starts and Completions Survey was examined to measure the mix of new housing units supplied annually in municipalities across the Greater Golden Horseshoe, and how this mix has changed since 2006.
Statistics Canada data on housing stock for 2006 and 2011 was grouped into the same categories to provide a more complete picture of how the overall stock of housing in the region is changing through time.
Results
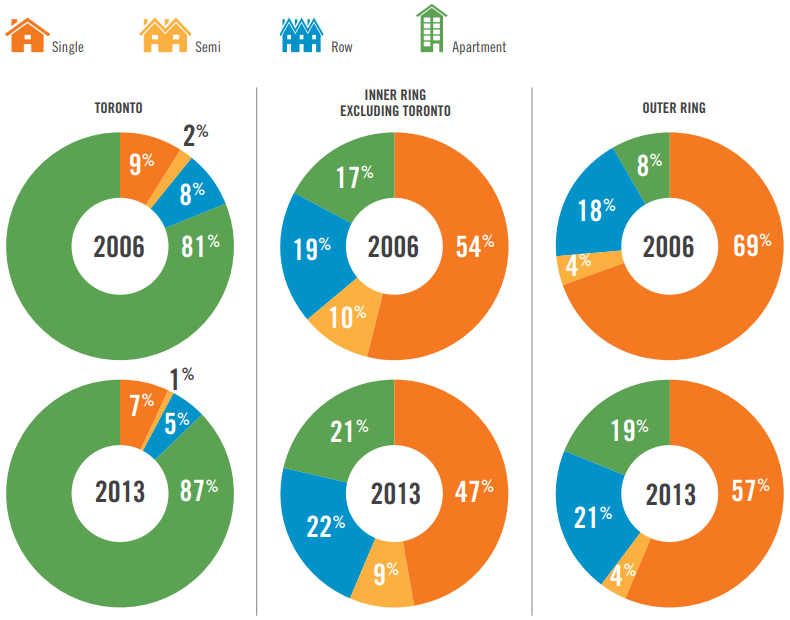
Between 2006 and 2013, there was a shift to higher density development formats across the region, influenced by the strong performance of the condominium sector in the City of Toronto, particularly downtown. There was a corresponding shift in the mix of the existing housing stock between 2006 and 2011. However, given the volume of existing housing, the shift has been more gradual, and shows that, outside of Toronto, single detached dwellings remain the dominant housing type.
Mix of housing – Overall stock in the Greater Golden Horseshoe, 2011
Single
Semi
Row
Apartment
Mix of housing - New units in the Greater Golden Horseshoe, 2006
Single
Semi
Row
Apartment
Mix of housing - New units in the Greater Golden Horseshoe, 2013
Single
Semi
Row
Apartment
Mix of housing – New units in Toronto, rest of Inner Ring and Outer Ring, 2006 and 2013
Note: Percentages may not total 100 per cent due to rounding.
Toronto, 2006 - Single: 9%, Semi: 2%, Row: 8%, Apartment: 81%. Toronto, 2013 - Single: 7%, Semi: 1%, Row: 5%, Apartment: 87%.
Inner Ring excluding Toronto, 2006 - Single: 54%, Semi: 10%, Row: 19%, Apartment: 17%. Inner Ring excluding Toronto, 2013 - Single: 47%, Semi: 9%, Row: 22%, Apartment: 21%.
Outer Ring, 2006 - Single: 69%, Semi: 4%, Row: 18%, Apartment: 8%. Outer Ring, 2013 - Single: 57%, Semi: 4%, Row: 21%, Apartment: 19%.
Mix of overall housing stock in toronto, rest of Inner Ring, and Outer Ring, 2006 and 2011
| Region, Year | Single | Semi | Row | Apartment |
|---|---|---|---|---|
| Toronto, 2006 | 27.3% | 7.1% | 5.6% | 60.0% |
| Toronto, 2011 | 26.3% | 6.9% | 5.8% | 61.0% |
| Inner Ring excluding Toronto, 2006 | 59.1% | 7.0% | 11.3% | 22.6% |
| Inner Ring excluding Toronto, 2011 | 58.5% | 7.2% | 12.2% | 22.1% |
| Outer Ring, 2006 | 69.1% | 4.7% | 6.5% | 19.7% |
| Outer Ring, 2011 | 69.2% | 4.6% | 7.1% | 19.1% |
Considerations
Two different sets of data were used to develop this indicator. The CMHC dataset, which tracks new housing completions, is available annually. The Statistics Canada dataset, from which data on the existing housing stock was derived, is available only at five-year intervals. Direct comparisons cannot be made between the housing completions dataset and the overall housing mix dataset, because their collection methods are different. But together, this data gives a picture of the mix of existing housing in the region, and how it is changing.
Diversity of Land Uses
The Supporting Indicator
The relative diversity of land uses found within urban growth centres and the developing DGA.
Why it matters
A richness and diversity of land uses is an important component of a complete community that enables people to live, work and play in vibrant neighbourhoods.
Looking at land use diversity through time will provide a sense of whether implementation of the Growth Plan is resulting in a greater mix of land uses.
How was it measured?
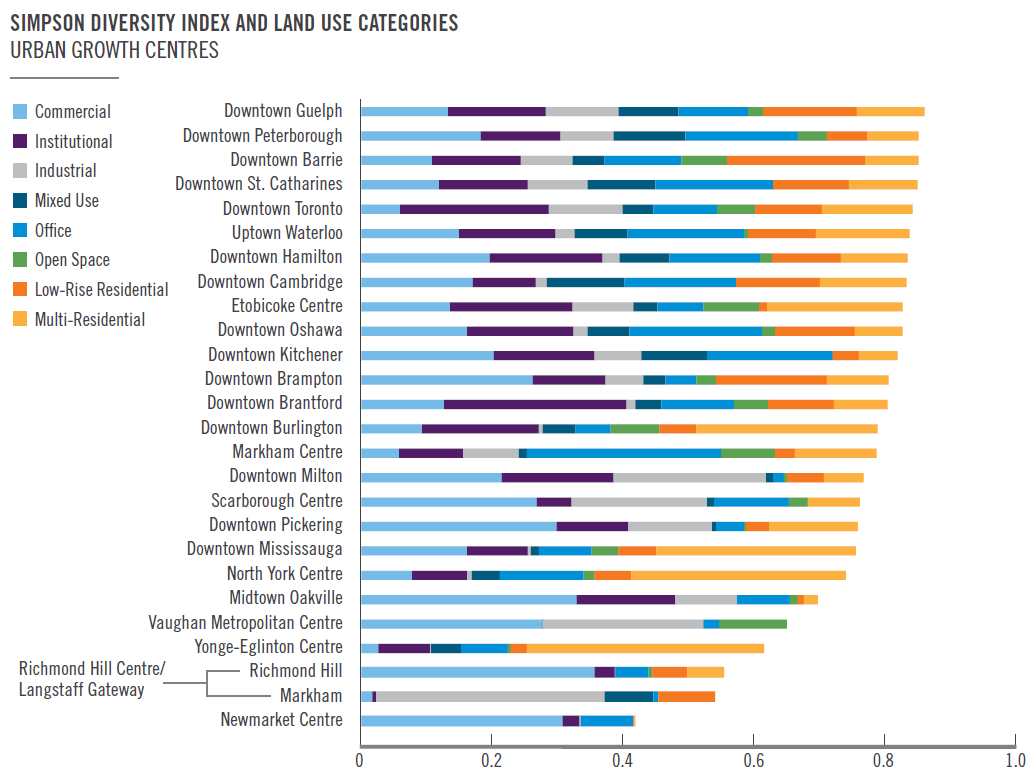
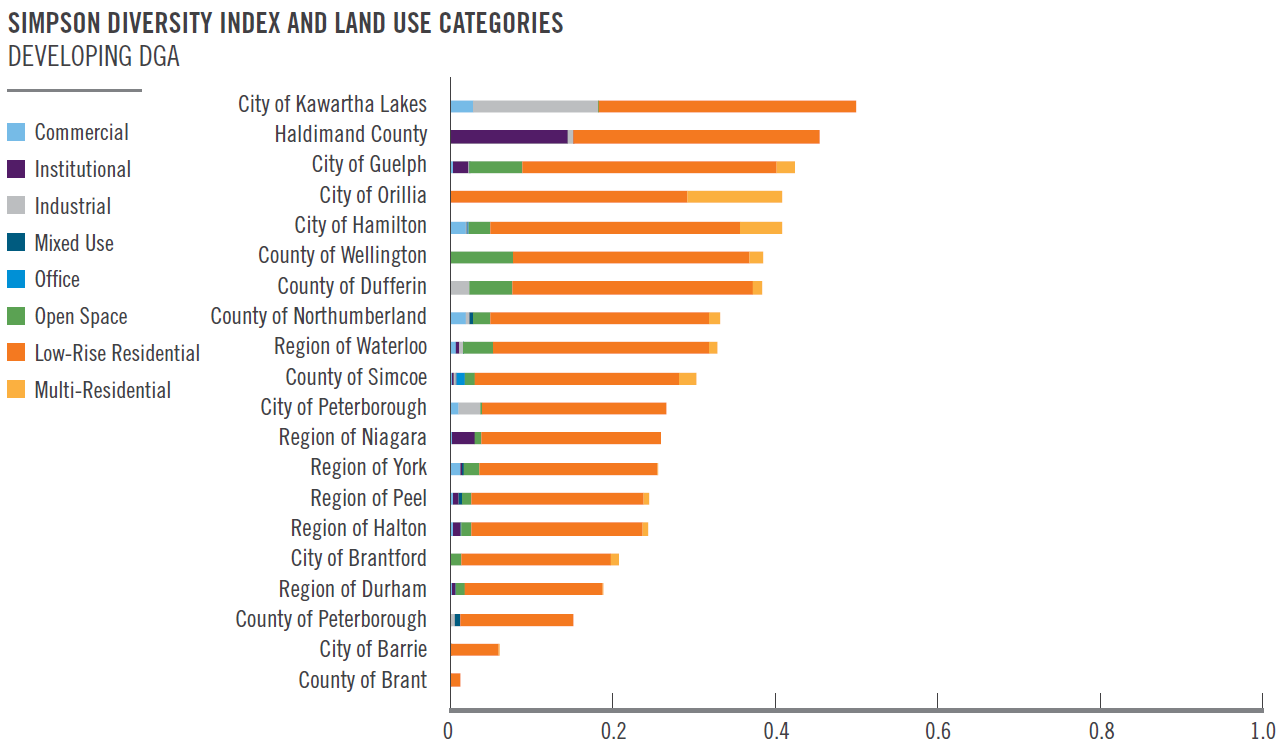
The indicator uses the Simpson Diversity Index (SDI) to provide baseline information on the mix of land uses.
The index measures the relative proportion of eight types of land use: commercial, institutional (including recreational facilities and government buildings), industrial, mixed-use, office, open space, low-rise residential and multiple-family residential. The index is calculated for a specific geographic area by comparing the amount of land in each land use category to the amount of land occupied by all land uses. Values for the index range from 0 to 1: a value closer to 0 indicates that an area is more homogenous and may have only one predominant land use, while a value of 1 would indicate that an area has a more varied and balanced pattern of land uses.
While it is not expected that any given community would score a 1 on the scale, an area with a good mix of residential, commercial, office, mixed use, open space and industrial uses would score higher than an area containing a single land use type.
Results
The figures at right and on the next page show the SDI scores and distribution of land uses for urban growth centres and for the developing DGA of each upper- and single-tier municipality. As would be expected, the SDI values are consistently higher for urban growth centres, which are designed to provide a broader variety of goods and services, than for the developing DGA.
The urban growth centres with the highest diversity values - Guelph, Peterborough, Barrie, St. Catharines, Toronto and Waterloo - are historic downtowns that tend to have many different types of land uses.
It is expected that, through time, the values would increase for the emerging urban growth centres and the developing DGA as more diverse development occurs.
Considerations
MPAC property codes were used to identify land uses. These codes may not always capture the most recent development or the full range of land use on a property. For example, many uses may be contained in one building with one main property code. Another issue is that some MPAC records did not include a property code; these properties were excluded.
The method for estimating the developing portions of the DGA may also have impacted SDI scores. The process is explained in full on page 13, but it involved aggregating census dissemination blocks in order to best approximate existing development in the DGA. This may have excluded some larger parcels where commercial or industrial uses tend to be located.
Land use diversity alone does not create a vibrant neighbourhood. Vibrancy is influenced by a range of other factors, such as population density, the types of commercial and entertainment uses and pedestrian networks, and the quality of the walking environment. The indicator should be considered along with the indicators that measure other aspects of walkable urban form: street connectivity and community amenities.
Community Amenities
The supporting indicator
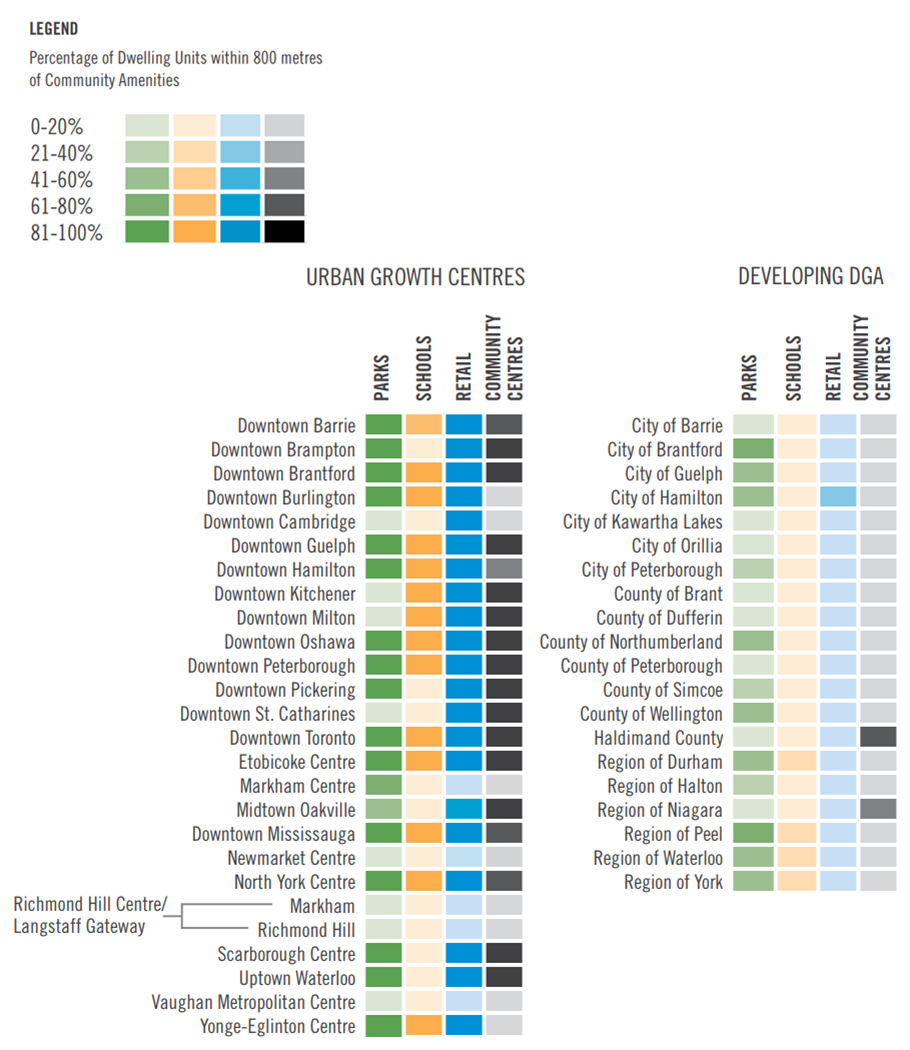
The percentage of the dwelling units in selected areas that are within walking distance of a community centre, park, school and shopping opportunities.
Why it matters
The Growth Plan encourages the development of complete communities that can meet residents’ needs for daily living throughout a lifetime. This includes providing convenient access to an appropriate mix of jobs, local services and a full range of housing, transit and community amenities. The ability to walk to amenities reduces the need to drive and can thus reduce greenhouse gas emissions. This indicator measures the percentage of homes that are within 800 metres (approximate walking distance) of a community centre, park, school and retail uses.
How was it measured?
Community centres, parks, retail uses and schools in urban growth centres and the developing DGA were identified and mapped.
An 800-metre buffer was drawn around each type of community amenity. The number of dwelling units within 800 metres of all four types of community amenities was calculated and converted into percentages of the total number of dwelling units within an urban growth centre or the developing DGA of an upper- or single-tier municipality.
Results
As would be expected, a higher proportion of residential units in urban growth centres were within 800 metres of the selected community amenities than in the developing DGA. In addition, in the developing DGA more residential units were within 800 metres of schools and parks than the other types of amenities, which reflects the character of these areas as newly emerging residential communities.
Percentage of Dwelling Units Within Walking Distance of Community Amenities
Considerations
The indicator should be considered along with the indicators that measure other aspects of walkable urban form: street connectivity and land use diversity.
The use of MPAC property codes for the analysis creates some limitations. MPAC codes typically focus on the main use of a property and may not report on secondary uses, such as parkland associated with a civic building, or retail uses in an office building.
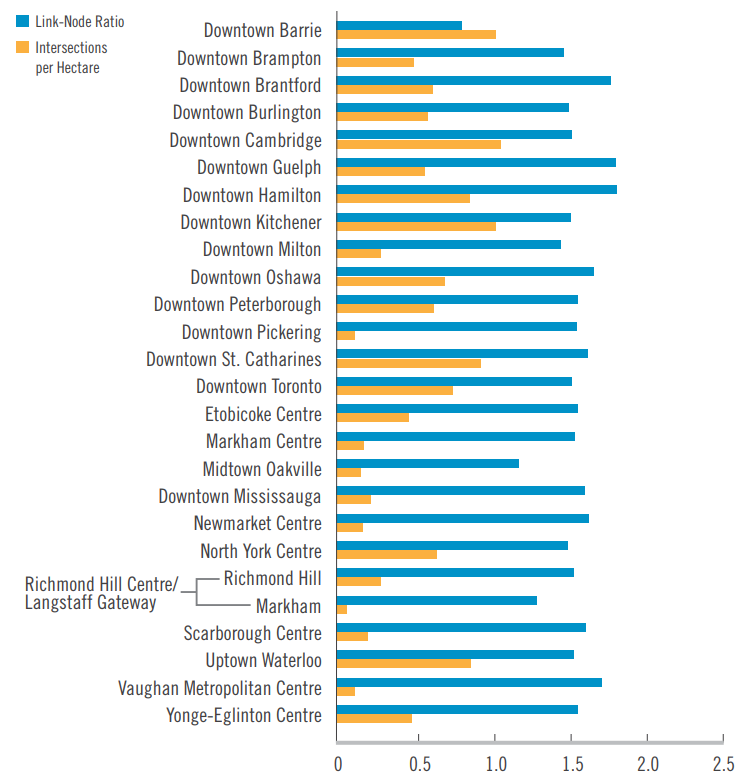
Street connectivity
The supporting indicator
Street connectivity, measured by the number of intersections per hectare and the ratio of connections to intersections (link-node ratio).
Why it matters
The Growth Plan requires planning for the development of communities that are transit supportive and pedestrian-friendly and that provide a mix of amenities to which residents can easily walk or cycle. As connectivity increases, travel distances decrease and route options increase, creating a more accessible network that supports these complete community principles.
How was it measured?
The first component, intersection density, is the number of surface street intersections in a hectare. The more intersections, the greater is the degree of connectivity. The Ministry of Transportation’s Transit Supportive Guidelines recommend that municipalities achieve a street intersection density of greater than 0.3 intersections per hectare, with higher street intersection densities of over 0.6 intersections per hectare in mixed-use nodes and corridors.
The second component, link-node ratio, measures the ratio of road segments (links) to intersections (nodes). A higher number means that travellers have increased route choices, allowing more direct connections for access between any two locations. According to this index, a simple box of streets would score a 1.0. A four-square grid of streets would score a 1.33, while a nine-square grid of streets would score a 1.5. Dead-end streets would reduce the index value.
While there is no accepted standard for link-node ratio, some studies recommend that a score of 1.4 is needed to support a walkable community.
The two measures are complementary. A high link-node ratio suggests good connectivity in the sampled area, but if it is accompanied by a low intersection density, then this could suggest that the area includes some large blocks that may not be very conducive to walking. It may also indicate that there is a lot of undeveloped land in the area. In both cases, we would expect to see change as the areas develop.
Results
Intersection densities for the developing DGA of inner-ring municipalities range from 0.9 to 1.8 intersections per hectare, and for outer-ring municipalities ranged from 0.5 to 2.1. Values for inner-ring urban growth centres ranged from 0.01 to 0.9 intersections per hectare, and for outer-ring urban growth centres ranged from 0.8 to 1.1. Values were highest for traditional downtowns.
Link-node ratios for the developing DGA of inner-ring municipalities ranged from 0.8 to 1.4, and for outerring municipalities ranged from 0.4 to 1.3. Link-node ratios for urban growth centres in the inner ring ranged from 1.2 to 1.8, and for centres in the outer ring ranged from 0.8 to 1.8.
Street connectivity measures: urban growth centres
Street connectivity measures: inner-ring developing DGA and outer-ring developing DGA
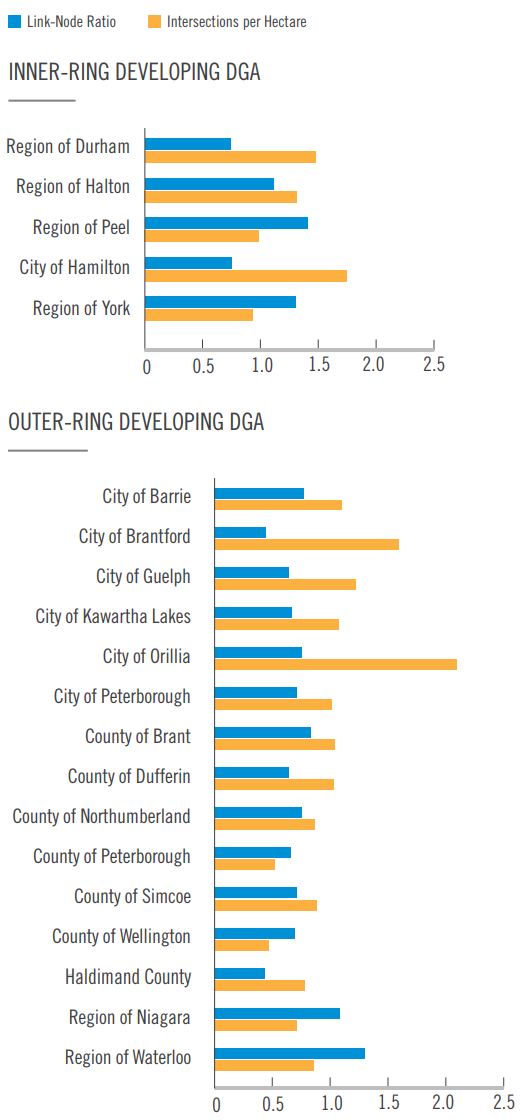
Considerations
This method assumes that every intersection would be a suitable place for a pedestrian to cross the road. Additional information would be required to assess actual pedestrian connectivity, since data on the location of sidewalks or crosswalks is not consistently available.
To the extent possible, public lanes and alleys were included in the calculation. Highways in the 400 series and other limited access highways that are barriers to pedestrians and cyclists were excluded, as were informal pedestrian pathways, such as those cutting through parks, small laneways or walkways between streets.
Private roads (e.g., in shopping centres) were not captured, and it is recognized that in new subdivisions the road network is still developing.
The indicator should be considered along with the indicators that measure other aspects of walkable urban form: community amenities and land use diversity.
Footnotes
- footnote[5] Back to paragraph Taken from Victoria Transportation Policy Institute’s Transportation Demand Management Encyclopedia