Water Quality in Ontario Report, 2012
This third Water Quality in Ontario Report highlights findings from our water monitoring programs that directly relate to the government’s environmental priorities. These include protecting the Great Lakes and Lake Simcoe, toxics reduction, climate change and extending efforts into the Far North.
This report focuses on three main areas of water monitoring:
- nutrient and algal issues
- contaminants
- the effects of climate change
It also features results for other issues that affect water quality, such as invasive species and pathogens.
Acknowledgements
The staff of the Environmental Monitoring and Reporting Branch of the Ontario Ministry of the Environment prepared this report, with contributions from the staff of the ministry’s Communications Branch and Land and Water Policy Branch, and from Laurentian University. We gratefully acknowledge their contributions of data, expertise, advice and comments. The following individuals contributed significantly to the content and organization of the report: John Bailey, Nadine Benoit, Satyendra Bhavsar, Anna DeSellas, Justin Dossett, Rachael Fletcher, Tara George, Jennifer Grixti, Paul Helm, Jocelyne Heneberry, Todd Howell, Vicky Jackson, Chris Jones, Georgina Kaltenecker, Jillian Kingston, Tanya Labencki, Scott MacRitchie, Mohamed Mohamed, Michelle Palmer, Andrew Paterson, Wolfgang Scheider, Janis Thomas, Aaron Todd, Katherine Welch, Huaxia Yao and Joelle Young (Environmental Monitoring and Reporting Branch), Michelle Borthwick, Tom Browne, Anne Edwards, Tiffanie Ing, Denise Jetten and Jeff Powers (Communications Branch), Rachel Melzer (Land and Water Policy Branch) and Bill Keller (Laurentian University). Finally, we would also like to thank our partners for their ongoing work. Without them, valuable monitoring data could not be collected on such a wide scale.
PIBS# 9493e
© 2013, Queen’s Printer for Ontario
Le document Points clés du rapport de 2012 sur la qualité de l’eau en Ontario est disponible en français. Pour en obtenir une copie, veuillez communiquer avec le Centre d’information du Ministère par téléphone, au
For more information on this report, please contact the Ontario Ministry of the Environment and Climate Change at water.monitoring@ontario.ca.
You can also contact the ministry’s Public Information Centre at
Executive Summary
The Ministry of the Environment has been monitoring and protecting water quality for the people of Ontario since 1972. Clean and abundant water resources are the foundation for the quality of life we enjoy in Ontario.
This year’s Water Quality in Ontario Report provides findings from the ministry’s water quality monitoring programs for Ontario’s lakes, rivers, streams and groundwater. The report features results for three main areas of water monitoring: nutrient and algal issues, contaminants and effects of climate change. It also features results for other issues affecting water quality such as invasive species and pathogens.
We measure the quality of Ontario’s water resources throughout the province. Every year we collect thousands of samples of water, sediment and aquatic life. Our laboratories test the samples for hundreds of elements and compounds. These include basic water quality indicators (e.g. pH, calcium and nutrients such as phosphorus) and pollutants (e.g. mercury, lead, PCBs and pesticides).
Our world-renowned water monitoring programs study what is currently affecting water quality in specific areas of the province and track water quality conditions over time. This information contributes to leading-edge science that we commonly publish in scientific journals, technical reports and more recently, the Water Quality in Ontario Reports. Our monitoring data are also available through the data downloads section of the ministry’s website. The ministry also reports on the ongoing work to protect Ontario’s drinking water through the Chief Drinking Water Inspector Annual Report and the Minister’s Annual Report on Drinking Water.
We are continuously improving our monitoring methods and introducing innovative technologies to study the effects of climate change and detect chemicals of emerging concern in the environment.
Our monitoring and research activities help develop policies and programs to protect and improve water quality in Ontario. For example, our monitoring played a key role in tracking the restoration of Jackfish Bay in Lake Superior, setting a goal for reducing phosphorus loading into Lake Simcoe and developing advisories for the safe consumption of Ontario’s sport fish. Ontario has extended its monitoring to the Far North, including areas with recent discoveries of mineral deposits that include chromite.
The findings presented in this report show we are achieving some successes in protecting and restoring parts of the Great Lakes, Lake Simcoe and other water bodies. However, much more work remains.
Thanks to clean up efforts in the north, Spanish Harbour and Jackfish Bay have started their environmental recovery and Peninsula Harbour is steps closer to being restored. Three of 17 Areas of Concern have been delisted; Collingwood Harbour (1994), Severn Sound (2003) and Wheatley Harbour (2010).
Levels of contaminants such as PCBs, dioxins and furans have decreased in Great Lakes fish by as much as 90% in the last four decades. The 2013-2014 Guide to Eating Ontario Sport Fish shows a modest decrease in consumption restrictions compared to the previous guide.
Over a 40-year period, provincial actions to reduce mercury emissions have resulted in lower mercury levels in fish in the Great Lakes, northern inland lakes and the English-Wabigoon River system.
Phosphorus levels in Lake Simcoe, the Great Lakes and some streams and inland lakes in Ontario have declined in response to management actions.
Reductions in the damaging effects of acid rain have led to the recovery of many lakes in central and Northern Ontario.
Our actions are proving effective and Ontario’s water quality continues to improve but population growth and emerging issues, such as invasive species and climate change, are presenting new challenges.
Ontario’s water resources are already experiencing the effects of climate change. Warmer air temperatures have resulted in a shorter ice-cover season in some inland lakes and changes in the types and structure of algae in many lakes in Ontario’s Far North.
In Lake Erie, blue-green algal blooms are re-appearing in the lake’s western and central basins. Also, reported algal blooms have increased in many areas of the province. Algal blooms can negatively affect recreational activities and drinking water. Ministry staff work closely with local public health teams when responding to algal blooms.
Invasive mussels are redistributing nutrients into the nearshore areas of the lower Great Lakes. The Ontario government is monitoring invasive species in the Great Lakes through partnerships with the federal government.
A review of data from two southwestern Ontario streams in agricultural areas suggest that, when compared to 40 years ago, there has been no drop in the amount of nutrients entering streams, while preliminary evidence suggest that in some streams, nutrients may be increasing. Ontario is working with its partners to ensure that agricultural and residential owners reduce phosphorus loads from sources such as fertilizers, animal waste and failing septic systems.
Although levels of some contaminants such as PCBs and dioxins have decreased in Great Lakes fish, some newer commercial chemicals have been found to persist. These include flame retardants and oil and water repellents. Governments and industries have begun to take action by banning or phasing out the use of some of these chemicals and monitoring is ongoing.
Calcium monitoring results are reported for the first time in this year’s Water Quality in Ontario Report. Calcium levels in Ontario’s inland lakes are going down due to acid rain, timber harvesting and regrowth. Lower calcium levels are already affecting calcium-rich organisms such as zooplankton. The ministry has increased its monitoring efforts to better understand the impacts of changing calcium levels.
Nutrient and Algal Monitoring
Routine monitoring of nutrient inputs began in the 1960s with weekly monitoring of algal concentrations in raw water samples from water treatment plants throughout the Great Lakes.
The ministry currently has several programs that monitor nutrients and algae in the Great Lakes, inland lakes and streams. In this and previous Water Quality in Ontario Reports, data have shown some decreases in phosphorus levels in some Ontario lakes, rivers and streams.
While phosphorus levels in some of Ontario’s water bodies have decreased over time, we are still facing significant challenges and need to reduce phosphorus inputs into our waters. The ministry is continuing to work with its partners on these issues.
Phosphorus Monitoring in Lake Simcoe
The ministry, in partnership with the Ministry of Natural Resources and the Lake Simcoe Region Conservation Authority, has been monitoring the ecological health of Lake Simcoe since the 1970s. Currently, sampling occurs at 10 water quality sampling stations.
Four decades ago, Lake Simcoe had problems with excessive growth of plants attached to the lake bottom near the shoreline and of small, free-floating plants called phytoplankton in the open water.
Starting in the 1980s, initiatives began to reduce the amount of phosphorus entering the lake. The improvements in deepwater dissolved oxygen mean that naturally produced Lake Trout are being caught again in the lake.
The Lake Simcoe Water Quality Update, released in May 2010, has more information on three decades of Lake Simcoe water quality trends. The ministry recently released the Minister’s Annual Report on Lake Simcoe, 2011-2012. The report shows that significant progress has been made to enhance the shoreline, lower phosphorus levels and encourage the return of native Lake Trout.
Algal Blooms in Ontario
Algal blooms are a concern in Ontario lakes and rivers. Nuisance algal growth can be unsightly and cause taste and odour issues. Blooms of cyanobacteria — technically a bacteria, although commonly called blue-green algae — are of particular concern since many species produce toxins that can affect the health of humans and other animals. Excessive algal growth can affect drinking water, recreational activities like swimming and fishing, and shoreline property values.
Human activities and the resulting nutrient enrichment, climatic warming, acidification and the spread of invasive species can all promote algal growth and worsen blooms. Ministry scientists are studying algal blooms to understand the factors that control algal behaviour and growth. Their work will contribute to actions needed to reduce the occurrence of algal blooms.
Actions to promote good water quality, particularly nutrient reduction efforts, will continue to be essential to reduce the extent of algal blooms in Ontario.
Monitoring contaminants
The ministry routinely monitors for contaminants in our water and works closely with partner organizations to share scientific expertise and to coordinate efforts in our environmental monitoring programs.
Long-term monitoring programs provide the scientific information necessary to identify emerging issues, evaluate regulatory actions and remediation efforts and develop new policies and regulations.
Our program data shows government actions to ban and limit contaminants have resulted in long-term decreases in many contaminants in Ontario’s water resources.
While we have made progress in reducing some contaminants in Ontario’s water, more work is needed to further reduce toxic emissions and clean up contaminated areas in lakes and streams.
Through working with our partners, we have achieved measurable success in cleaning up contaminated areas in the Great Lakes basin like Collingwood Harbour, Severn Sound, Wheatley Harbour and Peninsula Harbour where extensive clean up actions have brought us closer to restoring local water quality.
Climate Change
Ontario’s water resources are likely to experience the effects of climate change. In some inland lakes, warmer air temperatures have resulted in shorter ice-cover seasons. Lower water levels and warmer water temperatures may also affect the quality of our lakes and rivers.
Ontario is working closely with communities, industries and researchers to reduce greenhouse gases and to develop adaptation strategies. For a more detailed explanation of our strategies, see Ontario’s Climate Change Progress Report for more information.
This report presents monitoring data that documents more effects of climate change on Ontario’s lakes, streams and groundwater.
Other Issues Affecting Water Quality
While the ministry’s monitoring programs focus on studying the effects of nutrients, contaminants and climate change on Ontario’s water, we also work with our many partners to examine other issues that affect water quality such as invasive species and the presence of pathogens and other microbial contamination that may present a risk to human health.
The ministry conducts ongoing monitoring of pathogen contamination in a variety of water sources in Ontario. In the summer months, local health units throughout Ontario regularly test water at bathing beaches and post signs if the beaches are not safe for swimming. People should check with local health units before swimming.
While there have been improvements, all of us still need to do more to protect Ontario’s water quality from new and ongoing problems by:
- Continuing our efforts to reduce phosphorus levels to discourage excessive algae growth and decrease harmful blue-green algal blooms
- Taking ongoing actions to reduce toxic emissions and clean up contaminated areas in lakes and streams
- Continuing our efforts to clean up the Great Lakes
- Taking actions to reduce the effects of climate change and prevent the spread of invasive species
The Ministry of the Environment’s monitoring and reporting programs provide essential information to help protect water quality in Ontario.
1.0 Introduction
Ontario is a large province covering over one million square kilometres. Freshwater occupies one-sixth of this total area — the largest proportion of all provinces and territories in Canada. Our lakes, rivers, streams and groundwater are essential to our health, our environment and our economic prosperity. They supply our drinking water and are home to many plant and animal communities. They also play a vital role in industry, agriculture, recreation and food processing.
Given its importance, everyone in Ontario has a role to play in protecting our water. The Ministry of the Environment is taking action on many fronts to conserve and protect Ontario’s water resources through its world-renowned water monitoring programs.
Our water monitoring programs provide information about ambient water quality conditions and trends across the province. This information contributes to leading-edge science that we commonly publish in scientific journals, technical reports and more recently, the Water Quality in Ontario Reports. Our monitoring data are also available through the data downloads section of the ministry’s website.
Our monitoring programs are a result of the collaborative work with our many partners. These relationships help us maintain and increase our scientific and technical expertise, expand the scope of our programs, interpret and report findings in a timely manner and keep abreast of new research.
The ministry takes the approach that the best science will lead to best practices. Our programs and policies aimed at improving and protecting our water quality are based on the best science available. Strict monitoring and careful interpretation of the data collected allows our scientists to work with their many science partners, our program and policy divisions and the public to design legislation, regulations and even new monitoring technology to ensure our environmental management actions are supported by hard evidence.
This third Water Quality in Ontario Report highlights findings from our water monitoring programs that directly relate to the government’s environmental priorities. These include protecting the Great Lakes and Lake Simcoe, toxics reduction, climate change and extending efforts into the Far North. This report focuses on three main areas of water monitoring: nutrient and algal issues; contaminants; and the effects of climate change. Another chapter focuses on other issues that affect water quality, such as invasive species and pathogens.
This report has technical information and uses words and terms specific to water quality management that may not be familiar to all readers. There is an explanation of these in the Words and Terms section at the end of the report.
If, after reading this report, you have any questions or would like more information, please contact the ministry by email at water.monitoring@ontario.ca or call the ministry’s Public Information Centre at
Ontario borders on four of the five Great Lakes. We have more than 250,000 lakes and 500,000 kilometres of rivers and streams, and vast groundwater resources.
1.1 Water Quality in Ontario
Ontario’s geology has shaped its regional land use patterns and water-quality conditions. Northern and southern Ontario have different geology and land use. In southern Ontario, the sedimentary rocks and overlying glacial deposits have created thick, nutrient-rich soils that are ideal for agricultural development. Three of the five Great Lakes (Huron, Erie and Ontario) surround southern Ontario. As a result, there is dense population and industrial, agricultural and urban usage. This has led to a range of human-induced water quality problems, including excessive loading of nutrients and the release of toxic substances into Ontario’s water bodies.
In contrast, thin soils typically cover the Canadian Shield region of Northern Ontario. There is poor drainage and the region is largely undeveloped. The rocks of the Canadian Shield contain the large mineral deposits that are so important to Ontario’s economy. A few urban areas have developed around the mining and forestry industry, and there are seasonal cottages on the shores of some of the lakes in this region. Despite the Shield’s lower population density, water quality issues also affect it. In particular, the soft water of the region’s lakes and wetlands is especially vulnerable to the effects of acid deposition and excess nutrients.
The Hudson Bay Lowlands are north of the Shield. They cover part of Ontario’s Far North region. This northernmost area of Ontario reaches to the shores of Hudson Bay and James Bay. Its characteristics are poor drainage, wetland domination and small, sparsely populated settlements along the Hudson Bay shores. The aquatic ecosystems that make up the Shield and the rest of the Far North region are potentially vulnerable to various stressors. These include resource extraction (e.g. mining and forestry) and climate change.
Like the Far North’s aquatic ecosystems, water quality across the rest of the province is also susceptible to climate change. The last few decades have seen a connection between increased water temperature in Ontario lakes and increased air temperatures caused by climate change. Average temperatures could rise by as much as 8°C over the next century. A warmer climate could result in milder winters and longer growing seasons. There could also be more frequent severe weather events, such as storms, floods, droughts and heat waves.
1.2 The Ontario Government’s Role in Protecting Water Quality
Ontario has some of North America’s most rigorous programs and legislation to protect water quality. Our water protection actions are founded on science and are often ecosystem- or watershed-based. We work with a range of partners to protect, restore and preserve water quality using best practices and best science.
The Ontario Water Resources Act is a key piece of legislation. The act is designed to conserve, protect and manage Ontario’s groundwater and surface water.
Ontario’s Great Lakes Strategy is Ontario’s road map to protect the Great Lakes. It outlines the challenges affecting the lakes, and complements Ontario’s Great Lakes protection and restoration actions under the Canada-Ontario Agreement.
The Safeguarding and Sustaining Ontario’s Water Act protects in law a historic agreement that Ontario, Quebec and the eight Great Lake U.S. states signed in 2005 to strengthen the existing ban on water diversions out of the Great Lakes-St. Lawrence River, Nelson and Hudson Bay basins.
The Lake Simcoe Protection Act and the Lake Simcoe Protection Plan, the first plan of its kind in Ontario, focus on improving Lake Simcoe’s water quality, protecting the wider watershed’s natural heritage and resources, and managing the effects of climate change and invasive species. The Lake Simcoe Phosphorus Reduction Strategy aims to reduce phosphorus levels by almost 40%.
The Clean Water Act ensures that safeguarding source water is the first line of defense in protecting Ontario’s drinking water. The act results in locally developed, science-based, collaborative actions to protect sources of drinking water.
The Far North Act is the foundation for land-use planning that protects the unique ecology and vast boreal environment of Ontario’s far north forests and peat lands.
The Water Opportunities and Water Conservation Act sets a path to help Ontarians use water more efficiently and further develop and market clean water technology and services to Canada and the world.
Helping regulated facilities use fewer toxic substances and move to safer alternatives with the Toxics Reduction Act is part of the province’s toxics reduction program and reduces the amount of toxins entering our water supply.
The Cosmetic Pesticides Ban prohibits the sale and use of certain pesticides for cosmetic purposes on lawns, gardens, parks and schoolyards.
Did you know?
Ontario’s ban on over 100 cosmetic pesticides, including certain kinds of herbicides, fungicides and insecticides, is one of the toughest in the world. Levels of three common lawn care pesticides decreased by about 80% in urban streams in the first year of Ontario’s cosmetic pesticides ban.
Much of the scientific information that forms the basis for Ontario’s water quality protection legislation and regulations is directly due to the ministry’s monitoring and reporting programs. The next chapter of this report has details on our programs.
How Science Leads to Action
Many areas of policy development rely on the province’s water science. For example, Great Lakes scientists and policy makers work together to ensure that science is part of the policy decision-making process. Policy decisions also help set priorities for research, monitoring, analysis and reporting.
Recent findings on the Great Lakes’ “nearshore shunt”1 are an example of how science contributes to policy development. Ministry of the Environment scientists, collaborating with others around the Great Lakes, were able to link some changes in the Great Lakes environment — such as excessive algae along coastlines — to the invasion of non-native zebra and quagga mussels. They found that the mussels are trapping nutrients along the lake bed in the nearshore. This and phosphorus loads stimulate excessive algae growth. So, although there are low nutrient levels in open waters, there continue to be high levels of nutrients in nearshore areas. This leads to algal masses. Monitoring and investigative research also identified different algae problems and different sources of excessive nutrients in parts of Lake Huron, Lake Erie and Lake Ontario.
In its focus on these areas, the December 2012 release of Ontario’s Great Lakes Strategy reflected this understanding of the particular vulnerability of nearshore areas. The Great Lakes Strategy describes the nearshore shunt and the effects of invasive mussels. It highlights algae concerns in specific areas of the Great Lakes, and proposes actions to deal with these problems and prevent future unwanted invasive species.
2012: An Important Year for Great Lakes Protection
In 2012, the Ontario government released Ontario’s Great Lakes Strategy and introduced the Great Lakes Guardian Community Fund. The Great Lakes strategy proposes future actions to protect and restore the Great Lakes. The Great Lakes Guardian Community Fund helps communities protect their part of the Great Lakes.
2012 also marks the 40th anniversary of the Great Lakes Water Quality Agreement (GLWQA). First signed by the United States and Canada in 1972, this international agreement reflects the two countries’ commitment to resolve a wide range of water quality issues facing the Great Lakes and shared sections of the St. Lawrence River. Amendments to this agreement were signed on September 7, 2012.
Quick Facts
- More than 98% of Ontario residents (13 million people) live in the Great Lakes-St. Lawrence basin.
- More than 80% of Ontarians get their drinking water from the Great Lakes.
- 80% of Ontario’s electricity is generated with the help of Great Lakes waters.
- The Great Lakes basin is home to over 150 native species of fish and 3,500 species of plants and animals.
2.0 Water Quality Monitoring
2.1 The Importance of Water Quality Monitoring
Through monitoring and science, the ministry is able to identify the causes of problems and emerging environmental issues, develop and test options to address these issues, set environmental standards, implement and regulate policies and report on the state of the environment (Figure 2.1).
The ministry monitors Ontario water quality to also measure the impact of human activities, provide input into proposed programs and actions and track the effects of remediation.
The ministry’s Environmental Monitoring and Reporting Branch leads the province-wide programs that monitor water quality in the Great Lakes, Lake Simcoe, inland lakes, rivers, streams and groundwater. We run both short-term (fewer than five years) and long-term (decades) water quality monitoring programs that study the effects of contaminants on specific sites and track conditions in the environment over time.
Figure 2.1: The role of science and monitoring in managing environmental health (text below)
Identification
Identification and Understanding of Emerging and Existing Issues
- Research
- Monitor
- Developing new technologies
Development
Develop Policy
- Assess options
- Standard settings
- Legislation
- Regulation development
Implementation
Program Development and Implementation
- Develop programs
- Deliver program (includes approvals, permitting and compliance)
- Monitor and assess condition
Compliance/Investigations
- Resolve pollution problems
- Ensure compliance
- Implement policy & regulations
Stage 4 Evaluation
Policy Evaluation
- Assess effectiveness
- Monitor and report
| Water Source | Program Description |
|---|---|
| Great Lakes | An extensive program to monitor the nearshore area for algal productivity, nutrient cycling, contaminant levels in sediment and fish, and the health of bottom-dwelling aquatic invertebrate communities. |
| Inland Lakes | Partnership-based programs to monitor the quality of cottage and shield lakes, recovery of acid-rain impacted lakes in the near-north, fish contaminant levels in lakes featuring recreational fisheries, algal productivity and the structure of bottom-dwelling aquatic invertebrate communities. |
| Lake Simcoe | A comprehensive program with a focus on sources and levels of nutrients, algal productivity and the link to dissolved oxygen levels critical to the objectives of maintaining coldwater fish habitat. Collaborate on many research projects to investigate other stressors affecting the lake such as pathogens, climate change, invasive species and contaminant loads. |
| Rivers and Streams | Partnership-based programs to assess the impacts of urbanization and agriculture on stream water quality, the structure of bottom-dwelling, aquatic invertebrate communities and contaminant accumulation, including emerging substances like pharmaceuticals released by sewage treatment plants. |
| Groundwater | A partnership program with Ontario’s conservation authorities to assess long-term trends in groundwater quality and quantity, with an emerging focus on climate change impacts on Ontario’s aquifers. |
| Drinking Water | A research program run in partnership with municipalities and other drinking water plant operators to assess new and emerging trends of substances in support of setting standards to protect Ontario’s drinking water. |
| Far North | A new program to better understand the quality of the lakes, rivers and streams of the Far North. |
The Water Quality in Ontario 2010 Report has information on these programs. Some of these monitoring programs have operated for over 40 years, providing the ministry with an extensive record of water quality information. For example, we have been monitoring Great Lakes nearshore water quality year-round from 17 municipal water treatment plant intakes since the 1960s. The data from our Great Lakes Water Intakes Monitoring program are used to measure changes in water quality in response to management actions such as phosphorus controls and environmental stressors in the Great Lakes basin such as climate change.
Similarly, we have been monitoring water quality in rivers and streams across Ontario since 1964 through our Provincial Water Quality Monitoring Network. Over 400 locations are currently monitored in partnership with Ontario’s Conservation Authorities, participating municipalities and provincial parks. More recently, special studies have been implemented in agricultural and urban watersheds to collect additional information in support of source protection planning, nutrients, road salts and pesticides management. Recent data (2002-2011) from this program are available for download on the ministry’s data downloads page.
Every year, our programs collect thousands of samples of water, sediment and aquatic life. The types of samples that are collected vary based on the objectives of each monitoring program. Monitoring objectives influence all aspects of the design of monitoring programs from the monitoring duration, frequency, timing and location of sample collections to data analysis, interpretation and reporting.
For example, water samples collected from Ontario’s lakes and streams are analyzed for phosphorus and nitrogen levels to assess the impacts of nutrient sources and the potential for excessive plant growth and algae blooms. Also, tissue samples from fish are collected and analyzed for a variety of substances that persist in the environment and have the potential to bioaccumulate through the food web such as metals (e.g. mercury) and organic contaminants (e.g. PCBs). Results are compared to human health guidelines to provide consumption advice for Ontario sport fish, which is available through the ministry’s Guide to Eating Ontario Sport Fish — a publication that we have been producing since 1977.
For information on how we collect and analyze water, sediment and aquatic life samples, please see the Water Quality in Ontario 2008 Report (Chapter 2, pages 4 to 7).
Our scientists and technical field staff use a variety of methods to survey a lake over a field season.
Conventional monitoring methods include the use of portable sensors to measure physical and chemical properties of water such as water temperature, turbidity, dissolved oxygen and pH. Staff can also use other approaches. For example, remote sensors are used to collect high resolution environmental data from above and below the water surface and transmit it in near real-time to the ministry for analysis.
Our Great Lakes monitoring programs use sensors, such as the Acoustic Doppler Current Profilers (ADCPs), to measure water currents and wave action (Figure 2.2). ADCPs collect longer-term information throughout the day and over many months. This and data that other sensors collect (e.g. on water temperature, turbidity, oxygen and conductivity, chlorophyll and levels of light for aquatic vegetation) provide an understanding of the features of water quality related to storms and other events that can be difficult to collect with traditional field surveys.
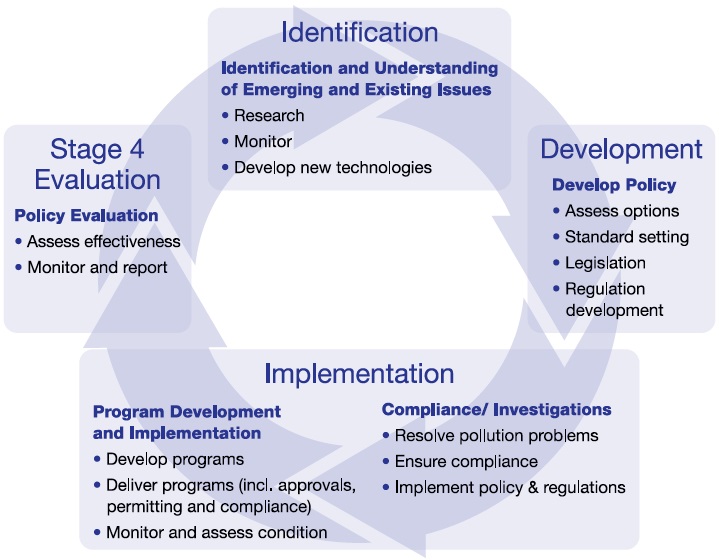
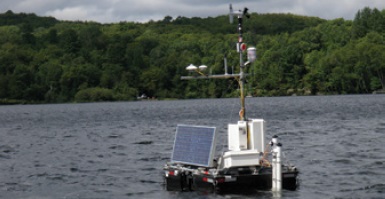
We have also used the Land Ocean Biophysical Observatory (LOBO) in Lake Ontario (Figures 2.3a and 2.3b). LOBO is a monitoring buoy that collects a range of physical and water quality data in real time that the ministry retrieves online.
More recently, our Inland Lake Monitoring program put a sophisticated monitoring raft known as THELMA (The Harp Environmental Lake Monitoring Ark) into Harp Lake (Figure 2.4). THELMA collects a variety of water quality data from Harp Lake. The data support climate change modelling, water budget setting, and mixing and circulation pattern studies.
These are innovative environmental monitoring methods that enable us to improve our understanding of nutrient loading and algal blooms. This makes it possible to monitor changing environmental conditions in the Great Lakes and other lakes more closely, and improve our understanding of and ability to manage emerging environmental issues.
The ministry’s Laboratory Services Branch supports water-monitoring activities through its sample analysis activities. Every year, our laboratories analyze thousands of samples and test them for basic water quality parameters (e.g. pH and hardness) and for signs of pollution such as nutrients, metals (e.g. mercury and lead) and organic compounds (e.g. PCBs and pesticides).
Our analytical methods are continually evolving. We are now able to measure contaminants at lower levels. For example, we can detect and monitor emerging contaminants of concern, such as pharmaceuticals and flame retardants, that we couldn’t detect before.
Figure 2.2: Deployment of an Acoustic Doppler Current Profiler (ADCP) on the lakebed of Lake Ontario for the 2009 survey season
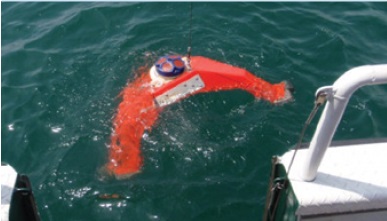
Figure 2.3A: Land Ocean Biophysical Observatory (LOBO) in Lake Ontario
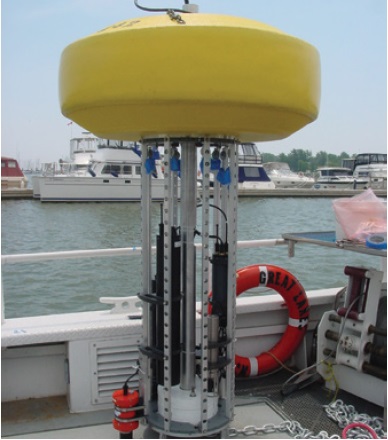
Figure 2.3B: Land Ocean Biophysical Observatory (LOBO) in Lake Ontario
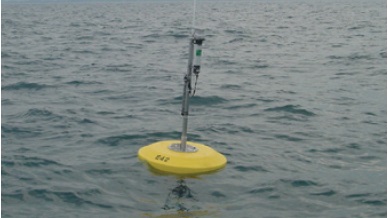
Figure 2.4: THELMA (The Harp Environmental Lake Monitoring Ark) deployed into Harp Lake in 2010
2.2 Water Quality Monitoring Partnerships
Many partners contribute to the success of our monitoring programs: the federal government, other provincial ministries, municipalities, conservation authorities, academic institutions, environmental organizations, industry, First Nations and volunteers.
The next section of this report has an example — one of many — of how the ministry’s partners are helping collect valuable water quality information to inform future decisions and actions.
The appendix of the Water Quality in Ontario 2010 Report has information on some of the ministry’s programs and the partners that support them.
Partnerships in Water Quality Monitoring in Inland Lakes in the Far North
Ontario’s Far North is unique, with huge volumes of freshwater draining to the marine environments of Hudson Bay and James Bay. The aquatic ecosystems in the Far North are potentially vulnerable to various stressors. These include resource extraction, such as mining and forestry, hydro dam development, access road construction and climate change.
To understand how these systems might change in the future and how to protect them, it is important to understand what they are like now and how they have already changed. Our ongoing work will inform future programs and action plans once we have determined where and when actions are required and the best course to be taken.
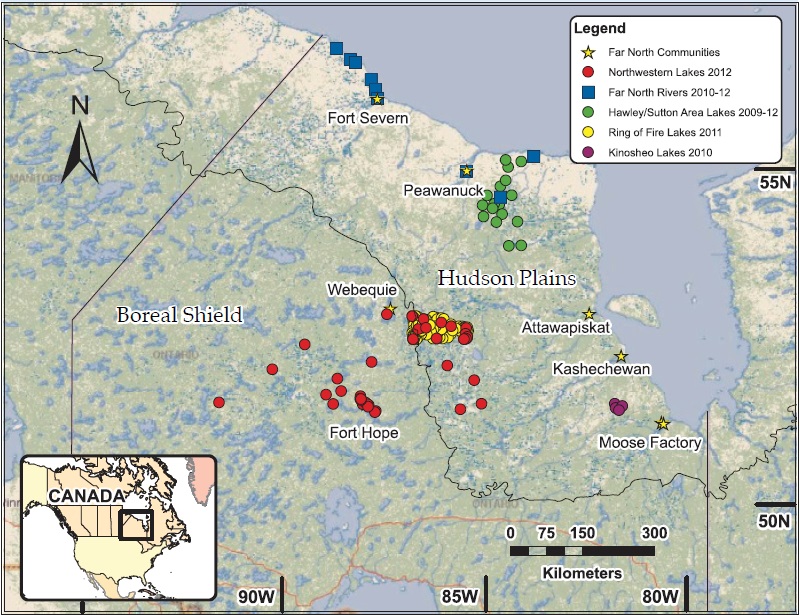
There is limited information on the state of lakes and rivers in the Far North of Ontario. Aquatic studies are currently underway in three main Far North areas (Figure 2.5): Hawley Lake area, Ring of Fire area and northern rivers. The information from these studies will be available to all stakeholders, including First Nations, government agencies and industry, who are participating in the management and protection of the region’s water resources.
The water quality studies in the Far North are a collaborative effort between scientists from the Ontario government (the Ministry of the Environment, the Ministry of Natural Resources, and the Ministry of Northern Development and Mines and its Ontario Geological Survey branch) and a number of universities (Laurentian, Queen’s, Ottawa, Trent, Wilfrid Laurier, Carleton and Toronto). Water quality information is also being collected in collaboration with members of First Nation communities.
Hawley Lake Area Studies
During the summers of 2009 to 2011, the ministry and its partners from Laurentian University, Queen’s University and the University of Ottawa conducted sampling in the area of Hawley Lake, near the Hudson Bay Coast east of the community of Peawanuck. This sampling focused on the chemistry and biology of 17 lakes in the area and will help develop a scientific understanding of northern aquatic ecosystems. Ministry staff used samples from some or all of the lakes to help evaluate the biology (zooplankton, phytoplankton and benthic invertebrates) and chemistry (water chemistry and mercury concentrations in fish and sediments). Collecting lake sediment cores made it possible to reconstruct past environmental conditions (see section 5.4) and examine changes in microbial communities and the effects on mercury cycling.
Sample and data analyses are still underway. These data will enable the ministry to understand the current status of these ecosystems and assess their vulnerability to future changes. This information will be shared with all stakeholders and the public.
Ring of Fire Area Lake Surveys
The Ring of Fire region of northwestern Ontario is the site of recent discoveries of mineral deposits, particularly chromite, that are used in the production of stainless steel. Plans have been proposed to mine these deposits in the coming years.
In August 2011, 98 lakes were sampled in collaboration with the Ministry of Northern Development and Mines’ Ontario Geological Survey branch. The lakes were sampled in a block running through the Ring of Fire area near the community of Webequie and through the transition between the Hudson Bay Lowlands and the Boreal Shield.
The Ontario Geological Survey conducted geochemical analyses of water and sediment samples while the ministry conducted additional water analyses. Queen’s University is conducting paleolimnological analyses of recent and past sediments. Laurentian University is examining the relationships between water chemistry and landscape characteristics.
In July 2012, Laurentian and Queen’s universities conducted additional chemical and biological lake surveys on 29 lakes in northwestern Ontario around the Ring of Fire area. This study was developed in collaboration with the First Nation communities at Fort Hope, Neskantaga and Webequie.
Northern Rivers Studies
Fish is an important staple in the diets of many northern First Nation communities. In 2011, fish were collected from the Winisk and Severn Rivers, two of the North’s major rivers. The fish were analysed for mercury and other contaminants. Members of the communities of Peawanuck (Winisk River) and Fort Severn (Severn River), the two most northerly First Nations communities in Ontario, conducted the fish sampling and field fish processing. The study targeted the three species of fish these communities eat most often: Common Whitefish, White Sucker and Pike. Also, there were chemical and biological surveys on the five main coastal rivers — Pipowatin, Tamuna, Majikan, Black Currant and Mintiagan — that the community of Fort Severn uses for harvesting Brook Charr. These surveys were a collaboration with the community and researchers from Laurentian University and the ministries of the Environment and Natural Resources.
The study completed chemical sampling and benthic invertebrate sampling, following the ministry’s Ontario Benthos Biomonitoring Network standards on all five rivers. For four of the rivers, the study collected fish for contaminant analyses. When available, the results from all the northern rivers fish sampling will be reported to First Nation communities.
Figure 2.5: Far North lake and river sites sampled through Ministry of the Environment partnerships, 2009 to 2012
2.3 Celebrating 40 Years of Monitoring the Great Lakes (1972 to 2012)
By the 1970s, the Great Lakes had widespread pollution problems. Lake Erie was declared “dead” due to oxygen depletion at the bottom of the lake. Toxic chemicals were linked to bird deformities and inedible fish.
The Ministry of the Environment was established in 1972 to deal with these problems.
Since then, the ministry’s monitoring and research activities have identified and tracked water quality issues, contributed to important environmental decisions and measured improvements in water quality. Over the years, the ministry has fine-tuned its monitoring programs to track new issues as they emerge.
The water quality monitoring programs show improvements over the past four decades in Great Lakes’ water quality. However, there is more work to do. Current pressures are slowing progress in restoring and protecting the Great Lakes. Here are some key Great Lakes water monitoring milestones.
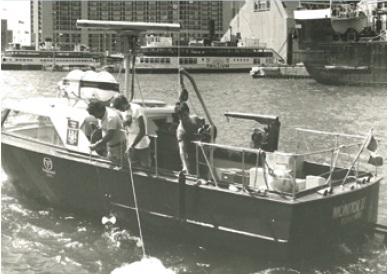
Figure 2.6: Sampling in Toronto Harbour aboard the Monitor II, circa 1978
1972 to 1982: Broad Scale, Intense Water Sampling Surveys
From 1972 to 1982, pollution problems plagued the Great Lakes. Problems ranged from widespread blue-green algae blooms in Lake Erie and Lake Ontario due to too much phosphorus, to deformities in fish-eating birds from pesticides like dichlorodiphenyl-trichloroethane (DDT). In the late 1970s, Ontario banned the production of PCBs and restricted DDTs.
The former Ontario Water Resources Commission, a predecessor of the Ministry of the Environment, established the Great Lakes Monitoring Program and the Great Lakes Survey Program (GLSP) in the 1960s and both were used in the 1970s and 1980s to deal with these problems (Figure 2.6). These programs involved broad-scale, intense water surveys:
- The GLSP monitored over 240 tributaries, primarily focusing on determining phosphorus loads to the Great Lakes.
- Monitoring results from various studies around the Great Lakes prompted Canada and the United States to take action. In April 1972, the Great Lakes Water Quality Agreement was signed. Its aim was to control sewage and phosphorus discharges and to identify toxic substances in the Great Lakes.
- The ministry implemented the Great Lakes Water Intake Monitoring Program to monitor water quality, algae and lake responses to nutrient reduction programs initiated under the Great Lakes Water Quality Agreement.
- In 1976, the Sport Fish Contaminant Monitoring Program began, followed by the publication of the first Guide to Eating Ontario Sport Fish in 1977. The program and the guide began providing advice to the public on safe levels of sport fish consumption for the Great Lakes and inland lakes.
- The ministry’s Enhanced Tributary Monitoring Program (1979 to 1980) focused on monitoring phosphorus loads, sediment and other contaminants at 15 tributaries to the Great Lakes.
1982 to 1992: Site-Specific Monitoring Starts
By 1982, zebra mussels had invaded the Great Lakes. Round Gobies appeared in the St. Clair River and pollution from phosphorus and toxic substances was still a widespread problem.
- Under the 1986 Canada-Ontario Agreement, Respecting the Great Lakes Basin Ecosystem, Ontario committed to reducing persistent toxic substances. Ontario established the Municipal/Industrial Strategy for Abatement program to reduce industrial discharges of toxic chemicals into Ontario’s waterways.
- Ontario banned DDT use in 1988. In 1987, the International Joint Commission identified 42 contaminated Areas of Concern around the Great Lakes. Of these, 17 were in Canada. The formation of Remedial Action Plans brought citizens, scientists and businesses together to help clean up these areas.
- The ministry’s monitoring activities moved toward conducting specialized studies. These included developing specific programs on a regional basis to improve Areas of Concern, remediating contaminated sites and addressing other site-specific issues.
- In 1988, the ministry established a long-term network of index and reference stations to build on existing long-term monitoring in Lake Erie and Lake Ontario.
1992 to 2002: Fine-Tuning the Ministry’s Great Lakes Program
By 1992, zebra and quagga mussels had spread throughout the Great Lakes nearshore zone, altering the ecosystem of the Great Lakes. This caused diminished fish productivity and a resurgence in algae fouling the shoreline. Bacteria-contaminated drinking water in Walkerton (2000) emphasized the need for better management of agricultural runoff near drinking water sources, including the Great Lakes:
- In 1992, the ministry started fine-tuning its monitoring programs under the Great Lakes Nearshore Monitoring and Assessment Program to combine its ambient monitoring and investigative surveys.
- The ministry began tracking background conditions in areas away from contaminant sources and conducting surveys to track sources of contamination.
- The Nearshore Index and Reference Station monitoring program monitors conditions in the Great Lakes nearshore and assesses the performance of abatement activities.
2002 to 2012: New Issues, New Solutions
Invasive mussels continue to take their toll on the Great Lakes ecosystem. Widespread shoreline fouling issues and bacterial contamination plague many of our Great Lakes. Concerns are growing about the potential harmful effects of emerging chemicals, such as pharmaceuticals, in the Great Lakes. Increasingly, climate change is becoming a recognized threat to Great Lakes communities and the ecosystem:
- In 2002, the federal, provincial and United States governments formed the Co-operative Monitoring Initiative (renamed in 2009 as the Co-operative Science and Monitoring Initiative [CSMI]) to pool monitoring resources in the Great Lakes.
- Anticipating that pressures on the Great Lakes will increase, the ministry continues to develop new tools and methods to improve water monitoring.
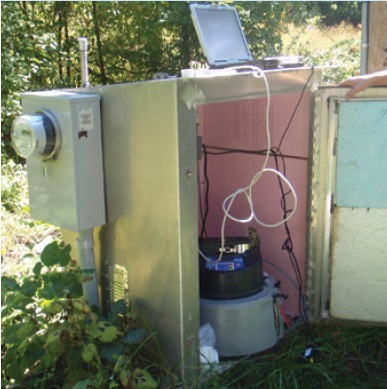
- The ministry uses automated (Figure 2.7) and remotely triggered samplers to collect water in many tributaries. This improves our understanding of nutrient-pollutant loads in the Great Lakes’ tributaries. Using mobile cellular technology, the ministry can collect samples remotely from previously inaccessible locations.
- Passive water samplers are used to monitor trends and find sources of emerging and legacy chemicals. They make it possible to understand how highly contaminated areas affect aquatic life when it is not possible to use “biomonitors” (organisms, such as caged mussels) to gauge water quality. Passive samplers also provide information on contaminant conditions in the water over their entire deployment period, compared to water sampling that only provides a brief snapshot of the conditions at the time of the water sample collection.
- The Nearshore Index and Reference Station Monitoring program monitors each Great Lake every three to six years to identify and understand long-term trends in the lakes. Improvements in sampling efficiency and coordination with Ontario’s federal and binational partners provide a broad picture of important processes in the Great Lakes. The ministry continually updates its monitoring activities to respond to water quality conditions and ecosystem changes.
Figure 2.7: Automated ISCO samplers
3.0 Nutrient and Algal Issues
3.1 The Role of Nutrients in Water Quality
Nutrients are essential for healthy plant and animal populations. Our lakes, rivers and streams must have the right balance of nutrients to maintain aquatic life. However, too much or too little nutrients in the water can negatively affect the water quality and aquatic life.
For freshwater lakes in Ontario, too much phosphorus can lead to enrichment or eutrophication. Eutrophication can occur when excessive phosphorus enters a water body, typically due to human activities (e.g. sewage, fertilizers). The addition of excess nutrients in aquatic systems can lead to excessive algal growth. This in turn can threaten aquatic habitats, spoil the natural beauty of lakes and streams, cause noxious algae blooms and create taste and odour problems in surface and drinking water.
Phosphorus exists in different forms in water. It can be dissolved, attached to sediment particles and other materials or contained within living or decaying plants. Total phosphorus includes all of these forms of phosphorus in water. It is often used as a measure of phosphorus in a water body.
Nitrogen can enter water bodies in different forms. The most oxidized forms, nitrate and nitrite, are particularly important in water quality. In high concentrations, they can have harmful effects on humans and animals. Nitrate and nitrite can result in changes in the algal composition of a water body, potentially increasing algal growth.
Common Sources of Nutrients
Nitrogen and phosphorus can enter water from both natural processes and human activities.
Natural Processes Contributing Nutrients to Water
- Weathering of rocks
- Soil erosion
- Decay of organic material
- Atmospheric deposits (e.g. pollen and dust)
Human Activities Contributing Nutrients to Water
- Erosion and runoff from agricultural lands treated with P- and N-containing fertilizers or manures, or both
- Industry, sewage treatment plants and discharge from septic systems
- Stormwater runoff from urban areas
- Atmospheric deposits from the burning of fossil fuels
In the past, consumer products such as laundry detergents were a major source of phosphorus in water bodies. However, government regulations now control the amount of phosphates in household laundry detergents. The ministry has also taken action to reduce phosphorus inputs to water from other major sources, such as sewage treatment plants and industry. As part of the agricultural operation requirements under the Nutrient Management Act, the government is also working with farmers to prepare nutrient management strategies, nutrient management plans and non-agricultural source material plans. These measures will help ensure proper fertilizer application and nutrient storage, further reducing sources of nutrients to our waters.
Nutrient and Algal Monitoring Results
The ministry has several programs that monitor nutrients and algae in the Great Lakes, inland lakes and streams.
In this and previous Water Quality in Ontario Reports, our program data have shown some decreases in phosphorus levels in Ontario’s lakes, rivers and streams:
- Since the mid-1970s, there have been decreases in phosphorus concentrations in the Great Lakes (Figure 3.1, Water Quality in Ontario 2008 Report and Figure 3.1, this report). The decreases occurred predominantly during the 1970s and 1980s.
- Phosphorus concentrations in many inland lakes throughout Ontario have decreased since longterm monitoring programs began in the 1970s (Chapter 3.1, Water Quality in Ontario 2008 Report).
- Spring phosphorus levels in Lake Simcoe have decreased since the 1980s (Figure 3.9). This has contributed to an increase in dissolved oxygen concentrations in deep waters of the lake, improving the habitat for coldwater fish.
- Since the 1980s, phosphorus concentrations in many rivers and streams in Ontario have declined (Figure 3.6, Water Quality in Ontario 2008 Report).
While we’ve been successful in reducing some phosphorus levels in Ontario’s water over time, we are still facing many nutrient-related challenges. The ministry is continuing to work with its partners to reduce phosphorus inputs into our waters.
- Despite controls of phosphorus loads to the Great Lakes and decreases of phosphorus concentrations, nutrient-related problems in the nearshore are increasing. For example, there are increasing incidents of shoreline fouling in Lakes Ontario and Huron by the nuisance algae, Cladophora (Figures 3.3 to 3.5). Nutrient enrichment is occurring on the rural shores of Lake Huron (Figures 3.4 to 3.5). Finally, bluegreen algae blooms are reappearing in Lake Erie (Figures 3.6 to 3.8).
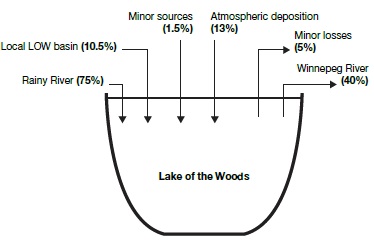
- Monitoring shows declines in phosphorus levels in many Ontario inland lakes over the past few decades. However, in Lake of the Woods, there have been growing concerns about water quality and the annual appearance of algal blooms. A recent study has identified the key sources of phosphorus to the lake (Figure 3.12), with the Rainy River contributing the most phosphorus, followed by atmospheric deposition, smaller streams and runoff. Although there is extensive shoreline development, residential developments were a minor contributor. The pulp and paper mills along the Rainy River were the highest contributors of human activity sources of phosphorus to the lake.
- Although phosphorus levels have declined in some of Ontario’s rivers and streams compared to past decades, levels continue to be elevated compared to historical levels in many of these rivers and streams (Figures 3.13 and 3.14). A recent study on streams in an agricultural watershed in southwestern Ontario found that nutrient levels have not dropped compared to 40 years ago (section 3.4), indicating a need for continued efforts to control sources of phosphorus in these watersheds.
- While monitoring shows long-term declines in phosphorus levels in some Ontario lakes and rivers, reports of algal blooms have increased across the province, with cyanobacterial blooms increasing the most (Figure 3.17).
The remainder of this chapter presents some of these key findings in more detail.
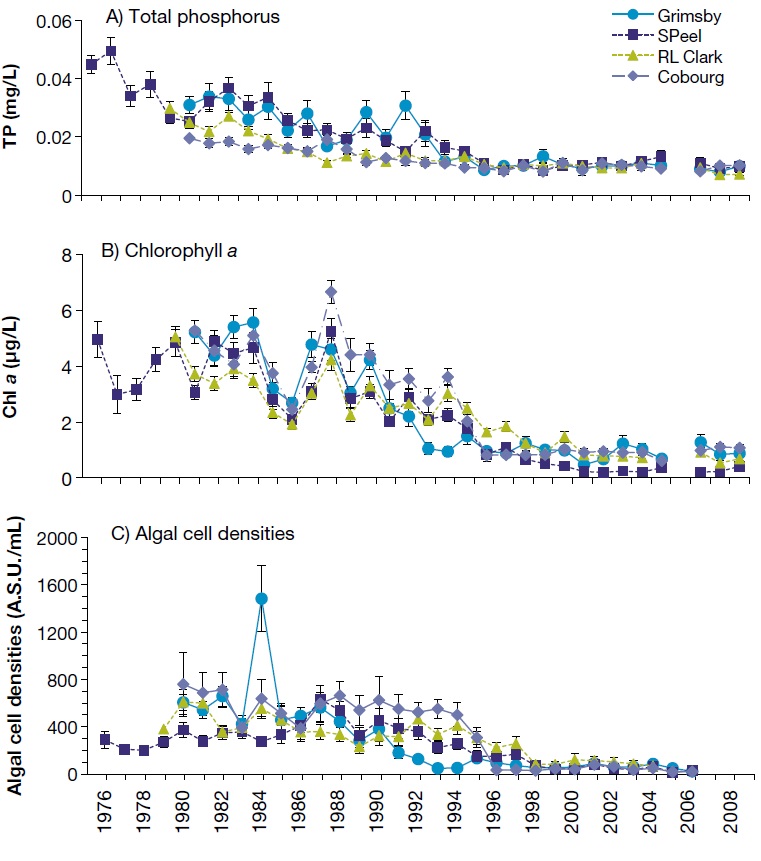
Figure 3.1: Annual average concentrations of (a) phosphorus, (b) chlorophyll-a and (c) algal cell densities in raw water collected at water treatment plants in Lake Ontario from 1976 to 20103
3.2 The Great Lakes
Nutrients, especially phosphorus, have been a key issue for Great Lakes water quality since the 1960s when elevated nutrient loading resulted in extensive algal blooms. Reduced water quality due to humanrelated inputs of phosphorus and other nutrients into the Great Lakes ecosystem is referred to as “cultural eutrophication.” The Great Lakes Water Quality Agreement between Canada and the United States was established in 1972 to work toward reducing nutrient inputs to the waters that both countries share.
Routine monitoring of nutrient inputs began in the 1960s with weekly monitoring of algal concentrations in raw water samples from water treatment plants throughout the Great Lakes. The program still samples over 17 stations every week to provide long-term monitoring data. These data have been used to identify improvements to nearshore water quality over the years, including significant reductions in phosphorus concentrations due to international controls2 (Figure 3.1). These findings were similar to Environment Canada’s3 long-term monitoring results in open waters of the Great Lakes that documented dramatic reductions in phosphorus concentrations in Lake Ontario from the 1970s to the 1980s.
Our long-term monitoring data from treatment plant intakes suggest that nearshore algal growth in the lower Great Lakes appears to be on the rise in recent years (data not shown). This increase has occurred despite controls of phosphorus loads to the Great Lakes and decreasing offshore nutrient concentration, signalling ongoing nutrient-related problems along the nearshore areas.
Invasive zebra and quagga mussels play a key role in the distribution of phosphorus and algae in the Great Lakes. These invading mussels have become extremely abundant in the Great Lakes, even covering the lakebeds in many areas. For example, in 2008, invasive mussels covered 47% of the lake bottom in Lake Ontario’s coastal areas.
Mussels remove free-floating algae called phytoplankton and other particles from the water. This can increase water clarity and allow sunlight to penetrate to greater depths. This enables Cladophora, a green, hair-like algae that grows on the lakebed of the nearshore, to grow on a larger area of the lakebed. The mussels also release nutrients at the lakebed, providing more nutrients for Cladophora growth. When mussels spread on the bottom of the lake, their shells create a hard and hospitable surface for Cladophora to grow even more. When Cladophora die, they periodically wash up on shores, accumulating on and fouling the shoreline and beaches.
Invasive mussels in the Great Lakes have also been linked to cyanobacterial blooms. Mussels selectively filter algae out of the water, which may alter competition between cyanobacteria and other phytoplankton, and promote cyanobacterial blooms.
Area-specific problems affecting the Great Lakes include nutrient enrichment on the shores of Lake Huron, an increase in algal blooms in Lake Erie and growth of nearshore Cladophora. These are all likely due to interrelated stresses on the lakes.
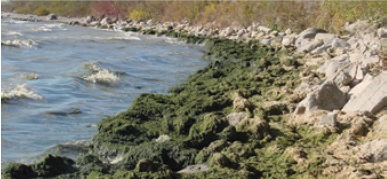
The photographs of the Lake Ontario lakebed in Figure 3.2 show mats of mostly quagga mussels. The middle image shows algal growth on mussel beds in the lake. Figure 3.3 shows fouling of Lake Ontario’s Cobble Beach shoreline by Cladophora.
Figure 3.2: Mussel beds in Lake Ontario
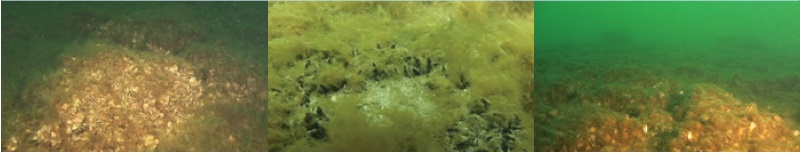
Figure 3.3: Cladophora fouling of Cobble Beach shoreline, Lake Ontario
Nutrient Pollution on Lake Huron’s Rural Shores
Nutrient levels vary greatly across the Great Lakes due to differences in nutrient pollution and the shape and depth of the lake basins.
Lake Huron nutrient levels in the offshore are low compared to Lakes Erie and Ontario. However, Lake Huron is more sensitive to localized increases in phosphorus. Local increases in phosphorus levels that contribute to nuisance algae problems along the shoreline are a concern in some locations around the lake. These problems occur both next to and downstream of suspected and known sources of nutrients affected by human development of the lands draining to the lake and the shoreline. This is particularly evident where rivers and shoreline drains carry phosphorus into the lakes.
Lake Huron’s shores have many tributaries that drain predominantly agricultural lands. These lands discharge phosphorus into rivers that often transport the phosphorus to developed shorelines adjacent to river mouths. Lake Huron’s nearshore is also sensitive to phosphorus loading directly from the developed shoreline. The resulting shoreline algae (Figures 3.4 and 3.5) have raised public concerns that water quality in the nearshore is deteriorating.
Monitoring and investigation of Lake Huron’s nearshore environment is ongoing to understand the effects of changing nutrient inputs on water quality and water resources. Also, continued actions are needed to ensure best management practices are carried out by agricultural and residential owners to reduce phosphorus loads from non-point sources (e.g. fertilizers applied to crops, lawns and golf courses, livestock and pet waste, failing septic systems).
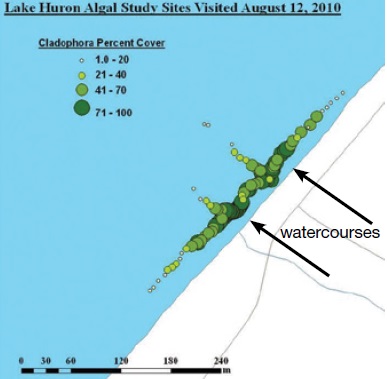
Figure 3.4: Cladophora masses along Lake Huron shoreline beach
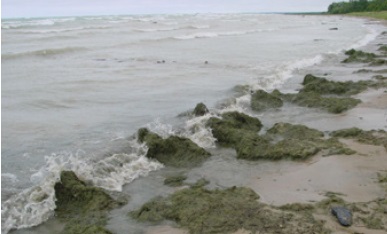
Figure 3.5: Map of Cladophora% cover in Lake Huron algal study sites visited on August 12, 2010
Algae Problems in Lake Erie
Phosphorus enters Lake Erie from a wide range of sources along the shoreline and subwatersheds that drain into Lake Erie. These sources include point sources, such as discharge from municipal and industrial wastewater facilities and non-point sources, such as basin-wide, diffuse inputs from fertilizers, animal waste and atmospheric deposition.
Phosphorus also cycles internally between lake sediments and the water column through biological, chemical and physical processes. Lake sediments are important sources of recycled and historical phosphorus in the open waters of western and central Lake Erie. However, the main sources of new phosphorus are non-point inputs from watersheds where runoff from agricultural and urban lands contribute large amounts of phosphorus. Although point sources are comparatively easy to manage, non-point sources are more difficult to control and pose phosphorus management challenges.
Figure 3.6 shows a satellite image of early spring conditions in the Lake St. Clair to Lake Erie waterways. This image illustrates the challenging nature of non-point source pollution. The large regions of brown water extend from the mouth of the Thames River to the south shore of Lake St. Clair and the western basin of Lake Erie. Sedimentenriched water carries phosphorus from the land draining into Lake St. Clair and Lake Erie. The image shows the extreme conditions of high runoff. Under usual conditions, a high proportion of sedimentbound phosphorus ends up temporarily settling into the shallow lake bottom of the western basin. Heavy winds cause sediment-bound phosphorus to release on the lake bottom. The phosphorus then re-enters the water column of the western basin of Lake Erie.
Recently, there have also been mid to late-summer cyanobacterial blooms in the western basin of Lake Erie (Figures 3.7 and 3.8). In some years, blooms periodically extend to the western basin’s north shore. These blooms originate in the nearshore areas and then expand along the shoreline and into the open lake. Figure 3.7 shows a true colour NASA satellite image of the western basin of Lake Erie on September 12, 2009, a time of heavy cyanobacteria growth. The light green color at the top of the northern shoreline image shows cyanobacteria blooms. In 2011, scientists detected blooms for the first time on the north shore of the central basin (Figure 3.8).
Periodic blooms of cyanobacteria have occurred during the late summer in the western basin since 19954-6. Prior to 2012, the accumulation of surface scums had been limited to the western basin of Lake Erie. Similar to other areas in Ontario, the extent and severity of cyanobacterial blooms in Lake Erie in recent years are the worst seen in decades. Toxins that can be associated with these blooms may be a hazard to human health when they invade the coastline and drinking water intakes. The ministry works with local partners such as health units to post advisories in recreational areas and put restrictions on drinking water intakes when algal toxins may impact human health. Algal blooms are a significant challenge and mitigation of algal blooms will require more monitoring and point and non-point source management actions.
There is concern that the current conditions in Lake Erie are becoming similar to those found in the 1960s and 1970s. Significant binational efforts, similar to those taken in the 1970s, are needed for point source reduction and to address and control non-point sources of phosphorus to the lake.
Figure 3.6: High turbidity plumes from the mouth of the Thames River show the influence of watershed inputs on water quality in Lake St. Clair
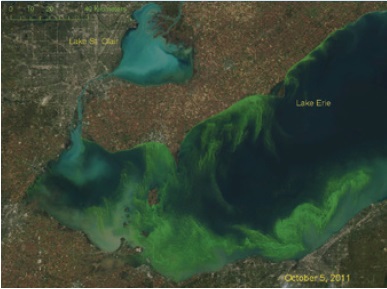
Figure 3.7: Algal blooms extending into Lake Erie’s western basin on September 12, 2009
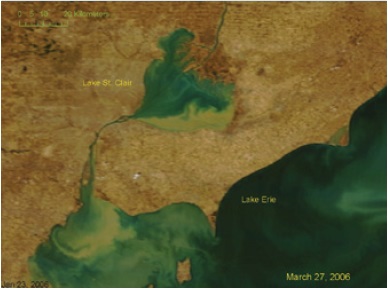
Figure 3:8: Landsat-5 satellite image of algal blooms extending into Lake Erie’s western to central basin on October 5, 2011
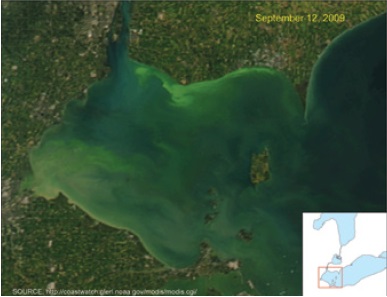
Photo credit: The Space Science and Engineering Center, University of Wisconsin-Madison, image obtained from the National Oceanic and Atmospheric Administration (NOAA) Great Lakes Coastwatch website
3.3 Inland Lakes
Phosphorus Monitoring Results for Lake Simcoe
Lake Simcoe is south-central Ontario’s largest inland lake. Its location and size make it a popular destination for recreational activities, especially fishing. The ministry, in partnership with the Ministry of Natural Resources and the Lake Simcoe Region Conservation Authority (LSRCA), has been monitoring the ecological health of Lake Simcoe since the 1970s. The ministry and its partners have collected lake water samples regularly since 1980. Currently, sampling occurs at 10 water quality sampling stations.
Four decades ago, Lake Simcoe had problems with excessive growth of plants attached to the lake bottom near the shoreline and small, free-floating plants called phytoplankton in the open water. This was due to the large amount of phosphorus entering the lake through the tributaries, the atmosphere and from wastewater treatment plants, septic systems and polders (e.g. the Holland Marsh).
Decomposition of this excess plant growth caused dissolved oxygen to decrease at the lake bottom where coldwater fish live. By the end of each summer, bottom water oxygen levels became too low for young fish and the surface water temperature too warm, squeezing the young fish into the middle of the water column where their predators live and increasing their mortality rate. This caused a decline in Lake Simcoe’s natural coldwater fish populations and the Ministry of Natural Resources had to stock species, such as Lake Trout, to compensate7. (See section 3.1 for the phosphorus contamination cycle).
Starting in the 1980s, initiatives began to reduce the amount of phosphorus entering the lake. Because of the natural year-to-year variability, it is the practice to look at five-year averages of phosphorus loading measurements. In the early 1990s, the phosphorus loading measurement was ~120 tonnes/year. The average from 2005 to 2009 was 86 tonnes/year8 (data not shown, but available in the Report on Phosphorus Loadings to Lake Simcoe, 2007-2009). The tributaries were the largest source of phosphorus.
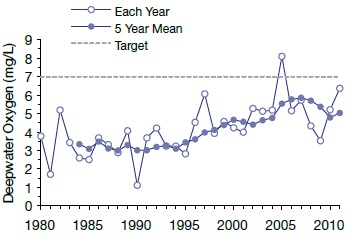
Lake Simcoe has generally responded well to phosphorus loading reductions9. With lower average loads since the early 1990s, phosphorus concentrations in the lake have also been lower, especially in the spring (Figure 3.9). There was also a significant decrease in the amount of phytoplankton during the 1980s and 1990s10 (Figure 3.10). An encouraging result is a significant improvement in the minimum dissolved oxygen at the bottom of the lake. In 2011 it was close to 7 mg/L (Figure 3.11), the ministry’s target in the Lake Simcoe Protection Plan to sustain the natural reproduction and survival of the coldwater fish populations.
The improvements in deepwater dissolved oxygen mean that naturally produced (i.e. not stocked) Lake Trout are being caught again11. Because of the positive signs in Lake Trout and to encourage further natural spawning, the Ministry of Natural Resources has reduced stocking by 50%5.
The Lake Simcoe Water Quality Update, released in May 2010, has more information on three decades of Lake Simcoe water quality trends. The ministry and its many partners are continuing efforts to reduce phosphorus and improve water quality in Lake Simcoe.
The ministry recently released the Minister’s Annual Report on Lake Simcoe, 2011-2012. The report shows that significant progress has been made to enhance the shoreline, lower phosphorus levels and encourage the return of native Lake Trout.
Figure 3.9: Spring phosphorus concentration in Lake Simcoe from 1980 to 2011 (a volume-weighted concentration of all lake stations)
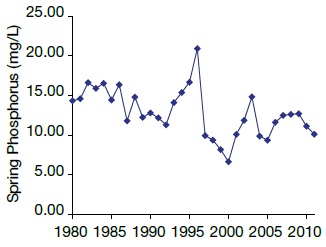
Figure 3.10: Phytoplankton in Lake Simcoe from 1980 to 2010 at three lake stations
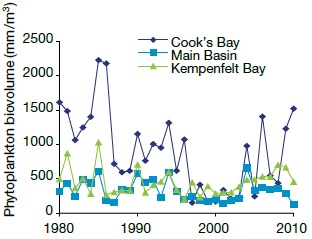
Figure 3.11: Deepwater dissolved oxygen in Lake Simcoe from 1980 to 2011. This is the lowest concentration of dissolved oxygen by the summer’s end (September 15th). It is volume-weighted in the deepwater (18 m to bottom) at a sampling station in Kempenfelt Bay.
Lake of the Woods Phosphorus Budget
Lake of the Woods is an international water body that spans the provinces of Ontario and Manitoba and the state of Minnesota. The lake is a significant tourism destination in Ontario and supports a world-class fishery. It also provides drinking water for over 700,000 people, including the city of Winnipeg, Manitoba, which takes its water from Shoal Lake.
Over the past several years, there have been growing concerns about the lake’s water quality and the annual appearance of vast algal blooms. Furthermore, due to elevated total phosphorus (TP) and chlorophyll concentrations in southern bays, Minnesota recently listed Lake of the Woods as an “impaired water body.” Under the state’s rules, this triggered enhanced monitoring and modelling of nutrients in the Lake of the Woods and Rainy River basin.
Released in 2009, The State of the Basin Report for the Lake of the Woods and Rainy River Basin provided a first snapshot of water quality conditions in Lake of the Woods and the Rainy River. It also identified key data gaps, including the need for an improved understanding of the relative sources and losses of TP to the lake. The tool for achieving this is the phosphorus budget.
A phosphorus budget operates like any other personal or business budget that tracks deposits and withdrawals. It calculates the deposits and withdrawals of TP to and from a lake. The budget provides valuable information, including the relative importance of various sources of TP to the total budget. In turn, this information can help in creating models for predicting future lake TP concentrations under various management scenarios.
In 2011, Trent University, in partnership with the ministry, published the first TP budget for Lake of the Woods12. Figure 3.12 shows the researchers’ preliminary findings on the primary sources and losses of TP to the lake in percentages. More than 98% of the external TP load to the lake comes from three main sources. The largest source, by far, is the Rainy River, contributing about 75% of the TP entering Lake of the Woods. Roughly 13% of the load comes from atmospheric deposition falling on the lake’s surface. This includes dissolved phosphorus in rain and snow, and phosphorus associated with dust, pollen and other fine particulates. The third key source of TP to the lake is from smaller streams and local runoff, bringing in approximately 10.5% of the total TP budget. About 55% of the TP that enters the lake goes into lake sediments. The remainder is lost through the outflow to the Winnipeg River and to other bodies of water.
The pulp and paper mills along the Rainy River are the highest contributors of human activity sources of phosphorus to the lake. Collectively, they add 12% of the TP load to Lake of the Woods. While there is extensive shoreline development (an estimated 5,000 to 7,500 buildings), residential development contributes only 1% to the total TP budget of the entire lake. However, TP budgets for isolated embayments show that shoreline development may produce higher contributions to local TP budgets. This is an important consideration for management decisions at smaller spatial scales.
Figure 3.12: Primary sources and losses of total phosphorus to Lake of the Woods
The first TP budget for the Lake of the Woods has identified key sources and losses of TP to the lake, filling an important data gap identified in the State of the Basin report. With continued monitoring, further refinements will be made to the nutrient budget and changes in relative contributions from the various sources will be tracked over time. This information will be essential in identifying actions to reduce TP loading to Lake of the Woods.
3.4 Streams
Phosphorus Monitoring Results for Rivers and Streams
The ministry has been monitoring water quality in rivers and streams across Ontario for over 40 years as part of the Provincial (Stream) Water Quality Monitoring Network. It collects samples about once a month during the ice-free period and analyzes them in the ministry’s laboratory. The analysis focuses on a range of water quality parameters, including phosphorus.
Recent results for selected watersheds (Figures 3.13 and 3.14) show the lowest phosphorus concentrations in rivers and streams in central and Northern Ontario where population density is low and there is a more natural land cover. The highest concentrations of phosphorus are in southern Ontario rivers and streams. There, the soils are relatively rich, human population density is higher and the land has been developed for different agricultural and urban uses.
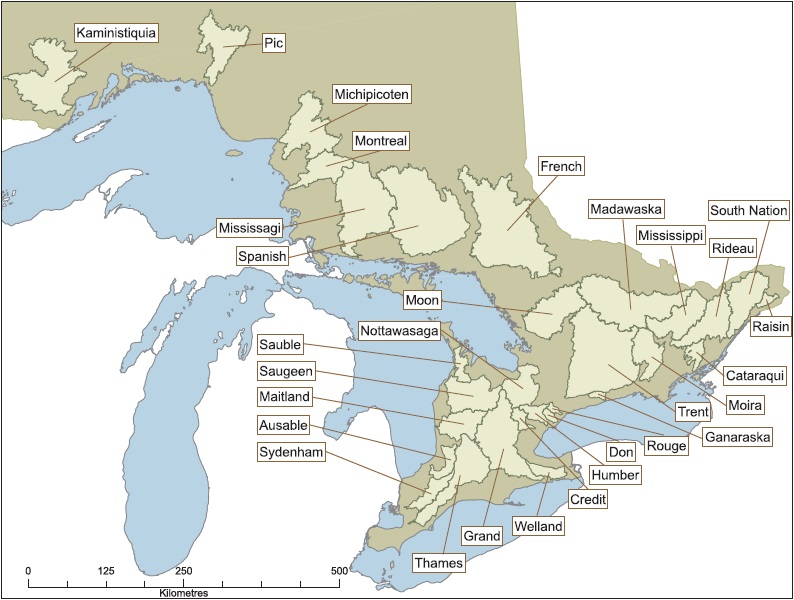
Many Ontario Rivers and streams exceed the interim Provincial Water Quality Objective of 30 µg/L of phosphorus. This indicates that there may be a need for continued efforts to control sources of phosphorus in these watersheds not just because they deliver phosphorus to the Great Lakes, but also because of the potential for in-stream impacts. The 30 watersheds on the map in Figure 3.14 represent a range in land-use activities and geology and in phosphorus levels across Ontario.
Figure 3.13: Median phosphorus concentration in 30 Ontario rivers, 2007 to 2011 (data identified by an asterisk based on 2002 to 2006 data)
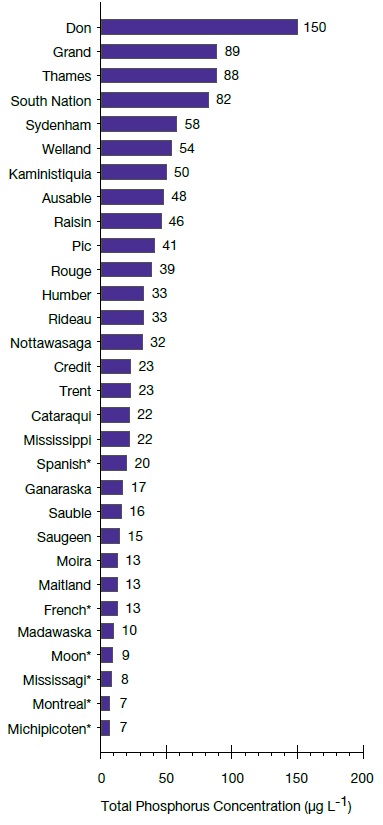
Figure 3.14: Locations of the 30 watersheds from Figure 3.13
Nutrient Monitoring in Streams in Agricultural Watersheds
Agriculture is a large part of Ontario’s landscape. This is especially true in southwestern Ontario where farming is the dominant land use. Farm crops require nutrients to grow and for this reason, farmers apply nutrients to their fields to increase crop yields. Nitrogen and phosphorus are two important nutrients that crops need, which can be added as either chemical fertilizers or livestock manure.
Some applied nutrients are lost to surrounding streams. This increases the growth of aquatic plants and algae. While phosphorus is the primary nutrient that causes excessive growth of aquatic plants, nitrogen can also contribute to aquatic plant overgrowth. Nitrogen in its nitrate and nitrite forms can be toxic to aquatic organisms at high concentrations. In its ammonia form, it can be toxic at relatively low concentrations. However, toxicity by nutrients from agriculture is typically not the main concern when excessive nutrients get into water.
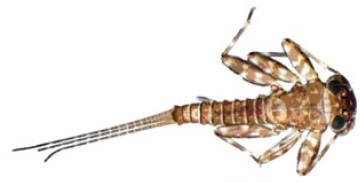
Increased nutrient inputs to streams can reduce biodiversity and change the types of species found in streams. For example, increased nutrients can increase the population of certain tolerant species such as the mayfly, shown in Figure 3.15, which grazes on algae attached to the surfaces of rocks.
Figure 3.15: The genus Stenacron, a common stream mayfly that feeds by grazing algae from the surfaces of rocks
Increased nutrients can also lead to reduced diversity of benthic invertebrates.
Since the implementation of the Nutrient Management Act in 2004, the ministry has been examining the water quality of several streams in agricultural regions. In part, this was to study changes in water quality related to the implementation of the act and to get a better understanding of the influence that agricultural nutrients have on aquatic ecosystems in these areas.
Data from two streams with direct nutrient loading data over a long sampling period suggest that nutrient loading has not decreased compared to 40 years ago, while preliminary evidence suggest that in some streams, nutrients may be increasing13. These observations are supported by the invertebrate community compositions from these streams which have not changed since the implementation of the Nutrient Management Act. Very little change in invertebrate community composition during this time has also been observed in other agricultural streams the ministry is monitoring.
There are several possible reasons for this. For example, it can take some time for changes on the landscape to show up as improved water quality. Also, the Nutrient Management Act has been phased in gradually, which might also make the response in stream water quality more gradual. An increase in the intensity or size of livestock farming in the study watersheds could also have offset water quality improvements resulting from the act.
Another possible reason is that the act does not address some important sources of nutrients that would make a measurable difference in the environment. For example, the act applies to livestock operations but not to crop farms, which can also be a source of nutrients to streams.
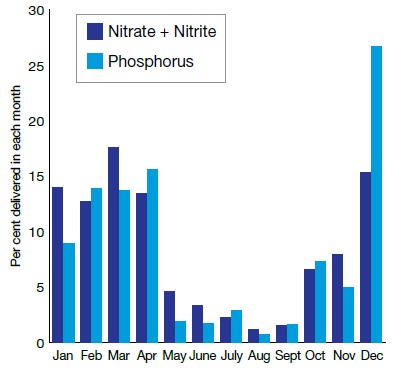
During its study of water quality in agricultural areas, the ministry saw distinct seasonal patterns in nutrient inputs (Figure 3.16). About 40% of the nitrate and nitrite, and 50% of the phosphorus, enter streams between December and February13.
Figure 3.16: Seasonal patterns in the amount of nitrogen (as nitrate + nitrite) and phosphorus delivered by the ministry’s study streams
Ongoing monitoring can help the ministry have a better understanding of three factors:
- the seasonal movement of agricultural nutrients through stream systems, which can help to identify important times of the year to reduce the movement of nutrients from the land to surrounding streams;
- the importance of different forms of nutrients; and
- how changing land use affects the amount and type of nutrients in streams and the biological communities inhabiting them.
This information will help inform nutrient management reduction efforts for agricultural land use.
3.5 Algal Blooms
Algal Blooms in Ontario
Algal blooms14 are a concern in Ontario lakes and rivers. Nuisance algal growth can cause aesthetic, taste and odour issues. Blooms of cyanobacteria — technically a bacteria, although commonly called blue-green algae — are of particular concern since many species produce toxins that can affect the health of humans and other animals. Excessive algal growth can affect drinking water, recreational activities like swimming and fishing and shoreline property values.
Human activities and the resulting nutrient enrichment, climatic warming, acidification and the spread of invasive species can all promote algal growth and worsen blooms. Ministry scientists are studying algal blooms to understand the factors that control algal dynamics and growth. Their work will contribute to actions needed to reduce the occurrence of algal blooms.
Phosphorus Increases Algae Growth: The Phosphorus Contamination Cycle
A high concentration of phosphorus leads to excessive growth of plants and algae in the water.
When algae die, large amounts of organic material settle to the bottom of the water body and decompose, a process that uses up oxygen.
As the decomposing matter uses up oxygen, the bottom sediments can release more phosphorus. This makes the problem worse by stimulating even more plant and algal growth.
Excessive algal growth from high concentrations of phosphorus can result in a “bloom.”
Algal and cyanobacterial blooms can:
- Alter the colour of the water body, causing the water to appear green, brown, yellow and even red.
- Reduce water clarity.
- Make water taste and smell unpleasant.
- Foul beaches by accumulating along the shorelines.
- Produce toxins, which can harm animals and humans.
For more information, see the ministry’s fact sheets on cyanobacteria (blue-green algae).
Figure 3.17: Number of algal blooms reported to the Ministry of the Environment and Climate Change, 1994 to 2011
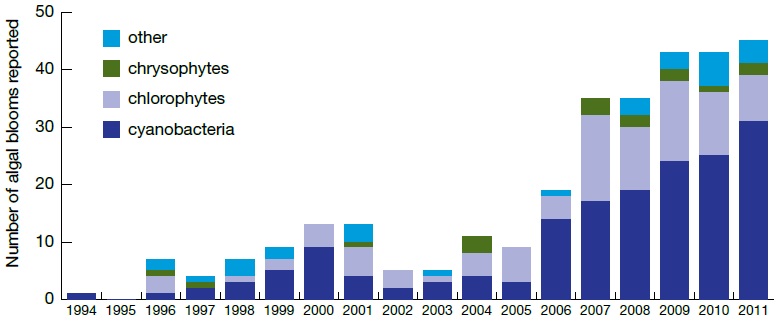
Figure 3.18: Location of cyanobacterial blooms reported to the Ministry of the Environment and Climate Change in 2009 and the five ministry regions in Ontario, Canada (source Winter et al., 201114)
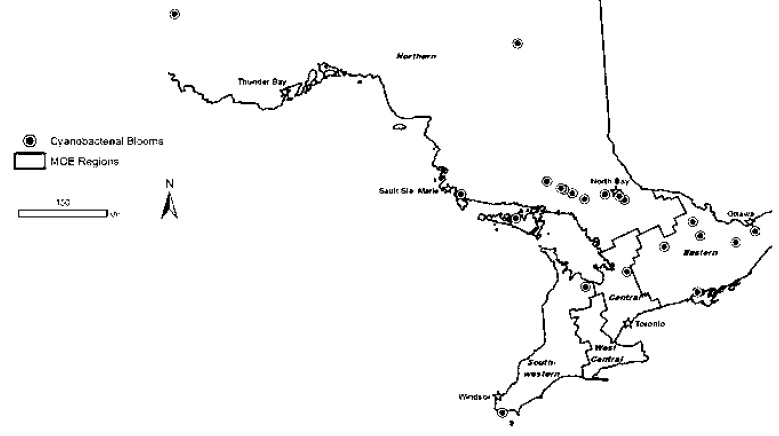
In recognition of the potentially harmful impacts of algal blooms, the ministry provides a coordinated, rapid response protocol when it receives a report of an algal bloom. As part of this protocol, the ministry’s Environmental Monitoring and Reporting Branch (EMRB) identifies the algal species in bloom samples. EMRB scientists use the data to track the frequency and characteristics of blooms reported throughout the province. The ministry works closely with local public health units to respond to algal blooms.
Between 1994 and 2011, the ministry received an increase in bloom reports, with 46 blooms reported in 2011 (Figure 3.17). The biggest increase was in cyanobacterial blooms, accounting for about 50% or more of all blooms during peak years. Of the 46 blooms reported in 2011, 32 were cyanobacterial blooms.
There have been reports of algal blooms throughout the province (Figure 3.18):
- The Northern Region had the highest total number of reported blooms between the years 1994 and 2009.
- Cyanobacterial blooms accounted for most of the increases in the Northern and Central Regions.
- Filamentous green algae accounted for most of the increase in the Eastern Region.
- In recent years, reports of algal blooms occurred later in the fall than during the 1990s, with samples submitted to the ministry until the end of November, compared to early October in the 1990s.
Increased reports of algal blooms in some areas may be linked to land use activities such as agriculture and urban development. In other areas, increased bloom frequency is thought to be due to increased nutrient inputs as a result of increases in cottage and residential development and usage. However, some lakes with blooms have low phosphorus levels. Changes in the frequency and seasonal extent of algal bloom reports are likely due to several factors. Climate change may also be contributing to increasing algal bloom reports because climatic warming, including warmer water temperatures, longer growing seasons and reduced water column mixing, promotes algal growth. Increased public awareness may also have resulted in increased reports of algal blooms.
Actions to promote good water quality, particularly nutrient reduction efforts, will continue to be essential to reduce the extent of algal blooms in Ontario.
Figure 3.19: A cyanobacterium
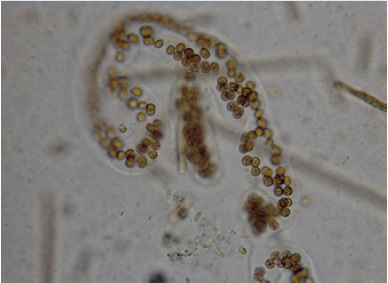
3.6 Algal Surveys
Several species of cyanobacteria can produce toxins called cyanobacterial toxins or cyanotoxins that can cause nerve and liver irritation. These toxins can be produced when excessive growth of cyanobacteria results in an algal bloom in surface water. The presence of toxins is an important consideration for municipalities that use surface water as their drinking water supply. The Ontario Drinking Water Quality Standards set a maximum acceptable concentration of 1.5 µg/L for microcystin-LR, a cyanobacterial toxin that can affect the liver. Figure 3.19 shows a cyanobacterium viewed through a microscope.
Since 2004, the ministry’s Drinking Water Surveillance Program (DWSP) has conducted a survey to study the presence of cyanobacterial toxins at selected municipal drinking water systems in Ontario. DWSP collects samples every week between May and November from lake or river source water that enters a drinking water treatment facility via an intake pipe and from water after it has undergone drinking water treatment. The sampling captures water quality during months when blooms typically occur in Ontario. However, DWSP samples are not specifically collected when an algal bloom has been reported. When the ministry receives reports of blooms in a water body, it addresses them using the coordinated rapid response protocol that section 3.1 describes.
From 2004 to 2010, DWSP collected 1,089 samples (616 source water samples, 473 treated water samples) from 18 municipal drinking water systems in Ontario that draw water from 13 different water bodies. It found cyanobacterial toxins in 257 of 616 water samples (42%) taken from source water (rivers or lakes). After treatment, cyanobacterial toxins were not found in 471 of 473 samples (99.6%). Cyanobacterial toxins were detected at low levels in two of 473 treated samples (0.4%). Both samples were collected in the summer of 2009. Levels observed were well below the Ontario Drinking Water Quality Standards.
Findings from DWSP’s cyanobacterial survey suggest that water treatment at Ontario’s drinking water treatment facilities has been effective at removing or inactivating algal toxins of concern. The ministry will continue to work with drinking water treatment facilities to monitor the effectiveness of treatment of drinking water for algal toxins. Figure 3.20 shows the findings of DWSP surveys of drinking water systems from 2004 to 2010. The surveys assessed the presence of cyanobacterial toxins in source water and treated water. The red squares in Figure 3.20 show the locations where cyanobacterial toxins were detected in samples while the black squares show locations where cyanobacterial toxins were not detected in samples.
At municipal drinking water systems that participated in a ministry survey for cyanobacterial toxins, the rate of cyanobacterial toxin detections in source water has varied from year to year with rates of detection ranging from 75% in 2004 to 25% in 2008. Although the rate of toxin detections in source water has varied from year to year, there has been an increase in the number of cyanobacterial blooms reported to the ministry which are primarily from smaller inland lakes and rivers (Figure 3.18). These apparently conflicting patterns are likely due to differences in when the samples are collected. The location and timing of routine water samples collected for the cyanobacterial toxin survey generally do not coincide with the algal bloom reports discussed in section 3.5. Directly comparing data on bloom reports from the public and water treatment plant operators and the rate of toxin detections would require additional samples and analysis during the reported bloom occurrences from lakes or rivers. Starting in 2013, information on whether an algal bloom has been reported when routine water samples are collected for the cyanobacterial toxin survey will help investigate the link between the rate of toxin detection and algal bloom occurrence. Not all cyanobacterial blooms contain species that are capable of producing toxins, and sometimes the species that are capable of producing toxins do not actually produce toxins, so a lack of correlation is not surprising.
Figure 3.20: DWSP drinking water surveys, 2004 to 2010
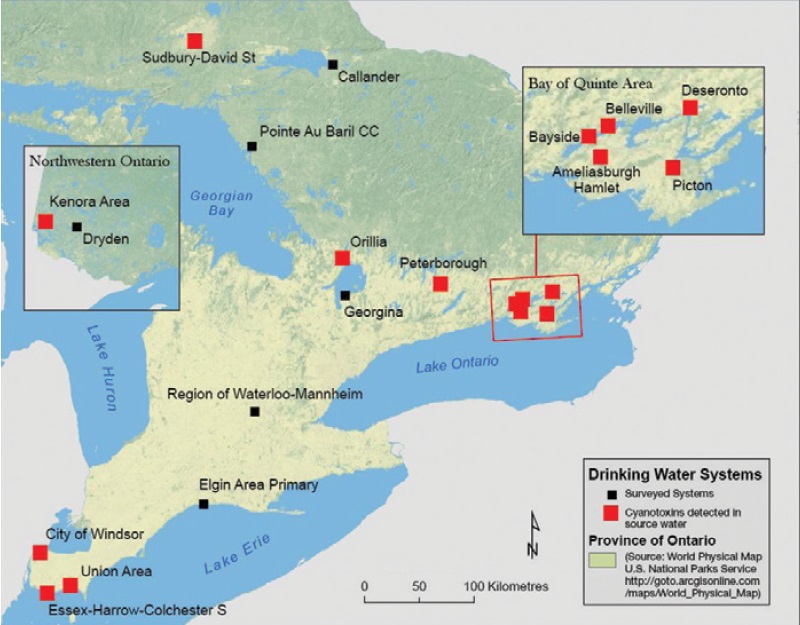
The highest rates of detection and the highest levels of cyanobacterial toxins were in source water samples collected from drinking water systems that draw water from the Bay of Quinte. Cyanobacterial toxins were detected at Bay of Quinte drinking water systems throughout the sampling season and in each sampling year. Consequently, the ministry has continued to work with municipalities to monitor Bay of Quinte treatment facilities.
4.0 Contaminants
Contaminants are substances that impair water quality when released into the environment. They include heavy metals, pesticides and industrial chemicals. These may be toxic to organisms and affect their health, behaviour and reproductive cycles.
For some time, several contaminants have been known to be toxic at low environmental concentrations. Examples are pesticides such as dichloro-diphenyl-trichloroethane (DDT), and industrial chemicals such as polychlorinated biphenyls (PCBs). Such chemicals have been banned or are highly regulated in many jurisdictions including Ontario, Canada, and internationally under the United Nations Environment Program.
Many of these banned and regulated contaminants do not easily break down and remain in the environment for long periods of time. They also do not dissolve easily in water and tend to accumulate in the organic matter in soils, sediments and in the fatty tissues of organisms, a process called bioaccumulation.
Once released into the environment, contaminants are difficult and expensive to clean up. Many of these substances, such as DDT and PCBs, have only been in existence for a relatively short time. Examples of other toxic substances include polychlorinated dioxins and furans (PCDD/Fs) from the burning of wood through forest fires and heavy metals such as mercury and arsenic. However, processes such as chemical production, mining, combustion, and the subsequent use and disposal practices have allowed much larger amounts of these toxics to enter the environment.
Contaminants that were identified as a concern decades ago can still persist in the environment and are sometimes referred to as “legacy contaminants.” Many legacy contaminants are toxic at low concentrations but remain in the environment for long periods of time and accumulate in food chains.
In addition to environmental contamination from our historical use and production of legacy contaminants such as DDT and PCBs, other chemicals have become recognized as “chemicals of emerging concern.” These contaminants generally refer to a broad category of compounds that were previously unknown, unrecognized or unregulated in the environment and may also be called “new contaminants” or “emerging contaminants.”
Where do contaminants come from?
In the past, releases of contaminants into air and water as emissions from industries, spills and pesticide applications were among the dominant sources of contaminants in the environment. Government bans and restrictions have worked to limit the use of certain chemicals and pesticides. However, some amounts of contaminants used are still present in the environment, such as in soils and sediments.
Many of the contaminants are difficult to break down and continue to redistribute between air, water, soil and organisms. Current regulatory efforts, such as Ontario’s Toxics Reduction Act, aim to reduce the impacts of toxic substance emissions and examine new ways to further limit their emissions.
Consumer use of chemicals included in pharmaceuticals, personal care products, electronics, furniture and in plastics and building products are increasingly found in the environment. Consumer use and disposal, rather than industrial emissions, are now major sources of such contaminants in the environment.
For example, polybrominated diphenyl ether (PBDE) flame retardants enter the environment by leaching out of plastics, furniture, carpets and foam products into indoor and outdoor air. Pharmaceuticals and personal care products can enter lakes and rivers via municipal wastewater treatment plants. Many of these contaminants tend to be more concentrated near urban areas, given the origin of their use.
Some persistent, bioaccumulative and toxic substances, including PCBs, pesticides and PBDEs, can be carried long distances from their sources through the air in a process known as long-range transport. This results in some contamination in even the most remote lakes and streams in Ontario.
How is the ministry monitoring contaminants?
The ministry routinely monitors for contaminants in our land, air and water and works closely with partner organizations to share scientific expertise and to coordinate efforts in some of our environmental monitoring programs.
Water monitoring is undertaken to:
- Identify ongoing sources of contaminants so action can be taken to reduce or eliminate these sources
- See how much of the contaminants are entering our lakes and streams
- Monitor for pesticides in urban and agricultural areas
Long-term monitoring programs provide the scientific information necessary to:
- Identify ongoing or emerging issues
- Determine whether concentrations of contaminants in the environment exceed provincial guidelines or standards for the protection of humans, fish and wildlife
- Evaluate the effectiveness of regulatory actions and remediation efforts and develop new policies and regulations
What is monitoring telling us about contaminants?
Our program data shows government actions to ban and limit contaminants have resulted in long-term decreases in many contaminants in Ontario’s water resources.
In the past we have seen that:
- Levels of PCBs, dioxins and furans have declined in Great Lakes fish by as much as 90% in the last four decades (see the 2013-2014 Guide to Eating Ontario Sport Fish and Figure 5.1, Water Quality in Ontario 2010 Report).
- Concentrations of pesticides such as DDT, toxaphene and mirex have decreased significantly in Great Lakes fish and are generally no longer of concern (Figure 4.4(c), Water Quality in Ontario 2010 Report).
- Contaminants such as PCBs and DDT have generally declined in Lake Simcoe Sport Fish15.
- In the first year of Ontario’s cosmetic pesticides ban, levels of three common lawn care pesticides have decreased about 80% in urban streams (Section 4.2, Water Quality in Ontario 2010 Report).
- From 1986 to 2006, there was a large drop in pesticide levels in Ontario’s treated drinking water from surface water sources (Figures 4.8 and 4.9, Water Quality in Ontario 2010 Report).
This report highlights trends we are observing in other contaminants:
- Over the last 40 years, mercury emission reductions have lowered mercury levels in fish in the Great Lakes, northern inland lakes and the English-Wabigoon River system (Figures 4.2-4.4).
- Reductions in the damaging effects of acid deposition have led to the recovery of many lakes in central and Northern Ontario. We have seen dramatic improvements in water quality in the Sudbury region with decreases in lake metal levels (Figure 4.7) following reductions in emissions from metal smelters.
- Other persistent contaminants are being monitored in the Great Lakes watersheds, including pharmaceuticals and perfluorooctane sulfonate (PFOS). PFOS is a newer commercial chemical used in fire-fighting foam and in many stain- and stick-resistant consumer products. PFOS was accidentally spilled into Etobicoke Creek, a tributary of Lake Ontario, in 2000 but our monitoring data shows there have been declines in levels of PFOS (Figure 4.10).
While we have made progress in reducing contaminants in Ontario’s water, more work is needed to address new and ongoing challenges:
- Although levels of PCBs, dioxins and furans have decreased in Great Lakes fish, sport fish consumption advisories are still in place in many lakes and streams. For more information, see the 2013-2014 Guide to Eating Ontario Sport Fish.
- While long-term mercury emissions have decreased and mercury levels in fish have declined over the past 40 years, mercury levels in some Ontario sport fish may be increasing. At this time, the statistical significance of the apparent increase is hard to determine. The ministry is working with provincial and academia partners to better understand the trends and potential causes for these apparent increases.
- Chloride concentrations have been increasing in Lake Simcoe and Ontario’s streams for the past three to four decades. The application of winter road salts has been suggested as a major source (Section 7.2, Water Quality in Ontario 2010 Report). The ministry is continuing to monitor chloride levels in Ontario’s streams to track the effectiveness of current salt management practices and the environmental impact of road salts.
- Consumer use of chemicals included in pharmaceuticals and personal care products, electronics, furniture, plastics and building products are increasingly being found in the environment. Many of these chemicals tend to be more concentrated near urban areas where more of the chemicals are used. For example:
- Trace quantities of pharmaceuticals have been detected in the Great Lakes. While levels are in the low nanogram per litre (ng/L) range, concentrations tend to be highest in the waters near urban centres (Figures 4.8 and 4.9). We are working with national and international scientists to understand the risks of trace quantities of pharmaceuticals in the environment.
- Levels of PBDE flame retardants in Great Lakes sediment have increased dramatically since the 1980s (for an example, see Figure 5.2b, Water Quality in Ontario 2008 Report). PBDE concentrations in Great Lakes sediment are highest near urban areas (Figure 4.2 and 4.3, Water Quality in Ontario 2010 Report). Governments and industries have begun to take actions such as banning or phasing out the use of certain PBDEs.
- PFOS levels in Etobicoke Creek have gone down but there are conflicting trends in Lake Ontario. PFOS levels in Lake Ontario Lake Trout have levelled while PFOS concentrations in the lake’s sediment continue to rise (Figure 4.11). Government and industries have taken action by banning or phasing out the use of certain types of PFOS.
Through working with our partners, we have achieved measurable success in cleaning up contaminated areas in the Great Lakes basin:
- We have cleaned up toxic hot spots in Collingwood Harbour, Severn Sound and Wheatley Harbour (see Section 4.1, Water Quality in Ontario 2010 Report).
- Restoration actions at Spanish Harbour and Jackfish Bay (see section 4.4, this report) have started the environmental recovery there. Extensive clean up actions have brought us closer to restoring water quality at Peninsula Harbour.
- In the Great Lakes basin, through investigative monitoring using multiple sampling in targeted locations, we have tracked contamination to its source. This has resulted in many sediment clean-ups for contaminants including the remediation of Beaverdams (Figures 4.14 and 4.15, this report), Turkey and Sinister Creeks and the Cataraqui River.
The remainder of this chapter presents some of these key findings in more detail.
4.1 Monitoring Results for Mercury in Ontario’s Water
- Because mercury is naturally occurring and because it accumulates efficiently in fish, almost every fish in the world has at least trace levels of mercury.
- Mercury occurs naturally throughout the world. It can be released into the environment by natural sources (e.g. weathering of rocks, volcanoes, soils and oceans) and human activities (e.g. fossil fuel burning, pulp and paper bleaching, medical waste incineration, reservoir construction for hydro power and gold and ore mining).
- Eating fish or seafood is usually how people are exposed to mercury.
- Once mercury is in a waterbody, it can be converted into methylmercury by bacteria and enter into the food chain. As mercury moves up the food chain from bottomdwelling organisms to small and then larger fish, its concentration increases (biomagnification). The dominant type of mercury found in fish is methylmercury, which is toxic.
- Locations away from human activities can have naturally high mercury levels. Therefore, it’s a good idea to be cautious about eating fish from those locations.
- Although mercury emissions from human activities are decreasing in North America, they are rising globally due to increased contributions from newly industrialised countries such as China, which accounts for almost one-third of the global mercury emissions (Figure 4.116).
The Great Lakes
Over the past 100 years, a variety of industrial, agricultural and other human activities have affected the water quality of the Great Lakes. Historically, many legacy contaminants, including mercury, were discharged into the lakes. In response, governments on both sides of the border took action to clean up the Great Lakes.
Stricter regulatory limits and standards have dramatically cut mercury emissions in the Great Lakes region. Controls placed on point source discharges of mercury in the Great Lakes from industries, such as chlor-alkali plants and pulp and paper mills, have contributed to declines in mercury emissions. Lower mercury levels in fish reflect these reductions. Concentrations of mercury in fish declined significantly during the 1970s and 1980s (Figure 4.2)17. However, measurements over the last two decades suggest that mercury levels in the Great Lakes are declining at a slower rate, are stable or are weakly increasing ,even though there has been a decline in mercury emissions in the region (Figure 4.2)17.
Research suggests that multiple factors are contributing to the recent increasing trends. These include increased global emissions, invasive species, climate change and changes in water chemistry. For example, changes in the structure of food webs due to invasive species can enhance biomagnification of mercury in top-predator fish. Climate change and water chemistry can enhance the rate of conversion of mercury into toxic methylmercury.
Studies are underway to understand the behaviour of mercury in the Great Lakes. It is expected the study outcomes will guide future management actions to further reduce mercury levels. While the increasing mercury levels in fish from the Great Lakes are a concern, the current levels are relatively low. However, levels of some other legacy contaminants such as PCBs are elevated in many Great Lakes fish (see the Water Quality in Ontario 2010 Report, Chapter 4, pages 29 to 31). To minimize health concerns, members of the public should follow the province’s fish consumption advisories, published in the Guide to Eating Ontario Sport Fish.
Figure 4.1: Global human activity sources of mercury emissions to the atmosphere from 1990 to 2000 (in tonnes), (modified from Pacyna et al., 200616)
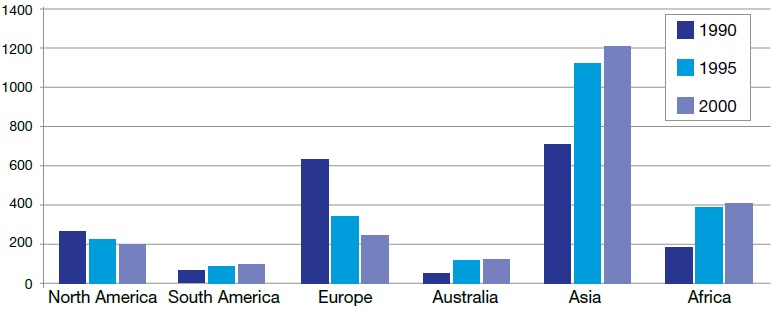
Figure 4.2: Long-term trends of mercury levels in fish from the Canadian waters of the Great Lakes (data from Bhavsar et al., 201017)
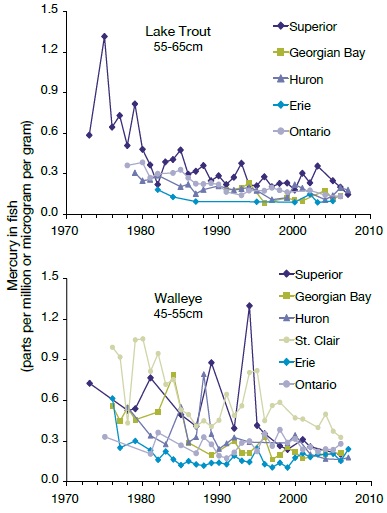
Did you know?
In general, fish mercury levels tend to be higher in the northern parts of this region and in the inland lakes compared to the Great Lakes.
Northern Ontario Lakes
Northern Ontario represents 87% of Ontario’s land area but has only about six% of the province’s population. Industrial activities, such as mining, forestry and hydropower, have affected some water bodies in Northern Ontario. However, most lakes are relatively undisturbed.
Many Northern Ontario locations are popular for fishing trips. Over the last four decades in partnership with the Ministry of Natural Resources, the ministry’s Sport Fish Contaminant Monitoring Program has analyzed mercury content in fish from hundreds of lakes in Northern Ontario to issue fish consumption advisories. This ongoing analysis has provided an opportunity to understand long-term changes in fish mercury levels.
Depending on the type and size of fish, we have seen a significant decline in mercury concentrations between the 1970s and 2010 in fish in many of the locations the ministry monitors (53 to 69%). Figure 4.3 shows mercury concentrations and the rate of change in mercury levels per decade for three fish types and for historical and recent scenarios. Despite these declines, it is still advised that the public (especially women and children) check the Guide to Eating Ontario Sport Fish before they consume any fish.
There were greater and more prevalent declines in mercury levels in fish during the 1970s and 1980s, corresponding to the introduction of strict standards for mercury in air emissions and effluent discharges in Ontario.
Over the last 10 to 15 years, 12 to 60% of locations showed declines in fish mercury levels in Northern Ontario. In contrast, southern Ontario has shown less fluctuation in the number of locations — from 70 to 80% — experiencing declining mercury levels in fish. However, the rates at which mercury levels in fish were declining have slowed in recent years. Multiple factors, such as increases in global emissions and climate change, are likely contributing to the increasing fish mercury levels in some lakes in Northern Ontario.
Figure 4.3: Mercury concentrations in Ontario with “n” indicating number of locations
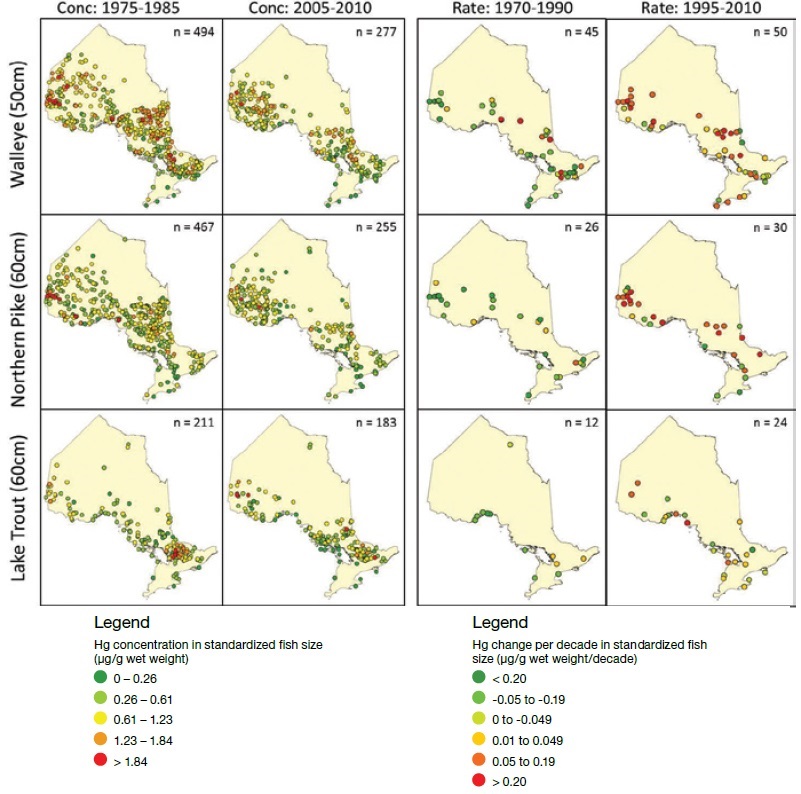
English-Wabigoon River System
The first discovery of mercury contamination in the English-Wabigoon River system was in the late 1960s. There were increased mercury levels in downstream fish due to discharges from a paper mill in Dryden. As a result, Ontario banned commercial fishing in the river system, recognizing that mercury contamination of fish is an important issue for the Grassy Narrows and Wabaseemoong First Nations communities who rely on these species for fishing and tourism.
Since the early 1970s, Ontario has regularly measured mercury levels in fish from the English-Wabigoon river system. The historic levels were comparable to other water bodies around the world that were heavily affected by mercury. However, there has been a decline in levels by as much as 90% over time. The long-term monitoring data suggests that the strong declining trends broke in the mid-1980s. Since then, levels have been either stable or slowly declining (Figure 4.4).
Figure 4.4: Long-term trends of mercury levels (microgram per gram or µg/g) in 50cm Walleye from four representative lakes of the English-Wabigoon River
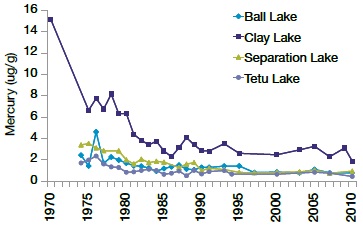
Despite the significant declines in mercury levels since the 1970s, current mercury levels in fish for the locations closer to Dryden are still well above those for the other regional water bodies. Certain types of fish such as Walleye (widely known as Pickerel) in these affected lakes are not good for consumption, especially by women and children. It is strongly recommended that people follow fish consumption advisories published in the Guide to Eating Ontario Sport Fish when consuming fish from the English-Wabigoon River system.
Did you know?
In the 1960s, Ontario banned commercial fishing in the English-Wabigoon River system because of high concentrations of mercury in fish. Since then, mercury levels have significantly decreased, but consumers of fish should still be cautious.
4.2 Monitoring Results for Metals in Sudbury Lakes
Metals Contamination of Sudbury Lakes
In Ontario, it was found that acid and metals deposition from the atmosphere were damaging lakes around the metal mining and smelting facilities in and around Sudbury (see the Water Quality in Ontario 2008 Report, pages 25 to 29). It is estimated that over 7,000 lakes in a 17,000 square kilometre zone around Sudbury were acidified by sulphur deposition associated with emissions from metal smelters (Figure 4.5). There was also contamination of the lakes closest to Sudbury with metals that were abundant in the smelter emissions, particularly copper and nickel. Species in these lakes that could not tolerate the higher levels of metals and acidity were reduced in number or eliminated altogether.
Recovery of Sudbury Region Lakes
Since the 1960s, pollution controls at the smelters have resulted in huge reductions in local metal and sulphur emissions (Figure 4.6). The reduced emissions have led to positive changes in the water quality of lakes in the Sudbury region. These changes include decreases in concentrations of metals (copper, nickel, and aluminium), sulphate and base cations (calcium, magnesium), and increased pH (decreased acidity).
Swan and Clearwater Lakes in Sudbury were both acidified and contaminated with nickel and copper. Whitepine Lake (89 kilometres north of Sudbury) was acidified but did not experience elevated metals concentrations. Figure 4.7 shows the changes in pH (acidity) over time in these three lakes and Figures 4.8a and 4.8b show their changes in nickel and copper concentrations, respectively.
Some Sudbury area lakes have shown improvements but many lakes still show elevated concentrations of metals and low pH values. Their recovery is continuing. The long-range atmospheric transport and deposition of sulphur provides acid inputs to many lakes. There is biological recovery in some lakes among different groups of organisms including fish, phytoplankton, benthic invertebrates and zooplankton. In many lakes, biological recovery is still at an early stage. Other lakes have improved enough to successfully re-introduce sport fish. The ministry continues to monitor Sudbury lakes to determine the long-term chemical responses to reduced metals and acid deposition.
It is clear that there is a close link between the chemical and biological recovery of the Sudbury lakes from elevated metal concentrations and acidification and the effects of other major environmental stressors, such as climate change. Periods of drought can lead to lake re-acidification and the release of metals stored in surrounding wetlands and terrestrial environments. For example, spikes in metal concentrations and acidity occurred in Swan Lake after a period of drought (Figures 4.7, 4.8a and 4.8b). This can have severe consequences for the biological recovery of lakes. There is a need for future studies of the recovery of metal- and aciddamaged lakes to be conducted in the context of multiple interacting stressors.
Figure 4.5: Location of the historical lake damage zone around the City of Greater Sudbury
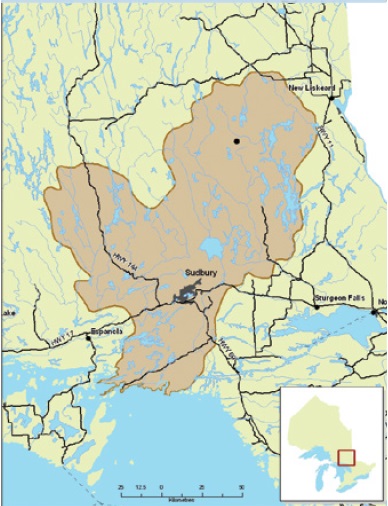
Studies of Sudbury lakes are giving us an understanding of chemical and biological lake recovery processes. Evidence of aquatic recovery from metal contamination and acidification is just starting to emerge from other parts of the world. Ongoing monitoring of lakes around Sudbury has shown the effectiveness of industry efforts to reduce pollution and justifies the use of regulatory mechanisms to encourage and enforce these measures.
Figure 4.6: Reduction in sulphur dioxide emissions (kilotonnes) from Sudbury smelting operations
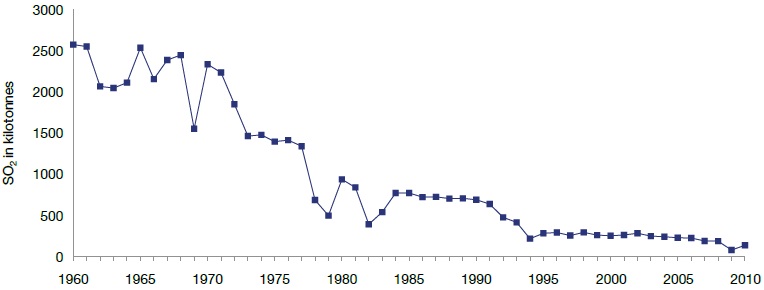
Figure 4.7: Mean annual pH values for Swan, Clearwater and Whitepine Lakes. Swan Lake experienced a drought-induced acidification in 1988
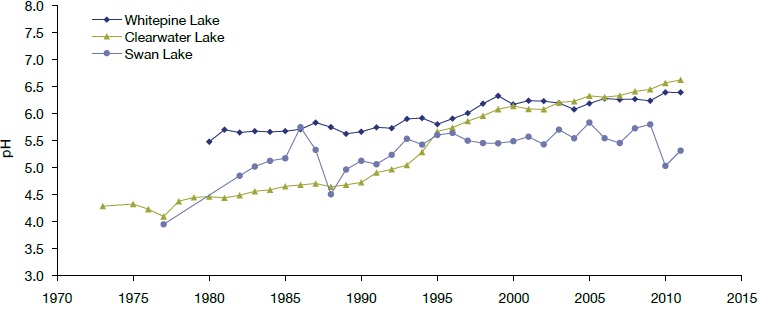
Figure 4.8A: Mean annual nickel concentrations (µg/L) for Swan, Clearwater and Whitepine Lakes. Along with the drought-induced acidification in 1988, Swan Lake also had substantially elevated nickel concentrations
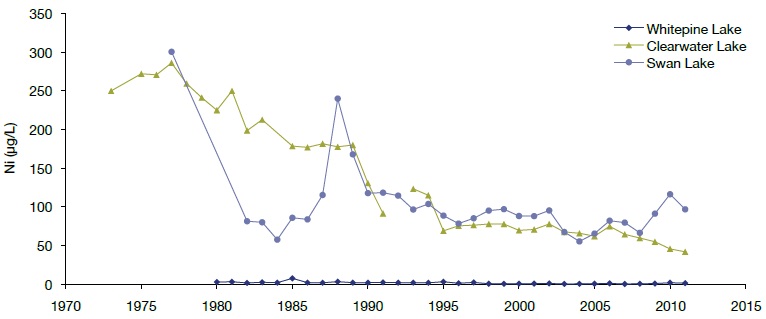
Figure 4.8B: Mean annual copper concentrations (µg/L) for Swan, Clearwater and Whitepine Lakes. Copper levels were also elevated after a period of drought in Swan Lake
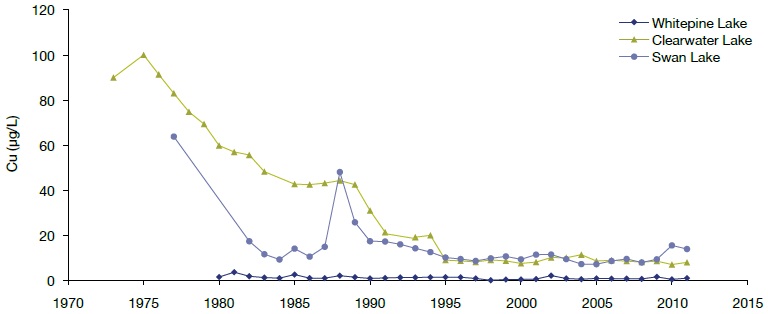
4.3 Monitoring Results for Chemicals of Emerging Concern
“Chemicals of emerging concern” form a broad category of compounds that were previously unknown, unrecognized or unregulated in the environment. Some commonly used chemicals and chemical classes have become recognized as chemicals of emerging concern or “emerging contaminants.” There is evidence that some emerging contaminants persist in the environment and have accumulated in organisms, like PFOS (perfluorooctane sulfonate). Others, such as pharmaceuticals, break down more readily and are not persistent. However, their ongoing use means that they continuously enter the environment through our waste streams, resulting in continued exposures that may affect organisms. The following section focuses on pharmaceuticals in the Great Lakes and PFOS in Etobicoke Creek and Lake Ontario.
Pharmaceuticals in the Great Lakes
Pharmaceuticals can enter surface waters from wastewater effluent, runoff from agricultural operations, and the application of manure and biosolids onto land. Pharmaceuticals entering the environment include:
- Over-the-counter medications (e.g. pain-killers)
- Prescription drugs (e.g. antibiotics and antidepressants)
- Hormones (e.g. those administered for birth control)
Scientists are working to understand the risks associated with trace quantities of pharmaceuticals detected in the environment (parts per trillion levels). It is not yet well known how these compounds interact and transform in the environment or if there are potential effects on plants and animals.
Through the Great Lakes Nearshore Monitoring and Assessment Program, the ministry has been monitoring for pharmaceuticals and other personal care products at selected sites in areas of the Great Lakes to determine concentrations of pharmaceuticals in both urban-influenced and background areas.
The ministry used a type of passive water sampler known as a Polar Organic Chemical Integrative Sampler (POCIS) for one-month periods (see the Water Quality in Ontario 2010 Report, section 7.1 for a definition of this type of sampler). Trent University researchers analyzed the samples to provide estimates of average concentrations of pharmaceuticals over that time. Figure 4.9 shows the results from studies in Lake Ontario (2006) and Lake Erie (2007). Pharmaceutical concentrations were generally in the low nanogram per litre (ng/L) or parts per trillion range. There were greater concentrations in the waters near urban centres influenced by municipal wastewater (e.g. Detroit-Windsor, Hamilton and Toronto18). Hamilton Harbour, which has limited exchange with Lake Ontario, receives effluents from four municipal wastewater treatment plants resulting in higher concentrations.
In 2008, the ministry undertook a more detailed study in an area near Pickering and Ajax on Lake Ontario. Figure 4.10 has examples of the results. Concentrations of most pharmaceuticals were greatest near the wastewater treatment plant discharge point in the nearshore but concentrations rapidly decreased to background concentrations (e.g. Gemfibrozil, a cholesterol regulator19). However, some pharmaceuticals (e.g. Ibuprofen, a pain-killer and anti-inflammatory drug) showed relatively even concentrations throughout the study area. Concentrations of pharmaceuticals in the most affected locations are in a range similar to those found in urban surface waters in Europe and the United States. Monitoring continues to examine the extent to which urban influences affect concentrations of the most frequently found compounds.
The ministry and other jurisdictions have been undertaking hazard assessments of pharmaceuticals and other compounds. This involves comparing concentrations in the environment to toxicology studies that examine the effects on indicator organisms. The monitoring data on the concentration and frequency of detection are used in hazard assessments that help the ministry identify substances for priority action and set standards and guidelines to better protect the environment.
Did you know?
The ministry’s Showcasing Water Innovation’s program has recently funded a research project involving York Region, University of Toronto and the ministry. Researchers will be testing an advanced oxidation process at a York Region wastewater treatment plant that could help with the removal of emerging contaminants such as pharmaceuticals and personal care products. If successful, the method could be integrated into other wastewater water systems in Ontario.
Figure 4.9: Concentrations (nanograms ⁄ litre) of selected pharmaceuticals in nearshore waters of Lake St. Clair, Lake Erie and Lake Ontario as estimated from POCIS passive samplers18
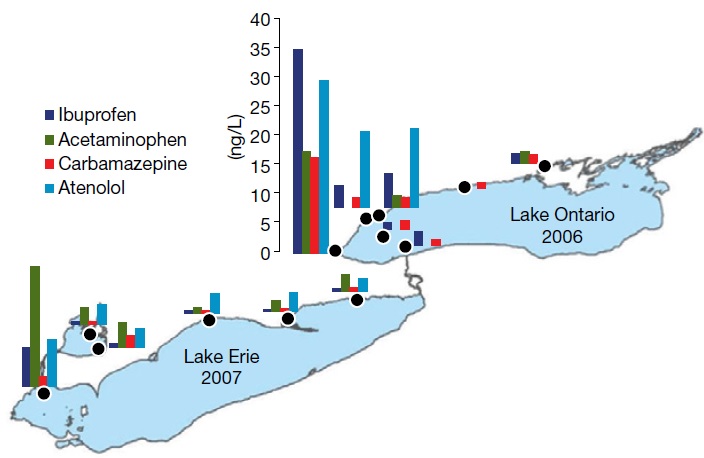
Figure 4.10: Concentrations (nanograms ⁄ litre) of the pharmaceuticals Gemfibrozil and Ibuprofen in surface waters estimated using POCIS passive samplers in June and September 2008 in a portion of the Lake Ontario nearshore zone influenced by wastewater treatment plant discharge19
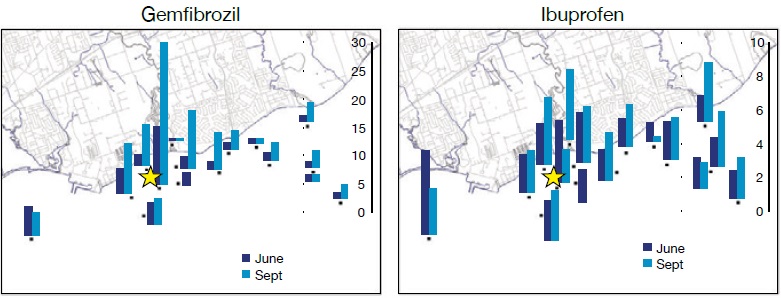
PFOS in Etobicoke Creek
Since the 1950s, many industrial and consumer applications have used perfluorinated alkyl substances (PFASs), also known as perfluorinated compounds. PFOS, a synthetic chemical, is one of the most frequently detected PFAS. Some related chemicals (called “PFOS precursors”) can transform or break down into PFOS in the environment. PFOS and its predecessors have unique surface properties, including making products oil-and water-repellent and stain- and stick-resistant. Consequently, they are in a variety of consumer products such as carpets, furniture, clothing, non-stick cookware, food packaging, personal care products (e.g. shampoo) and fire-fighting aqueous film forming foam (AFFF). Over the last decade, toxicity tests found that PFASs can have negative human health effects such as low birth weight and thyroid diseases. As a result, major manufacturers of PFOS and PFOS-related products have phased out their use.
AFFF is one of the key ways that PFOS enters the environment. In 2000, a fire alarm at an airline hanger at the Toronto Pearson International Airport malfunctioned, releasing 22,000 litres of PFOS-based AFFF. The AFFF passed through catch basins and storm sewers before entering into nearby Spring Creek, which merges into Etobicoke Creek. In 2005, firefighters used 48,000 litres of AFFF to extinguish the fire caused by the Air France flight 358 accident. Most of the AFFF washed into Etobicoke Creek, downstream of Spring Creek. Fortunately, studies showed that the AFFF from the 2005 incident did not contain PFOS.
Over the 10 years after the 2000 spill, the ministry monitored surface water, bottom sediment, and small-bodied fish (including the whole body and liver) at 10 locations in Etobicoke Creek. This monitoring covered a 25-kilometre stretch that included upstream of the spill outfall. Although there are still elevated PFOS levels in sediment near the 2000 spill outfall, the major impact is relatively local. PFOS levels in small-bodied fish at downstream locations have decreased by about 70 to 85% over time (Figure 4.11). PFOS concentrations in water have declined by more than 99% since the 2000 spill20. PFAS levels at upstream locations also went down. This reflects a change in background conditions20 and could be due to the phase out of these chemicals in consumer products.
Figure 4.11: Changes in sediment, water and fish PFOS levels at various locations in Etobicoke Creek between 2003 and 2009
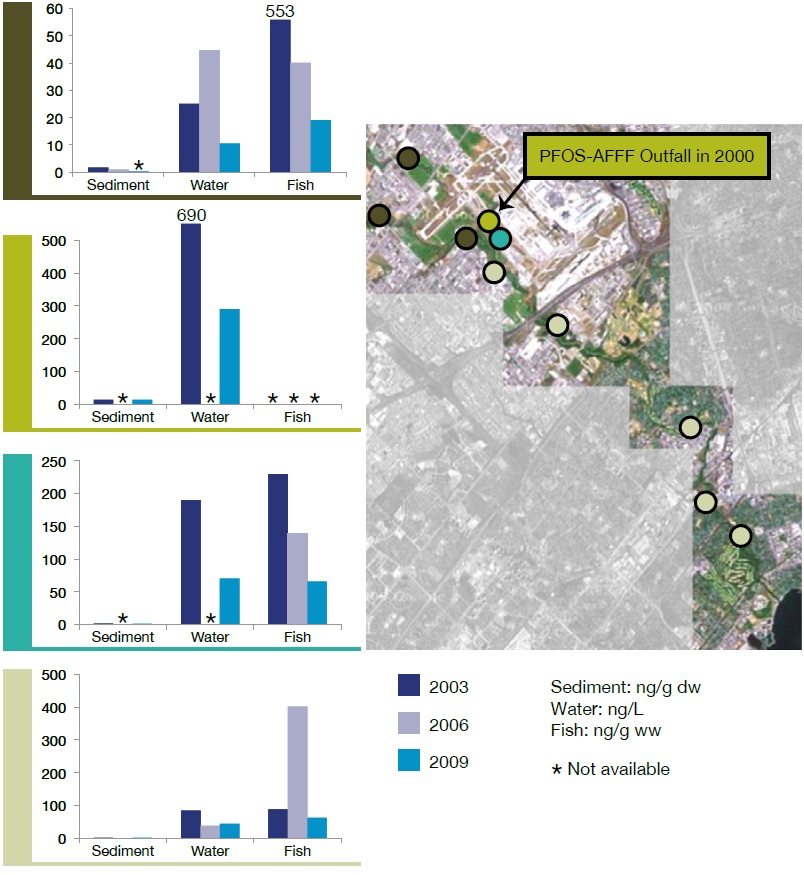
PFOS in Lake Ontario
Despite substantial declines of PFOS in Etobicoke Creek water, fish and sediment since the 2000 release of AFFF, the concentration trends in Lake Ontario, which is influenced by multiple sources of PFOS, are not as clear for the same period (Figure 4.12). Archived Lake Trout samples from Fisheries and Oceans Canada show increasing concentrations of PFASs in Lake Ontario from 1979 to 1993. There was a subsequent decline in the late 1990s and a levelling of concentrations into the 2000s21. Concentrations in sediment cores from the bottom of Lake Ontario continue to increase22. Concentrations of PFOS in suspended solids entering Lake Ontario from the Niagara River showed a decline in recent years. This coincides with the company 3M ending its manufacturing of PFOS22.
The results suggest a time lag between changes in the production and sale of PFOS and declines of PFOS levels in the Lake Ontario system. This may be due, in part, to the continued use of PFOS-containing products manufactured before industry’s phase out of both PFOS and precursors that transform into PFOS in sediment. Over time, it is expected that concentrations in Lake Ontario will decline.
Figure 4.12: Trends of concentrations of PFOS over time in Niagara River suspended sediments (top graph)20, in dated slices of a sediment core from Lake Ontario (middle graph)22 and in Lake Trout from Lake Ontario (bottom graph)21
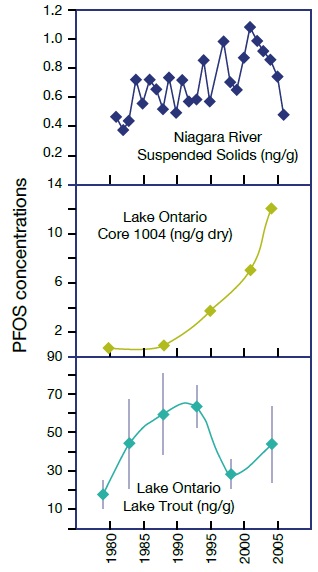
4.4 Cleaning up the Great Lakes Basin
Jackfish Bay Area in Recovery
Figure 4.13: Jackfish Bay AOC
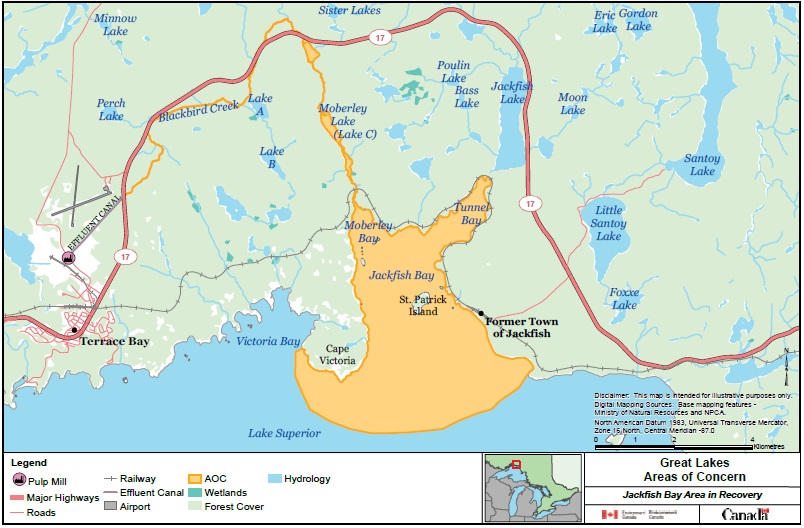
Jackfish Bay is on the north shore of Lake Superior near the town of Terrace Bay and about 225 kilometres northeast of Thunder Bay. In 1987, Jackfish Bay was designated an Area of Concern (AOC) under the Canada-US Great Lakes Water Quality Agreement because of the effluent discharge from an inland bleached kraft pulp mill. The AOC covers the effluent canal from the mill to Lake Superior. It includes a 14-kilometre reach of Blackbird Creek, Moberly Lake (Lake C) and Jackfish Bay (Figure 4.13). The mill, currently owned by Terrace Bay Pulp Inc., started operating in 1948 when there were no environmental controls in place.
The mill discharge was typical bleached kraft mill effluent. It had elevated concentrations of organochlorines (dioxins and furans), biological oxygen demand (BOD), resins, fatty acids, phenols, nutrients, chloroform, toluene, total suspended solids (TSS) and other compounds. Under low-flow conditions, over 90% of Blackbird Creek’s flow was effluent. Over time, the discharge of this toxic effluent degraded many aspects of the environment. It was also unsightly, making Blackbird Creek foamy, off-colour and odorous (Figure 4.14).
The Jackfish Bay Remedial Action Plan (RAP) was developed in 1988 to identify, address and restore the AOC. The beneficial use impairments in the Jackfish AOC Stage I Remedial Action Plan report (1991) included:
- Bird or animal deformities or reproductive problems
- Degradation of aesthetics
- Degradation of benthos
- Degradation of fish and wildlife populations
- Fish tumours and other deformities
- Loss of fish and wildlife habitat
- Restrictions on fish consumption
- Restrictions on navigational dredging activities
Figure 4.14: Blackbird Creek, Lake Superior’s Jackfish Bay AOC
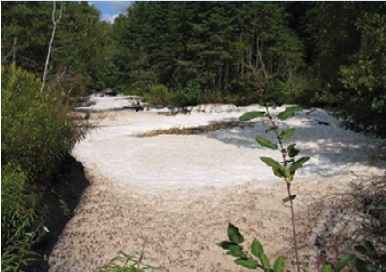
Over time, improvements to the effluent quality have reduced the environmental impact of the discharge. Two initiatives were crucial to the restoration efforts: the introduction and enforcement of federal and provincial legislation for the pulp and paper sector in the 1990s (Municipal/Industrial Strategy for Abatement), and ongoing improvements to the mill’s water treatment facility and processing. Lake A (next to Blackbird Creek, see Figure 4.13) previously had an accumulation of woody fibre and infill. Now, it is a productive wetland. This is due to the redirection of the effluent stream to bypass the lake. Thanks to the remedial actions and efforts, some of the beneficial use impairments (e.g. fish tumours) are no longer considered impaired.
Did you know?
Ontario has 17 Areas of Concern, of which 3 have been delisted: Collingwood Harbour (1994), Severn Sound (2003) and Wheatley Harbour (2010).
After the release of the Stage 1 RAP report23, government RAP partners and local stakeholders considered a variety of restoration options for the area. Natural recovery was their favoured option for restoring Jackfish Bay AOC24. The Canada-Ontario Agreement Respecting the Great Lakes Basin Ecosystem25 states that an area where there is consensus that “all scientifically feasible and economically reasonable actions have been implemented, and additional time is required for the environment to recover” shall be deemed as an Area in Recovery. The governments of Ontario and Canada, in conjunction with local stakeholders, formally recognized the Jackfish Bay AOC as being “in recovery” in May 201126. Ontario and Canada have acknowledged that natural recovery may take several decades. Consequently, they have committed to long-term monitoring to assess the recovery of the ecosystem.
The Beaverdams Creek PCB Remediation
Beaverdams Creek is in southern Ontario, near the City of Thorold. It is part of the Twelve Mile Creek watershed. In 1997, routine monitoring at the mouth of Twelve Mile Creek found high concentrations of PCB in fish and water samples, compared to other Lake Ontario tributaries. The source of the contamination was unknown. This prompted the ministry and its partners at Environment Canada to pursue investigative monitoring in the watershed including Lake Gibson and Beaverdams Creek. Figures 4.15a and 4.15b show the evolution of the trackdown from the Lake Gibson watershed scale to a limited stretch of Beaverdams Creek.
Did you know?
Investigative monitoring uses several types of samples together in targeted locations to make the most of efforts to track contamination to its source.
PCB contamination in sediment and water in Lake Gibson was higher than in other watersheds. These concentrations contributed to elevated PCBs in fish tissue that led to restrictions on fish consumption in Lake Gibson.
Working with regional and Conservation Authority partners, the ministry was able to pinpoint areas that needed the most attention in Beaverdams Creek. Scientists used the investigative monitoring that combined event-based water sampling, sediment sampling and the deployment of semipermeable membrane devices. Gathering evidence this way pointed to a particular hotspot and ruled out areas that did not appear to have any significant ongoing contamination.
Elevated PCB concentrations in a channel leading into Lake Gibson were linked to upstream sources found within and next to Beaverdams Creek. PCB patterns in Beaverdams Creek had “fingerprints” that were similar to PCB patterns in downstream areas, suggesting a specific location was contributing to ongoing contamination downstream. The PCB fingerprint was similar to a technical PCB mixture that was previously used in carbonless copy paper sources, making it possible to identify the contamination source and target it for remediation. Another source found at a nearby car parts manufacturer was attributed to PCBs used in cutting oils. This secondary contamination source was also identified for remediation.
With this evidence, ministry abatement staff could focus their efforts in getting the property owners of a paper recycling facility to clean up areas of contamination. The company hired consultants who assisted with more in-depth investigations. These investigations led to the identification of areas of severe sediment contamination that needed to be removed from the stream.
In June 2011, the resulting multi-phased dredging operations (Figure 4.16) were completed, with 23,109 tonnes of sediment from a 1,750-metre stretch of Beaverdams Creek and over 1,936 tonnes of hazardous PCB waste removed from the area. The companies worked collaboratively with the ministry and many stakeholders to effectively move the process along.
The multi-million dollar Beaverdams Creek PCB remediation is one of the most successful privately funded sediment remediation projects in Ontario’s history.
Did you know?
Source tracking using various lines of evidence has resulted in at least three more sediment clean ups for legacy contaminants in the Great Lakes Basin.
Trackdown Cataraqui River, 2004 to 2005: Removal of 500 m3 of sediment contaminated with PCB, mercury, chromium and other heavy metals from the river bottom near the Kingston Rowing Club.
Sinister Creek, 2006: Removal of over 3,000 tonnes of sediment and soils contaminated with PCBs, including 43 tonnes of hazardous waste level PCBs from Sinister Creek near Lindsay, Ontario. The area has been restored and enhanced with tree and shrub plantings and new habitats for fish and wildlife.
Trackdown Turkey Creek, 2008: Removal of 975 m3 of sediment contaminated with PCBs, PAHs and heavy metals from a highly industrial area. The area has been restored to include newly planted trees and new habitats for fish and wildlife. Plans are underway to create a biking trail.
Figure 4.15A & Figure 4.15B: Evolution of the trackdown from the Lake Gibson watershed scale to the Beaverdams Creek scale
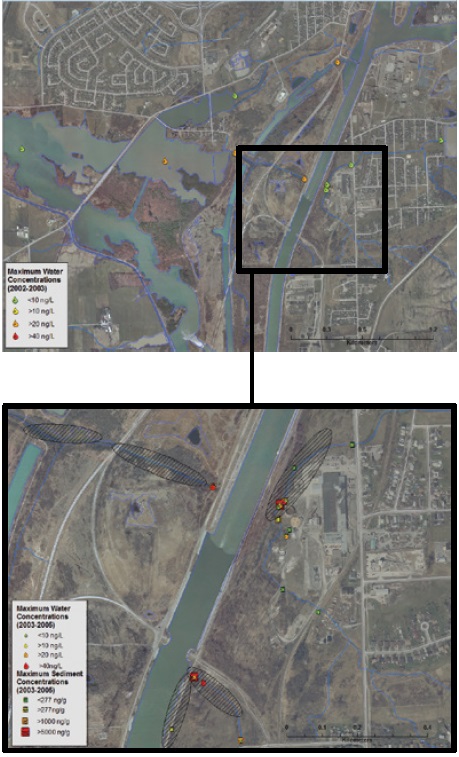
Figure 4.16 - Top photo: Water was removed from Beaverdams Creek by channelling its flow through a large pipeline. Workers were then able to remove the contaminated sediment from the creek bed and restore the creek to more natural conditions. The planting of trees and shrubs restored vegetation in the area and the addition of logs in the creek improved fish habitat. Middle photo: The pipeline channelling water from upstream areas ensured flow remained in downstream areas of Beaverdams Creek. Bottom photo: PCB-contaminated sediment was brought to a staging area where it was dried and hardened for safe transport to a hazardous waste facility for proper disposal.
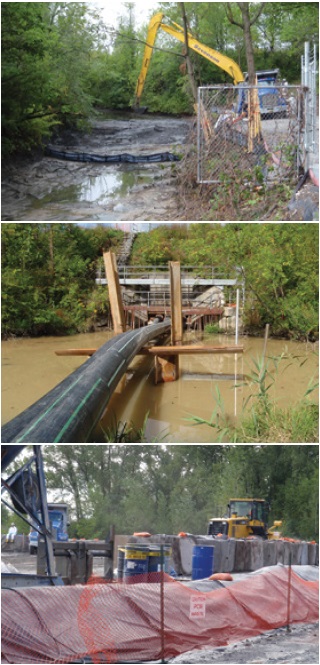
5.0 Climate Change
What is climate change?
Since the start of the industrial era, humans have released large amounts of greenhouse gases such as carbon dioxide and methane to the atmosphere, mainly by burning fossil fuels such as coal, oil and natural gas. Greenhouse gases trap radiation from the sun in the lower part of the Earth’s atmosphere. As the amount of greenhouse gases in the atmosphere increases, the amount of the sun’s heat that is trapped also increases, which raises temperatures.
This is known as the “greenhouse effect” and the resulting increase in temperature is called “global warming.” When global warming affects weather patterns, it is called “climate change.” Climate change is a long-term shift in the typical weather conditions at a given location. It is measured by temperature, amounts and intensity of precipitation (rain and snow), wind patterns and other parameters.
Will Ontario’s environment be affected by climate change?
In Ontario, it is predicted that average annual air temperatures will increase by 3 to 8°C over the next century. This could result in milder winters, longer growing seasons and increased frequency of severe weather events like storms including freezing rain, floods, droughts and heat waves. These changes will have positive and negative effects on Ontario’s environment, natural resources, human health and economy.
Ontario is already experiencing the effects of climate change
In Ontario, the effects of climate change are already present. Air temperatures have increased over the last century. Some of the highest rates of increase have been seen in northwestern Ontario. More frequent and intense weather events have also been recorded.
How will climate change affect Ontario’s water resources?
Ontario’s water resources are likely to experience the effects of climate change. Lower water levels and warmer water temperatures may also affect the quality of our lakes and rivers — for example, by increasing the concentration of mercury and other contaminants in the food chain.
Ontario is working closely with communities, industries and researchers to develop adaptation strategies to prepare and respond to the impacts of climate change along with mitigation strategies to minimize the effects of climate change. See Ontario’s Climate Change Progress Report for more information.
Climate change adaptation in the Great Lakes
Climate change adaptation strategies for the Great Lakes are being built into Great Lakes agreements and Ontario’s Great Lakes programs. Part of the strategy includes building on the current understanding of climate change impacts on the Great Lakes through additional research and investments in climate modelling and by continuing to support adaptation action. See Ontario’s Great Lakes Strategy for more information.
What is monitoring telling us?
The ministry has documented some of the effects of climate change on water quality in Ontario and presented them in previous Water Quality in Ontario Reports. For example:
- In Lake of the Woods, warmer air temperatures have resulted in longer ice-free periods (Water Quality in Ontario 2008 Report, Chapter 6, pages 45 to 47). In Lake Simcoe, warmer air temperatures in June and September have resulted in increases in the length of time the lake is separated into warm and cool layers (stratified). These changes are likely contributing to observed changes in the algae in the lake. This, in turn, is possibly affecting the food web of the lake (Water Quality in Ontario 2010 Report, Chapter 6, pages 47 to 50).
- In the Sutton River in Ontario’s Far North, warmer air temperatures likely also played a role in the die-offs of Brook Trout and White Suckers (Water Quality in Ontario 2010 Report, Chapter 6, page 51).
This report presents monitoring data that documents effects of climate change on Ontario’s lakes, streams and groundwater. These include the following:
- In some inland lakes, warmer air temperatures have resulted in a shorter ice-cover season (Figures 5.2a and 5.2b, section 5.1). Given the complexity of aquatic ecosystems, these changes in ice conditions will affect lakes in different ways.
- In some Ontario streams, we have measured changes in stream flow in the past three decades with a gradual decrease in annual precipitation and runoff (Figure 5.5a, Section 5.2), especially from 1970 to the 1990s. The long-term increase in dry conditions could be a threat to aquatic ecosystems in central Ontario.
- It is projected that periods of drought or low water conditions will become more frequent as we continue to experience the effects of climate change. The ministry recently used both historical and modeled groundwater levels from one of its monitoring wells to determine how periods of low water conditions affect groundwater levels in Ontario. It was found that groundwater levels were lowest during dry years such as the drought of 1998-1999 (Figure 5.9, Section 5.3). To ensure that the province is prepared for low water levels, the ministry is working with the Ministry of Natural Resources to incorporate groundwater levels in the Ontario Low Water Response plan.
- In four lakes in Ontario’s Far North, warmer air temperatures (as recorded in Churchill, Manitoba; see Figure 5.10) have been related to changes in the types and structure of algae (Figure 5.11, Section 5.4). These changes may affect higher levels of the food chain.
5.1 Inland Lakes
Ice Changes at Dorset Lakes
Ice cover plays a fundamental role in the biological, chemical and physical processes of freshwater ecosystems in cold regions. The ministry conducted an analysis of a 35-year dataset (1975 to 2009) at its Dorset Environmental Science Centre in Ontario’s Canadian Shield. This analysis found trends in ice phenology (ice-on and ice-off dates, or icecover season) and examined their relationships with climate factors like air temperature and wind speed. As Figure 5.1 shows, there was monitoring and study of the ice phenology of Grandview Lake between Baysville and Dorset and the general environmental processes at Dickie Lake (8 kilometres from Grandview Lake).
The date that ice formed on the lakes (ice-on date) ranged from days 315 to 362 of the year, showing a clear increasing trend over the 35 years (Figures 5.2a and 5.2b). This indicates that ice is forming later in the winter. The date the ice melted (ice-off date) ranged from days 91 and 126 of the year. It showed a slight but not a significant decline over time. This indicates that the ice is not melting earlier in the spring. The annual duration of the ice-cover season showed a strong decreasing trend. This means that the amount of time the lakes are covered by ice has decreased by 24 days over 35 years (1975-2009) or, on average, 7 days per 10 years.
Figure 5.1: Monitoring of ice phenology at Dorset Lakes
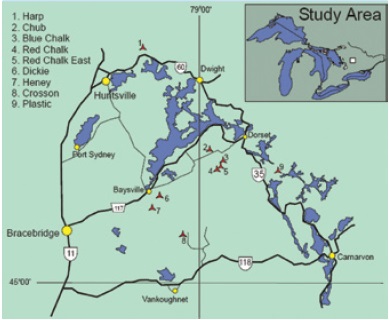
Figure 5.2A: Annual time series of ice-on date and ice-off date and temporal trend line, Dorset lakes
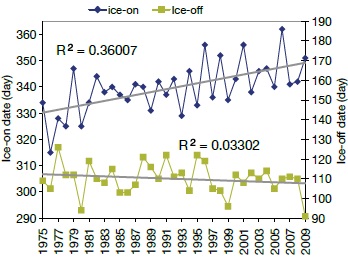
Figure 5.2B: Annual time series of ice-cover and ice-free duration and temporal trend line, Dorset lakes
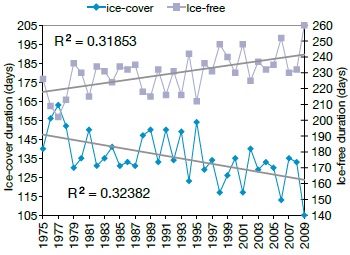
Many related climate and lake factors could cause these ice trends. These could include air temperature, lake temperature, wind speed, water column transparency, lake heat storage, the El-Nino southern oscillation index and the North Atlantic oscillation index. Some factors displayed strong or weak trends over time. Figures 5.3a and 5.3b show the annual series of explanatory factors (air temperature and wind speed in Figure 5.3a and lake temperature and transparency in Figure 5.3b).
Figure 5.3A: Annual series of explanatory factors (air temperature and wind speed), Dorset lakes
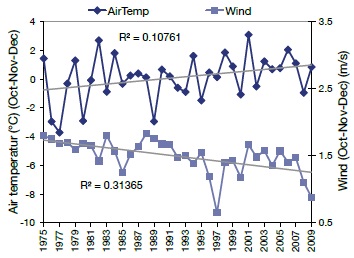
Figure 5.3B: Annual series of explanatory factors (lake temperature and transparency), Dorset lakes
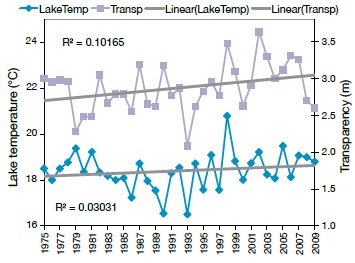
To find out which factors best explained the observed trend in ice cover, the ministry used two predictive methods on the dataset: a regression method and a lake model method. The regression method showed that for the ice-on date (Julian day), air temperature, wind speed and lake heat storage were the factors that explained the most variation (60%) (Figure 5.4a). For the ice-off date, air temperature was the only factor that explained some variation (Figure 5.4b).
The ministry applied a second method — the physically-based hydrothermal lake model (Hostetler) — to Dickie Lake. This method simulated ice dates using ice thickness calculations. Modelled results captured the variation patterns from 1978 to 2009 (Figure 5.4c). Their prediction accuracy was a little less than that of the local regression method.
The observation data and analyses demonstrated that the increase in ice-free duration was mainly due to increased air temperature, reduced wind speed and increased lake heat storage. The warmer winters and shortened ice season in recent years have weakened local tourist industries. A continued decrease in ice cover may have many different effects on aquatic habitats and communities, depending on the different interactions occurring in a lake ecosystem:
- Earlier ice breakup may increase the exposure and subsequent damage of organisms to UV radiation during long spring days, as well as decrease the abundance of certain zooplankton species27 and alter phytoplankton community structure28.
- A longer ice-free season may reduce lateseason dissolved oxygen concentrations in deeper lakes, resulting in concurrent losses of suitable thermal habitat for coldwater fish species.
- Warm-water fish species may benefit from a longer growing season that could increase overwinter survival29.
- Altered ice phenology in either the spring or fall may affect fish species that produce eggs over winter, resulting in a mismatch between hatching time and the availability of suitable prey.
Figures 5.4a, 5.4b and 5.4c set out comparisons of predicted and observed ice date using the regression method for a) ice-on date, b) ice-off date and c) comparison of modelled and observed ice date using the Hostetler lake model.
Figure 5.4A: Ice-on date, Dorset lakes. The three predictors, air temperature, wind speed and lake heat storage explained the most variation in the observed data set
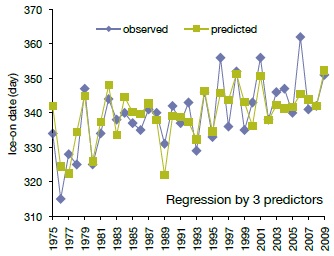
Figure 5.4B: Ice-off date, Dorset lakes. The predictor, air temperature, explained some variation in the observed data set
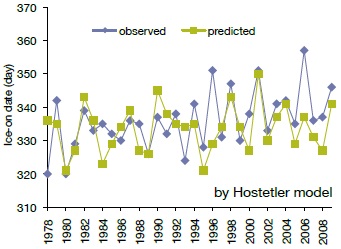
Figure 5.4C: Comparison of modelled and observed ice date, Dorset lakes
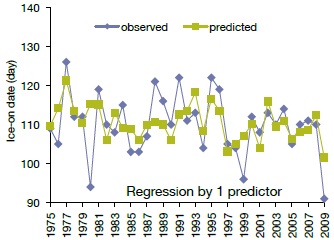
5.2 Streams
Climate Change Effects on Streams in Central Ontario
There are important linkages between the timing and magnitude of rainfall and runoff in watersheds and water quality conditions in streams and lakes. For example, the quality (phosphorus concentration) and the quantity of water determine the load or amount of phosphorus entering a lake from an inflowing stream. Changes in climate such as warmer temperatures or reductions in rainfall may alter the amount of runoff flowing through watersheds. Therefore, the ministry is actively involved in improving its understanding of the potential effects of climate change on stream water quantity in central Ontario.
Since the mid-1970s, there has been intensive monitoring of the Harp Lake watershed, located about 200 kilometres north of Toronto, for stream water quality and quantity. That monitoring found and investigated stream flow changes.
How Might Climate Change Affect Water Quantity and Quality in Central Ontario?
Our monitoring data suggest that over the past three decades, stream flow has been changing in Harp Lake and its watershed. We have seen a gradual decrease in annual precipitation and runoff (Figure 5.5a), especially from 1970 to the 1990s. By contrast, there is no trend in evaporation. This long-term decrease will affect the availability of water resources and could be a concern in the future. The number of dry and wet days (Figure 5.5b) indicates drier weather and reduced stream flows. Thirty-three years of monitoring show that, except for the years 1987 to 1991, there were significantly more dry days per year from 1996 to 2008 than from 1978 to 1995 and fewer wet days per year from 1996 to 2008.
The long-term increase in dry conditions could be a threat to aquatic ecosystems in central Ontario. For example, there is an association between elevated sulphate levels in streams during the fall rainy season and the elevated sulphate release from dried wetlands during drought days. This has delayed the recovery of acidified surface waters.
Stream flows in April, the major month for spring runoff at Harp Lake, were lower in the 1990s to 2000s than they were in the 1970s to 1980s. This is because of a decrease in snowfall. There is an association between snowmelt and the large portion of the annual nutrient load to small, inland lakes in the spring. This decrease in spring flows may significantly affect water quality and the associated ecology of streams and lakes on the Precambrian Shield because the nutrient input to a lake, lake level and temperature could affect chemical status.
Figures 5.5a, 5.5b and 5.5c show the stream flow patterns from 1978 to 2010 for the Harp Lake watershed. The solid lines indicate the values for each year. The dotted lines show temporal trends in:
- Annual precipitation (P), evaporation (E) and runoff (R) (Figure 5.5a)
- Annual number of dry days (i.e. where daily flow < 2 L/s) and wet days (daily flow > 130 L/s) (Figure 5.5b)
- Winter season precipitation (total: December to April) and mean flow for April (i.e. discharge L/s) (Figure 5.5c)
Figure 5.5A: Annual precipitation, Harp Lake watershed
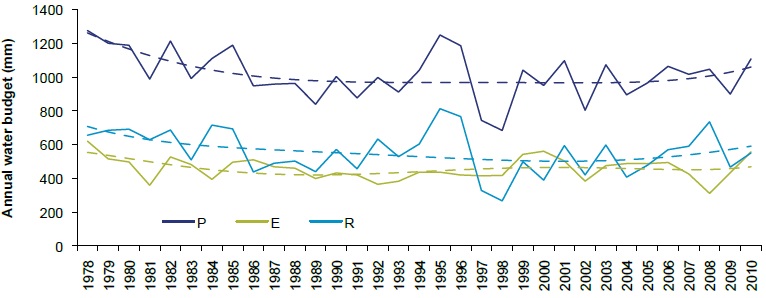
Figure 5.5B: Annual number of dry days, Harp Lake watershed
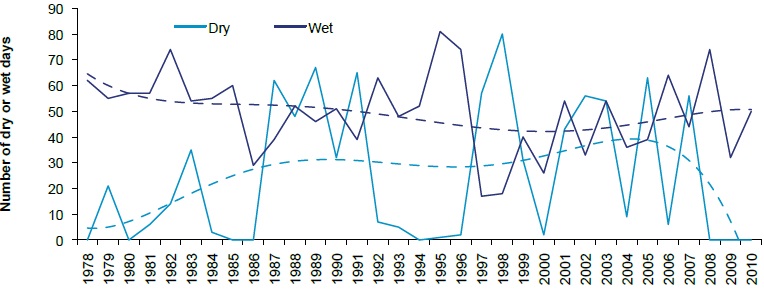
Figure 5.5C: Winter season precipitation, Harp Lake watershed
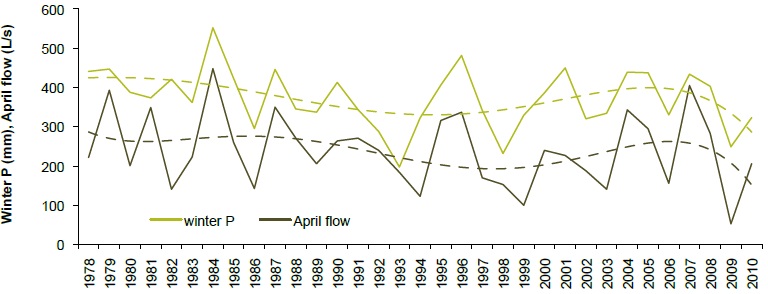
5.3 Groundwater
Drought, Groundwater Levels and Climate Change
Groundwater is important to the quality of life that we enjoy in Ontario and to the health of the province’s ecosystems and economy. Groundwater is a significant water resource for agriculture, industry and municipal and rural users.
Over the past 80 years, Ontario has experienced three drought periods: in the 1930s, from 1958 to 1963, and from 1998 to 1999. More recently, low water conditions occurred during the summers of 2007 and 2012. It is projected that periods of drought or low water conditions will become more frequent as we continue to experience the effects of climate change.
Ontario is likely to warm over the next 100 years by an annual average of 3 to 8°C. Associated with this warming trend are projected changes in the amount of rainfall, duration and distribution of snow cover and higher rates of evaporation and water loss. Drought frequency and intensity is also expected to increase. This would result in increased frequency and duration of low-water conditions.
Studying the impacts of historical drought will become more important as the effects of climate change increase the frequency and severity of drought.
The Ontario Low Water Response Program
In response to the 1998 to 1999 drought, the province established the Ontario Low Water Response (OLWR) program and the Provincial Groundwater Monitoring Network (PGMN). When droughts occur, the OLWR assists in the coordination of provincial and local responses to ensure the province is prepared for low water levels.
The PGMN, led by the ministry in partnership with Conservation Authorities and local municipalities, uses designated wells to monitor groundwater levels and quality throughout the province. Under the PGMN, there is hourly groundwater level collection from 474 wells along with annual water sample collection and analysis.
The Ministry of the Environment is working with the Ministry of Natural Resources to add groundwater levels as an indicator for the OLWR. One of the first steps is to better understand how past droughts have affected groundwater levels. This knowledge is essential to develop an understanding of how a changing climate can affect groundwater levels, now and in the future.
To capture the effects on groundwater levels of as many of these low water periods as possible, the ministry looked at the availability of historical groundwater level information. Some of the current PGMN monitoring wells were part of a previous monitoring network that collected data from 1966 to 1980. For a pilot project, the ministry selected a well that was drilled in 1965 and is still in operation today. The well is called PGMN Well W-09 (or W-09).
Located in southwestern Ontario, W-09 is a shallow 9-metre-deep well within the sand of the Norfolk Sand Plain. The ministry selected this well because of its continuous good quality water level records for both measurement periods; 1966 to 1980 and 2001 to 2009.
The graph in Figure 5.6 shows how groundwater levels from W-09 can vary throughout an average year. In Ontario, groundwater levels are highest in the spring, due to snowmelt, and at their lowest in the summer or fall because of higher temperatures and more evaporation.
Figure 5.7 shows the observed 2001 to 2009 groundwater levels from W-09. The annual groundwater level pattern repeats each year but the yearly pattern depends on temperature and the amount of precipitation. The lowest groundwater levels appeared during the summers of 2001, 2002 and 2007.
Those summers had higher than normal temperatures and lower than normal precipitation which led to low water conditions. These conditions may be local and do not necessarily occur across the province. In Figure 5.8, the groundwater levels from 2001 to 2009 are joined with the historical groundwater levels from 1966 to 1980. The total period has been extended from nine years to 43 years but there is still a 20-year gap. This gap would contain the impact of the 1998 to 1999 drought on groundwater levels.
To fill in the 20-year gap between measurements, the ministry used a simple model to reconstruct the groundwater levels between 1980 and 2001. The model used daily mean temperature and total precipitation from nearby climate stations to estimate a daily groundwater level.
As Figure 5.9 shows, the lowest groundwater level during this 43-year period occurred during the summer of 1998. This means that drought conditions are occurring for W-09 when groundwater levels drop to below an elevation of 232 metres. The 232-metre elevation is a benchmark for calculating near-drought levels and preparing for low water conditions.
Actions taken to prepare for low water conditions would also help Ontario adapt to a changing climate. Examples include water management, water conservation and irrigation practices; actions which will provide benefits no matter how the climate changes.
Through historical research and scientific modelling, the period of groundwater level records for W-09 has increased from nine years to 43 years. Longterm groundwater level records are important for determining the impacts of drought and for identifying trends caused by the variability and change of Ontario’s climate. The Ministry of the Environment is working with the Ministry of Natural Resources to link the historical groundwater levels with the recent levels from 17 other PGMN wells. This information will be useful for the Ontario Low Water Response, drinking water source protection and climate change adaptation.
Figure 5.6: Average annual groundwater level variations for PGMN Well W-09
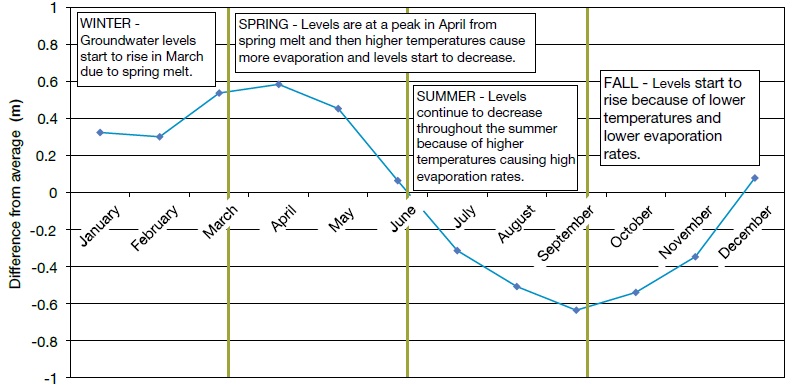
Figure 5.7: Observed groundwater levels, PGMN monitoring well W-09
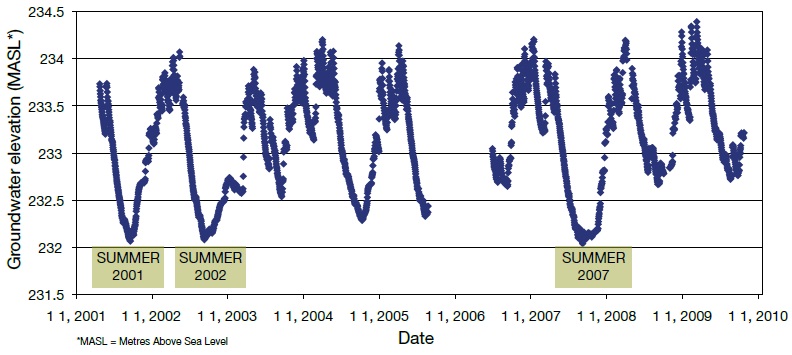
Figure 5.8: Measured groundwater levels from 1966 to 1980 and from 2001 to 2009 for PGMN Well W-09, with a 20-year gap
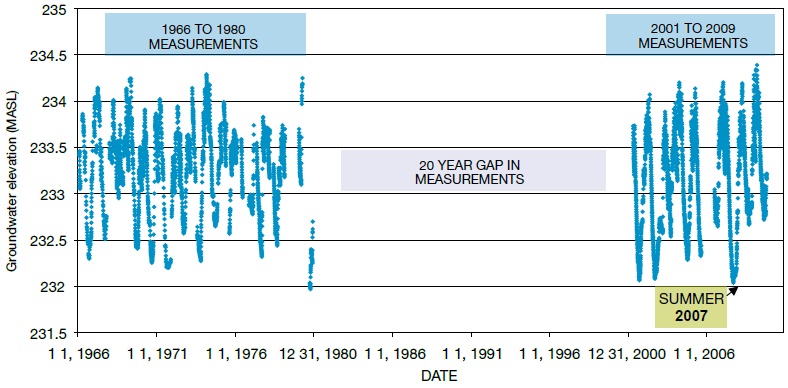
Figure 5.9: Measured groundwater levels (1966 to 2009) for PGMN Well W-09
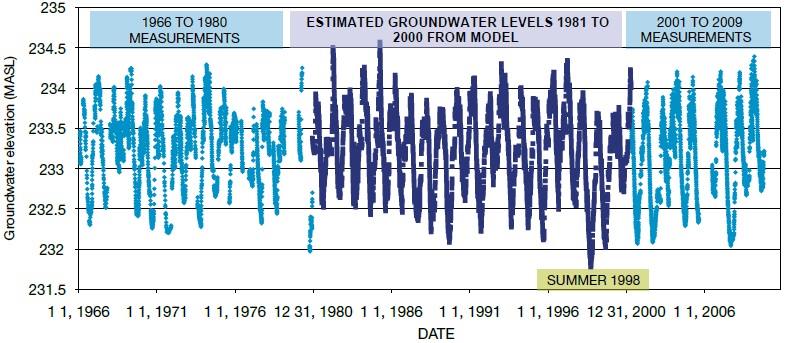
5.4 Far North
Evidence of Climate Change in Lakes in the Hudson Bay Lowlands
Until recently, the Hudson Bay Lowlands (HBL) of Ontario’s Far North were one of the last sub-Arctic places to be unaffected by climate change. This is mostly due to the influential role that Hudson Bay sea ice plays in moderating the regional climate. Starting in the mid-1990s, this region crossed a climate tipping point, dramatically altering local ecosystems. For example, in 2001, extreme summer air temperatures warmed the Sutton River and its headwater lake (Hawley Lake), enough to kill many Brook Charr (see Water Quality in Ontario 2010 Report30). The long-term consequences for other ecosystems in the HBL, including its vast store of carbon31 and the survival of key species, such as polar bears32, are active research topics in Ontario’s Far North.
Given the continuing decline in Hudson Bay of the extent and seasonal duration of sea ice, the ministry has entered a partnership with scientists at Laurentian and Queen’s universities to reconstruct the history of HBL lakes. Using information preserved in lake sediment cores, scientists aim to improve their understanding of how lakes have responded to recent warming over the past few decades. The remoteness of this region, together with its recent emergence into a new type of climate, provides a rare, natural research site to assess the effects of global climate change in the absence of other human impacts.
Of the many biological remains preserved in lake sediments, diatoms are particularly sensitive to changes in their environment. Diatoms are a diverse group of microscopic algae. The survival of diatom species in lakes depends on physical properties such as light, water temperature and water quality. Water quality includes the availability of nutrients that are essential to diatom growth.
The diatom species in a lake vary with the lake’s conditions. Thus, as climate change alters the physical and chemical conditions, the abundance and composition of diatom species also changes. Because algae form the base of aquatic food webs, these changes may affect higher levels of the food web (e.g. aquatic animals and fish).
The HBL climate tipping point in the mid-1990s was marked by increased air temperatures, reductions in the sea ice and changes in the timing of ice-off and ice-on in Hudson Bay33, 34. The sharp increase in air temperature in the 1990s is clearly visible in the temperature record from Churchill, Manitoba (Figure 5.10). Figure 5.10 shows the mean annual temperature record in Churchill from 1943 to 2011. The black dots represent the raw temperature data. The black line shows the 3-year running average of temperature. The red line shows a breakpoint in the record at 1991.
Figure 5.10: Mean annual temperature record from Churchill, MB from 1943 to 2011
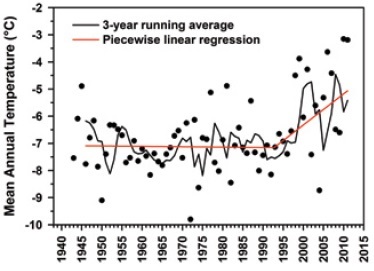
Along with this sudden increase in air temperature, the researchers observed changes in diatom composition in several lakes (Figure 5.11). These changes included an increase in the relative abundance of free-floating (planktonic) diatoms and an overall increase in diatom diversity. Small, planktonic species are able to out-compete others as lake conditions change with a warmer climate.
This HBL research shows that biological responses to climate change are not gradual. In fact, aquatic ecosystems can respond rapidly to warming as tipping points are crossed. Looking at these changes in hundreds of lakes across the Northern Hemisphere confirms that the HBL lakes are responding to a warming environment.
The changes are widespread. They have occurred with increases in mean temperatures that are much lower than the levels we have projected for Ontario’s Far North over the next half century. The implications of the observed changes, such as for the aquatic food-webs, remains unclear.
Figure 5.11 has bar graphs that show increases in the relative abundance of planktonic diatoms (top) and diatom diversity (bottom) over time. The data are an average of results from four lakes in the Hawley Lake area of the HBL. The biological changes are compared to the change in mean annual temperature from Churchill, Manitoba (blue line).
Figure 5.11: Increases in the relative abundance of planktonic diatoms (top bar graph) and diatom diversity (bottom bar graph) over time, from four lakes in the Sutton River region of the HBL. Biological changes are shown against changes in mean annual air temperature in Churchill, MB.
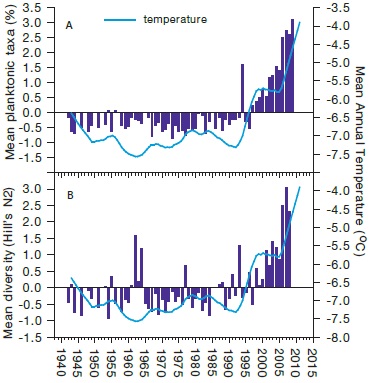
6.0 What are Other Issues Affecting Water Quality?
While the ministry’s monitoring programs focus on studying the effects of nutrients, contaminants and climate change on Ontario’s water, we also work with our many partners to examine other issues that affect water quality.
The ministry is helping monitor these issues to understand their impact on Ontario’s water. This chapter features some results from our collaborative work with the following findings discussed in more detail below:
- Over the past five decades, many invasive species have established in Lake of Woods with almost ten confirmed invaders such as the Rainbow Smelt and spiny water flea. Some potential impacts of invasive species in Lake of the Woods include the decline or elimination of other native species and changes in the food web of the lake’s ecosystem. The ministry supports the Ministry of Natural Resources as the lead ministry for invasive species in the province. We work as a partner to help educate and enhance public awareness of aquatic invasive species in the lake.
- Studies in select lake and river locations in Ontario show that contamination with pathogens and other fecally-derived microorganisms, is common. In general, this type of contamination is highest closer to the shoreline where most recreation activities occur, compared to offshore waters. The level of contamination is affected by the seasons, general weather conditions and impacts from human-related activities. The ministry conducts ongoing monitoring of pathogen contamination in a variety of water sources in Ontario.
- Calcium levels in Ontario’s inland lakes are declining due to acid rain and timber harvesting and regrowth. This drop in calcium levels has resulted in a decrease in calciumrich zooplankton populations in our inland lakes. Zooplankton are important parts of the aquatic food chain. The ministry has increased its monitoring of calcium levels to better understand the impacts of changing calcium levels.
6.1 Invasive Species in Lake of the Woods
Section 3.1 of this report and section 5.1 of the Water Quality in Ontario 2010 Report discuss the effect of invasive species on the Great Lakes and Lake Simcoe. The ministry plays an important role in supporting the Ministry of Natural Resource’s Invasive Species Strategic Plan by engaging municipalities, conservation authorities, Aboriginal communities, non-governmental organizations and other key stakeholders to build effective communication networks within the province.
Lake of the Woods covers an area of 385,000 hectares and is the largest lake in the Winnipeg River drainage basin, part of the immense Nelson River watershed that drains into Hudson Bay35.
Lake of the Woods is vulnerable to invasive species because it is close to several other watersheds and large bodies of water that are home to aquatic invasive species, including the Mississippi and the Great Lakes-St. Lawrence watersheds. It also has suitable habitat and water quality for many invasive species and receives a high amount of boat traffic from tourism and fishing35. All these factors mean that unless preventive measures are in place, there is a high probability of the transference of nonnative organisms from nearby water bodies.
Because Ontario, Manitoba and Minnesota share Lake of the Woods, there are different policies and management actions in place and no single agency is in charge across the lake, emphasizing the need for ongoing coordination.
Many non-native species have invaded the lake over the last 49 years. Confirmed invaders are: the Rainbow Smelt, spiny water flea, the zooplankton Eubosmina coregoni, rusty crayfish, papershell crayfish, northern clearwater crayfish, the hybrid cattail, the common reed and purple loosestrife. Fortunately, it’s unlikely that zebra mussels will be established in the lake because of the low calcium concentrations. Zebra mussels need ambient calcium concentrations of 20-28 mg/L36 and Lake of the Woods’ average calcium concentrations are typically less than 15-20 mg/L.
Many agencies in Canada and the United States are working together to monitor the spread and evaluate the risk of invasive species in Lake of the Woods and its watershed:
- The Ontario Ministry of Natural Resources and its partners, particularly the Ontario Federation of Anglers and Hunters, through its Invasive Species Reporting Hotline, track exotic species in the lake.
- The Lake of the Woods District Property Owners’ Association and the Federation of Ontario Cottagers’ Associations have worked with the Ministry of the Environment to educate and enhance public awareness of aquatic invasive species.
- The Ministry of Natural Resources has released its Ontario Invasive Species Strategic Plan 2012. The plan outlines the problems that Ontario faces due to invasive species and sets out potential solutions.
| Common Name/Scientific Name | First Recorded | Likely Route of Invasion | Possible Impacts |
|---|---|---|---|
| Vertebrate: Rainbow Smelt37 Osmerus mordax |
1991 |
|
|
| Invertebrate: Spiny water flea38 Bythotrephes longimanus |
2007 |
|
|
| Invertebrate: Zooplankton water flea39 Eubosminaco regoni |
Early 1990s |
|
|
| Invertebrate: Rusty crayfish40,41 Orconectes rusticus |
1963 – Long Bay; east side of Lake of the Woods |
|
|
| Invertebrate: Papershell crayfish40,42 Orconectes immunis |
After 1975 - Snake Bay |
|
|
| Vegetation: Hybrid cattail43 Typha xglauca |
Late 1900s |
|
|
| Vegetation: Common reed44 Phragmites australis |
Native to North America along Atlantic and Pacific coast
By the early 1900s the species was considered more common and spreading |
|
|
| Vegetation: Purple loosestrife45 Lythrum salicaria |
Initially introduced into North America in the early 1800s |
|
|
6.2 Pathogens
People in Ontario understand and value the importance of clean, safe water for recreational purposes. Many recreational activities, such as swimming, boating and fishing, take place on Ontario’s lakes and rivers.
E. coli (Escherichia coli) is a bacteria found in the intestines of all mammals and is excreted in their feces. Most strains of E. coli are harmless to people but many pathogens that cause gastrointestinal illness can originate from fecal contamination. They can include Salmonella, Campylobacter and Cryptosporidium. These pathogens are difficult to detect so E. coli is often used to signal the presence of fecal contamination in water. This contamination can also contain pathogens that might affect human health.
Contamination in recreational waters can come from a variety of sources; sewage discharges, agricultural runoff, urban stormwater discharge, pet and wildlife waste or even other bathers. All these sources can result in elevated E. coli levels and pathogen occurrence, especially after storm events when there is increased run-off. Recent studies have also pointed toward the contribution of nonfecal sources of E. coli including beach sands46 and the green algae Cladophora47, although the overall contribution of these sources to water quality problems and the risk to human health is not known.
In the summer months, local health units throughout Ontario regularly test water at bathing beaches and post signage if the beaches are not safe for swimming. However, not all waters in Ontario are considered bathing beaches. People should check with local health units before swimming in locations that are not marked as recreational beaches.
The ministry has been involved in several studies to understand the presence and variability of bacteria and pathogens in various waters in Ontario, including the Great Lakes, inland lakes and rivers.
Understanding E. coli Trends Along Lake Ontario’s Shores
The water quality along the Great Lakes’ shores can be quite different from offshore water quality. To protect human health, it is important to understand how land use and environmental factors influence the quality of water where people swim and take part in other recreational activities.
In 2008, the ministry conducted intensive monitoring along the north shores of Lake Ontario. Similar to many other land-based contaminants, E. coli levels were highest and more variable in the rivers and along the shoreline (0 to 1.2 metre depth). These are frequent recreational areas. E. coli levels tended to decline drastically the farther (1 to 3 kilometres) out into the lake. Figure 6.1 shows levels of E. coli plotted against the distance from the Lake Ontario shoreline in the area of the Town of Ajax. This suggests that several factors may strongly influence E. coli levels along the shore, including: erosion of the shoreline caused by wave action or heavy rainfall, shoreline land uses and rivers discharging into the lake.
The sources and movement of fecal contamination along the shores of the Great Lakes can be complex. Lake currents that travel parallel to the shoreline tend to accelerate the movement and re-suspension of E. coli along the shore. The occurrence of E. coli along the shore is further complicated because E. coli can originate from non-fecal sources like beach sands46 and algae47. Understanding these complex factors helps build predictive models that can better forecast times of increased contamination. These models are essential for better management of the shoreline and protecting public health.
For example, the ministry has funded a project in conjunction with the City of Toronto’s public health department to develop predictive models for six beaches in Toronto. The City of Toronto continues to refine these models and implement them to better protect the health of beach-goers.
Figure 6.1: Levels of E. coli plotted against distance from the shoreline of Lake Ontario in the Town of Ajax area (east of Toronto), (modified from Howell et al., 201248)
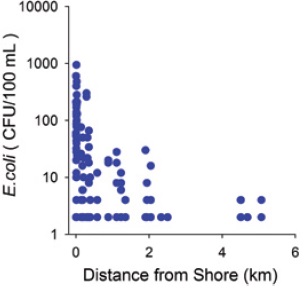
Pathogen Occurrence in the Grand River Watershed
Since 2008, the ministry has been a partner on the C-EnterNet surveillance program, led by the Public Health Agency of Canada. The aim of this multi-partner program is to have a better understanding of how Canadians are exposed to enteric pathogens, microorganisms that can cause intestinal infections. The symptoms can range from a few days of vomiting and/or diarrhea, to chronic conditions and even death. Human exposure to enteric pathogens can occur in a number of ways, including exposure to infected animals and humans and consuming contaminated food and water.
The water surveillance component of C-EnterNet includes collecting untreated river water samples at multiple spots within the Grand River watershed. Sample collection occurs at routine sampling sites, including locations in agriculturally dominated streams, at a drinking water intake and at a wastewater effluent point (Figure 6.2). There are biweekly analyses of water samples for chemical parameters, fecal indicator bacteria and several enteric pathogens. Also, because swimming was a risk factor at several recreational sites in the past49, sampling began (Figure 6.3) in 2011 to better understand pathogen presence at these locations. Water sample collection took place at three locations during the swimming season: two local bathing beaches and one river recreation location in the Grand River.
Figure 6.2: Collecting water samples in the Grand River under the C-EnterNet Program
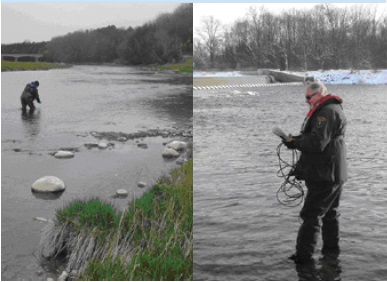
In 2011, swimming advisory postings by the local public health unit at both bathing beaches in the late summer months were more frequent due to elevated E. coli levels. Compared to these beaches, the river location had consistently higher E. coli levels throughout the season. The analysis detected several pathogens throughout the season at these three locations. For example, Campylobacter, a common cause of gastroenteritis in humans, was detected in 56% of the samples collected during the summer of 201150.
Figure 6.3: Field staff monitoring water quality at a Grand River recreational beach
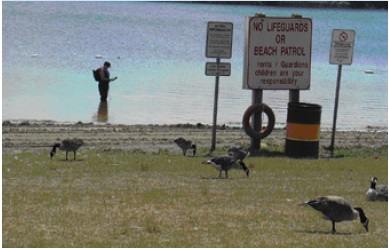
The information that the supplemental recreational water study collected will help to establish how recreational exposure such as swimming and canoeing may contribute to enteric illness in people, particularly infections that appear to peak in the warmer summer months.
Pathogens at Lake Simcoe Beaches
Regional Health Units routinely monitor bathing beaches around Lake Simcoe for E. coli. Between 2006 and 2008, 26 of 29 monitored beaches posted swimming advisories due to high E. coli levels. The most frequent closures were at beaches along the lake’s southern and eastern shores51.
To further identify the presence of human pathogens in Lake Simcoe, the ministry collaborated with Environment Canada and the University of Guelph to monitor five Lake Simcoe beaches along the southeastern shore of the lake during the ice-free seasons of 2010 and 2011. Water sample collection took place every other week from beach pore water (i.e. water collected from a hole dug in the beach sand) and from ankle- and chest-deep water offshore of the beach area. Samples were analyzed for the presence of Campylobacter. All five beaches had detectable but low frequency levels of Campylobacter. In general, Campylobacter levels were highest in the pore water. Moving offshore, levels decreased with the lowest levels found in chest-deep water. There was also Campylobacter in water samples from nearby rivers and in bird fecal matter collected from the beach areas, indicating runoff and birds may be sources of Campylobacter in the Lake Simcoe watershed52.
There was also analysis of beach and river water samples for the presence of a group of bacteria called Bacteroidales, harmless bacteria found in the gut of all mammals. Following advanced genetic analysis, it was possible to detect hostspecific markers in these bacteria to help identify the source(s) of the fecal pollution affecting the water and beaches. Throughout the sampling season, results indicated the presence of low levels of Bacteroidales of human origin and high levels of Bacteroidales from cattle during the late fall. This suggests that urban and agricultural runoff contribute to bacteria levels in Lake Simcoe53.
6.3 Calcium Decline in Inland Lakes
Most of Ontario’s lakes have soft, poorly buffered waters, making them very vulnerable to acid rain. The Water Quality in Ontario 2008 Report described how the recovery of lakes from acid rain has generally been slower than anticipated, despite significant reductions in acid inputs. There are likely many reasons for the lag in recovery. (See Recovery of Sudbury Region Lakes, section 4.2). The longterm depletion of calcium in watershed soils is one important factor.
Decline in lake calcium is an active area of scientific research in Ontario and has been found to have a variety of causes. Figure 6.4 shows some of the factors leading to reduced calcium in watershed soils and, consequently, lower calcium in softwater lakes.
Figure 6.4: Some factors leading to reduced calcium in watershed soils and, thus, lower calcium levels in softwater lakes
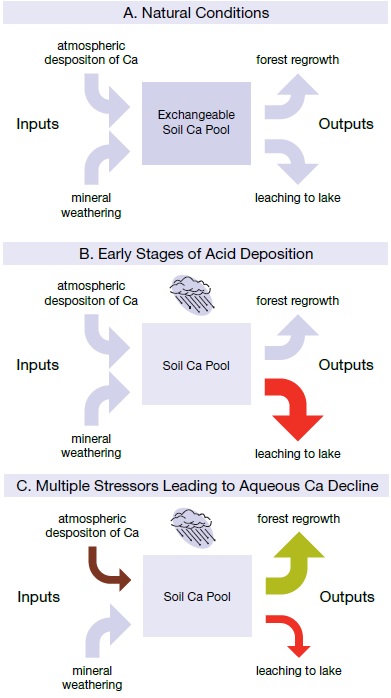
The main sources of calcium for lakes are the bedrock and soils within their watersheds (Figure 6.4a). Before human disturbances, mineral weathering of rocks and atmospheric deposition of calcium-rich dust were the main sources of calcium to soils. The major outputs were forest regrowth and the leaching of calcium to lakes and rivers. In the early days of acid rain, calcium leaked into lakes faster than it could be replenished through weathering or atmospheric deposits (e.g. dust). Initially, calcium levels in lakes likely increased because of this transfer of calcium from the watershed to lakes (Figure 6.4b).
Eventually, continued acid rain diminished the pool of available calcium in watershed soils to the point that there was a great reduction in calcium leaching. Other disturbances, such as timber harvesting, caused more calcium loss from the ecosystem. Tree regrowth after harvesting removes more calcium from the soil, further diminishing the supply available for export to lakes54. For example, soil calcium replacement times following full-tree harvesting in boreal forest ecosystems can be longer than harvest rotations, suggesting a continued decline in soil pools over successive rotations55, 56. Also, calcium-rich dust is now declining in many regions as roads are paved and agriculture becomes less prevalent in some regions, further exacerbating the problem (Figure 6.4c).
All living organisms require calcium to varying degrees. For example, water fleas (zooplankton) are tiny organisms and some species are very sensitive to declining calcium levels. They use calcium in water to regenerate their body coverings when they moult. Water fleas are important members of aquatic ecosystems and have long been the focus of studies of lake acidification and recovery. Figure 6.5a shows an image of a calcium-rich Daphnia, a type of zooplankton.
Figures 6.5 A and B: Images of a calcium-rich Daphnia and changes in the abundance of remains of a calcium-rich group of water fleas, the Daphnia pulex complex, relative to other zooplankton, (modified from a version presented in Jeziorski et al., 200857)
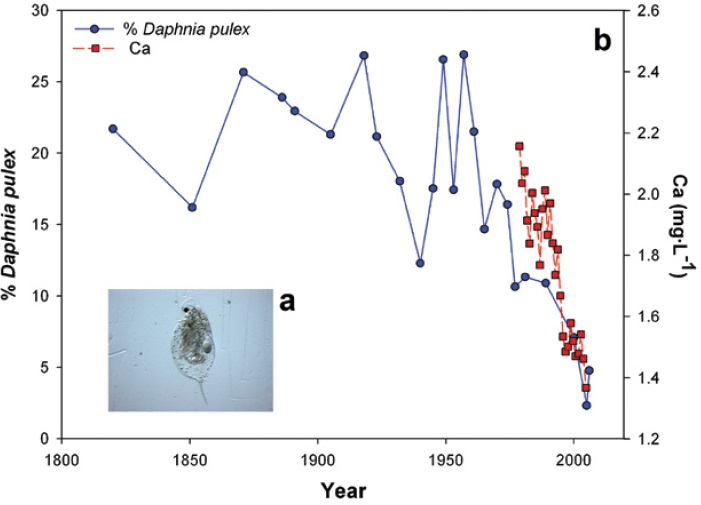
Recent laboratory and field experiments have shown that lake calcium concentrations below 1.5 mg/L may jeopardize the survival of some calcium-rich zooplankton species. Many lakes on the Precambrian Shield in Ontario are nearing or have recently crossed this important threshold. Over 40% of sampled ponds in the Dorset area currently have calcium levels below 1.5 mg/L. The ministry has increased its monitoring of calcium levels through the Lake Partner Program to better understand the impacts of changing calcium levels.
In November 200853, academic, ministry and other government researchers reported in the journal Science the first evidence of biological damage from declining calcium levels in North America’s lakes. Aquatic researchers studied the remains of water fleas preserved in lake sediment cores from Plastic Lake, Ontario. Figure 6.5b shows that in the late-1960s and early-1970s, they found sharp declines in the abundance of a calcium-rich zooplankton species, Daphnia pulex complex, relative to other water fleas. This decline corresponded to declining calcium levels in the lake. The drop in the availability of calcium in Plastic Lake was the only explanation for the decline in Daphnia pulex complex abundance. The implications for similar lakes across Ontario are unclear.
7.0 Summary
This report shows there have been some improvements in Ontario’s water quality but there is still much work to be done. The Ministry of the Environment’s monitoring and reporting programs provide essential information to protect water quality in Ontario.
Over the years, we have seen some improvements:
- Phosphorus levels have generally decreased in the Great Lakes and some inland lakes and streams since monitoring began.
- Due to actions taken since the 1980s, phosphorus levels in Lake Simcoe have decreased. This has contributed to increases in dissolved oxygen concentrations in the deep waters of the lake, ensuring a viable coldwater fish habitat.
- Since the 1970s, concentrations of mercury, PCBs and dioxins and furans have declined by as much as 90% in sport fish from Canadian waters of the Great Lakes.
- Efforts to reduce mercury emissions have resulted in a long-term decline in the levels of mercury in fish in the Great Lakes, many Northern Ontario inland lakes and in the English-Wabigoon River.
- The combined efforts of federal, provincial and local agencies have improved conditions in the Great Lakes basin, including Collingwood Harbour, Severn Sound and Wheatley Harbour. Thanks to clean up efforts in the north, Spanish Harbour and Jackfish Bay have started their environmental recovery and Peninsula Harbour is steps closer to being restored. PCBs have also been successfully removed from Beaverdams Creek.
- Levels of PFOS, a toxic chemical used in fire-fighting foam and in many stain- and/ or stick-resistant consumer products, have declined in Etobicoke Creek.
- There has been a reduction in the damaging effects of acid rain leading to the recovery of many lakes in central and Northern Ontario. There have been dramatic improvements in water quality in the Sudbury region with decreases in metal levels and acidity in lakes.
In addition to these successes, there are some challenges:
- Locally elevated phosphorus levels are a continuing concern, resulting in excessive algae growth in some of the Great Lakes and inland lakes. In the Great Lakes, excessive algae growth is related to a number of factors including the colonization of invasive mussels. Invasive mussels are redistributing nutrients into the nearshore areas of the lower Great Lakes. This provides clearer waters and the invasive mussels provide a hospitable surface for algae to attach to, promoting an increase in algal growth.
- There is a need for further reductions in phosphorus loads to Lake Simcoe to reach the target for dissolved oxygen that is necessary to support coldwater fish. The Lake Simcoe Phosphorus Reduction Strategy outlines Ontario’s key actions to reduce phosphorus loads.
- A review of data on two southwestern Ontario streams in agricultural areas suggest that there has been no drop in the amount of nutrients entering streams compared to 40 years ago while preliminary evidence suggests that in some streams, nutrients may be increasing. Too many nutrients in the water impair water quality and aquatic life. Ontario is working with its partners to ensure that agricultural and residential owners carry out best management practices to reduce phosphorus loads from non-point sources (e.g. fertilizers, livestock and pet waste, failing septic systems).
- Between 1994 and 2009, the number of algal blooms reported to the ministry has increased in many regions of Ontario. Ministry staff work closely with local public health teams when responding to blooms.
- In Lake Erie, harmful algae blooms have reappeared in both the western and central basins, comparable to the extent of blooms in the 1960s and 1970s. The blooms may produce toxins that can harm animals and humans.
- Sport fish consumption advisories are still in place in many lakes and streams due to contamination by persistent chemicals.
- Although levels of some contaminants such as PCBs and dioxins have decreased in Great Lakes fish, some newer commercial chemicals have been found to persist and accumulate in certain fish to levels of concern. These include polybrominated diphenyl ether (PBDE) flame retardants and PFOS. Starting May 29, 2013 the manufacture, use, sale, offer for sale or import of PFOS will be prohibited in Canada.
- Although PFOS levels have been declining in Etobicoke Creek, Lake Ontario shows conflicting trends. PFOS levels in Lake Ontario Lake Trout have levelled while sediment concentrations show continuing increases.
- Ontario’s water resources are already experiencing the effects of climate change. Warmer air temperatures have resulted in a shorter icecover season in some inland lakes. Given the complexity of aquatic ecosystems, these changes in ice conditions will affect lakes in different ways. Warmer air temperatures also relate to changes in algal composition and diversity in lakes in Ontario’s Far North. These changes may have cascading effects on higher levels of the food chain. Ontario has set targets for reducing Ontario’s greenhouse gas emissions to combat the effects of climate change.
- Pathogens and other microbial contamination are a concern for recreational water quality in Ontario. Beach postings due to elevated E. coli levels continue to be issued for recreational waters along the Great Lakes, Lake Simcoe and many river systems (e.g. Grand River watershed). The ministry continues to conduct and collaborate on monitoring studies to understand the occurrence of microbial contamination in a variety of water sources in Ontario.
- Calcium levels are declining in inland lakes in Ontario due to acid rain and timber harvesting and regrowth, resulting in a decrease in the abundance of calcium-rich zooplankton — an important member of a lake’s ecosystem. The ministry has increased its monitoring of calcium levels through the Lake Partner Program to better understand the impacts of changing calcium levels.
Next Steps
There have been improvements but all of us still need to do more to protect Ontario’s water quality from new and ongoing problems. Government, industry, other stakeholders and individual Ontarians all have critical roles to play in:
- Continuing our efforts to reduce phosphorus levels to discourage excessive algae growth and decrease harmful blue-green algal blooms
- Taking ongoing actions to reduce toxic emissions and clean up contaminated areas in lakes and streams
- Continuing our efforts to clean up the Great Lakes
- Taking actions to reduce the effects of climate change and prevent the spread of invasive species
8.0 References
1. Hecky RE, Smith REH, Barton DR, Guildford SJ, Taylor WD, Charlton MN and Howell T (2004) The nearshore phosphorus shunt: a consequence of ecosystem engineering by dreissenids in the Laurentian Great Lakes. Can. J. Fish. Aquat. Sci. 61:1285–1293.
2. Winter JG, Howell ET and Nakamoto LK (2012) Trends in nutrients, phytoplankton, and chloride in nearshore waters of Lake Ontario: Synchrony and relationships with physical conditions. J. Great Lakes Res. 38:124-132.
3. Dove A (2009) Long-term trends in major ions and nutrients in Lake Ontario. Aquat. Ecosyst. Health Manag. 12:281–295.
4. Brittain SM, Want J, Babcock-Jackson L, Carmichael WW, Rinehart KL and Culver DA (2000) Isolation and characterization of microsystins cyclic heptapetide hepatoxins from Lake Erie strains of Microcystis aeruginosa. J. Great Lakes Res. 26:241-249.
5. Vincent RK, Qin X, Mckay ML, Miner J, Czajkowski K, Savino J and Bridgeman T. (2003) Phycocyanin detection from LANDSAT TM data for mapping cyanobacterial blooms in Lake Erie. Remote Sens. Env. 89:381-392.
6. Rinta-Kanto JM, Ouellette AJA, Twiss MR, Boyer GL, Bridgeman T and Wilhelm SW (2005) Quantification of toxic Microcystis spp., during the 2003 and 2004 blooms in Western Lake Erie using quantitative real-time PCR. Environ. Sci. Technol. 39:4198-4205.
7. Borwick J, Philpot A and Wilson K (2009) Review of Lake Simcoe’s Coldwater Fish Stocking Program. Ontario Ministry of Natural Resources. Midhurst/Aurora districts, pp. 23.
8. LSRCA and OMOE (2013) Report on the phosphorus loads to Lake Simcoe 2007–2009. Lake Simcoe Region Conservation Authority and OMOE Joint Report.
9. Young JD, Winter JG and Molot L (2011) A reevaluation of the empirical relationships connecting dissolved oxygen and phosphorus loading after dreissenid mussel invasion in Lake Simcoe. J. Great Lakes Res. 37:7-14.
10. Winter JG, Young JD, Landre A, Stainsby E and Jarjanazi H (2011) Changes in phytoplankton community composition of Lake Simcoe from 1980 to 2007 and relationships with multiple stressors. J. Great Lakes Res. 37:63-71.
11. Dolson R (2012) Status of lake trout (Salvelinus namaycush) in Lake Simcoe, Ontario. Ontario Ministry of Natural Resources. Science and Information Branch, Southern Science and Information, SIB ASU Report 2012–1, pp.35.
12. Hargan KE, Paterson AM, and Dillon PJ (2011) A total phosphorus budget for the Lake of the Woods and the Rainy River catchment. J. Great Lakes Res. 37:753-763.
13. OMOE (2012) Water quality of 15 streams in agricultural watersheds of Southwestern Ontario 2004-2009: Seasonal patterns, regional comparisons, and the influence of land use. PIBS: 8613e
14. Winter JG, DeSellas AM, Fletcher R, Heintsch L, Morley A, Nakamoto L and Utsumi K (2011) Algal blooms in Ontario, Canada: Increases in reports since 1994. Lake and Reservoir Management 27:107-114.
15. Gewurtz SB, Bhavsar SP, Jackson DA, Awad E, Winter JG, Kolic TM, Reiner EJ, Moody R and Fletcher R (2010) Trends of legacy and emergingissue contaminants in Lake Simcoe fishes. J. Great Lakes Res. 37:148-159.
16. Pacyna EG, Pacyna JM, Steenhuisen F and Wilson SJ (2006) Global anthropogenic mercury emission inventory for 2000. Atmospheric Environment 40:4048-4063.
17. Bhavsar SP, Gewurtz SB, Mcgoldrick DJ, Keir MJ and Backus SM (2010) Changes in mercury levels in Great Lakes fish between 1970s and 2007 Environ. Sci. Technol. 44:3273-3279.
18. Li H, Helm PA, and Metcalfe CD (2010) Sampling in the Great Lakes for pharmaceuticals, personal care products, and endocrine disrupting substances using the passive polar organic chemical integrative sampler (POCIS). Environ. Toxicol. Chem. 29:751-762.
19. Helm PA, Howell ET, Li H, Metcalfe TL, Chomicki KM and Metcalfe CD (2012) Influence of nearshore dynamics on the distribution of organic wastewaterassociated chemicals in Lake Ontario determined using passive samplers. J. Great Lakes Res.
20. Awad E, Zhang X, Bhavsar SP, Petro S, Crozier PW, Reiner EJ, Fletcher R, Tittlemier SA and Braekevelt E (2011) Long-term environmental fate of perfluorinated compounds after accidental release at Toronto airport. Environ. Sci. Technol. 45:8081-8089.
21. Furdui VI, Helm PA, Crozier PW, Lucaciu C, Reiner EJ, Marvin CH, Whittle DM, Mabury SA and Tomy GT (2008) Temporal trends of perfluoroalkyl compounds with isomer analysis in lake trout from Lake Ontario (1979 to 2004). Environ. Sci. Technol. 42:4739–4744.
22. Myers AL, Crozier PW, Helm PA, Brimacombe C, Furdui VI, Reiner EJ, Burniston D and Marvin CH (2012) Fate distribution, and contrasting temporal trends of perfluoroalkyl substances (PFASs) in Lake Ontario, Canada. Environ. Internat. 44:92-99.
23. Jackfish Bay RAP Team (1991) Stage 1: Environmental Conditions and Problem Definition: Jackfish Bay RAP. North Shore of Lake Superior Remedial Action Plans.
24. Jackfish Bay RAP Team (1998) Stage 2: Remedial Strategies for Ecosystem Restoration. North Shore of Lake Superior Remedial Action Plans.
25. Environment Canada and the OMOE (2007) Canada-Ontario Agreement Respecting the Great Lakes Basin Ecosystem.
26. Environment Canada and OMOE (2011) Jackfish Bay Area in Recovery - 2011 Update Fact Sheet. Last accessed: September 2012.
27. Rusak JA, Yan ND and Somers KM (2008) Regional climatic drivers of synchronous zooplankton dynamics in north-temperate lakes. Can J. Fisheries and Aquatic Sciences. 65:878-889.
28. Rühland K, Paterson AM and Smol JP (2008) Hemispheric-scale patterns of climate-related shifts in planktonic diatoms from North American and European lakes. Global Change Biol. 14:2740-2754.
29. Keller W (2007) Implications of climate warming for Boreal Shield lakes: a review and synthesis. Environmental Reviews 15:99-112.
30. Gunn J and Snucins E (2010) Brook charr mortalities during extreme temperature events in Sutton River, Hudson Bay Lowlands, Canada. Hydrobiologia. 650:79-84.
31. Tarnocai C (2006) The effect of climate change on carbon in Canadian peatlands. Global Planet Change. 53:222-232.
32. Peacock E, Derocher AE, Lunn NJ, and Obbard ME (2010) Polar bear ecology and management in Hudson Bay in the face of climate change. In: A Little Less Arctic: Top Predators in the World’s Largest Northern Inland Sea, Hudson Bay. Ferguson SH, Loseto LL and Mallory ML (Eds.) Springer Science and Business Media: 93-115.
33. Gagnon AS and Gough WA (2005) Trends in the dates of ice freeze-up and breakup over Hudson Bay, Canada. Arctic. 58:370-382.
34. Hochheim KP and Barber DG (2010) Atmospheric forcing of sea ice in Hudson Bay during the fall period, 1980-2005. J Geophys Res. 115: C05009, doi: 10.1029/2009JC005334
35. DeSellas AM, Paterson AM, Clark BJ, Baratono NG and Sellers TJ (2009) State of the Basin Report for the Lake of the Woods and Rainy River Basin, pp. 32 and 101.
36. Cohen AN and Weinstein A (2001) Zebra mussel’s calcium threshold and implications for its potential distribution in North America. San Francisco Estuary Institute, Richmond, California.
37. OMNR and Ontario Federation of Anglers and Hunters (2012) Rainbow Smelt Fact Sheet. Last accessed: July 2012.
38. OMNR and Ontario Federation of Anglers and Hunters (2012) Spiny and Fishook Water Flea Fact Sheet. Last accessed: July 2012.
39. Suchy KD and Hann BJ (2007) Using microfossil remains in lake sediments to examine the invasion of Eubosmina coregoni (Cladocera, Bosminidae) in Lake of the Woods, Ontario, Canada. J. Great Lakes Res. 33:867-874.
40. Jansen W, Geard N, Mosindy T, Olson G and Turner M(2009) Relative abundance and habitat association of three crayfish (Orconectes virilis, O. rusticus, and O. immunis) near an invasion front of O. rusticus, and long-term changes in their distribution in Lake of the Woods, Canada. Aquatic Invasions. 4:627-649.
41. OMNR and Ontario Federation of Anglers and Hunters (2012) Rusty Crayfish Fact Sheet. Last accessed: July 2012.
42. Chucholl C (2008) Aggressive interactions and competition for shelter between a recently introduced and an established invasive crayfish: Orconectes immunis vs. O. limosus. Fund. Appl. Limnol. 172:27-36.
43. Windels S, Marburger J and Mason D (2007) Ecology and management of Typha (Cattail) invasions in the Great Lakes Region. Presentation at the 4th Annual International Lake of the Woods Water Quality Forum, International Falls, Minnesota, USA. Lake of the Woods Water Sustainability Foundation. Last accessed July 2012.
44. Saltonstall K (2002) Cryptic invasion by a nonnative genotype of the common reed, Phragmites australis, into North America. PNAS 99:2445-2449.
45. Blossey B, Skinner LC and Taylor J (2001) Impact and management of purple loosestrife (Lythrum salicaria) in North America. Biodiversity Conserv. 10:1787-1807.
46. Kon T, Weir SC, Howell ET, Lee H and Trevors JT (2009) Repetitive element (REP)-polymerase chain reaction (PCR) analysis of Escherichia coli isolates from recreational waters of southeastern Lake Huron. Can J. Microbiol. 55(3):269-276.
47. Whitman RL, Shively DA, Pawlik H, Nevers MB and Byappanahalli MN (2003) Occurrence of Escherichia coli and enterococci in Cladophora (Chlorophyta) in nearshore water and beach sand of Lake Michigan. Appl. Environ. Microbiol. 69(8):4714-4719.
48. Howell ET, Chomicki KM and Kaltenecker G (2012) Patterns in water quality on Canadian shores of Lake Ontario: Correspondence with proximity to land and level of urbanization. J. Great Lakes Res. 38(4):32-46
49. Pintar KDM, Fazil A, Pollari F, Charron DF, Waltner-Toews D and McEwen SA (2010) A risk assessment model to evaluate the role of fecal contamination in recreational water on the incidence of cryptosporidiosis at the community level in Ontario. Risk Analysis. 30(1):49-64.
50. Government of Canada (2012) Canadian National Enteric Pathogen Surveillance System(CEnterNet) Short Report - 2011. Guelph, ON. Public Health Agency of Canada.
51. Young J, Landre A, Winter J, Jarjanazi H and Kingston J (2010) Lake Simcoe Water Quality Update. Ontario Ministry of the Environment Report.
52. Khan IUH, Hill S, Nowak E, Palmer ME, Jarjanazi H, Lee DY, Mueller M, Schop R, Weir S, Abbey AMI, Winter J and Edge TA (2013) Investigation of the prevalence of thermophilic Campylobacter species at Lake Simcoe recreational beaches. Inland Waters, 3:93-104.
53. Lee DY, Weir SC, Lee H and Trevors JT (2012) Final report for Lake Simcoe water quality study.
54. Watmough SA, Aherne J and Dillon PJ (2003) Potential impact of forest harvesting on lake chemistry in south-central Ontario at current levels of acid deposition. Can. J. Fish. Aquat. Sci. 60:1095-1103.
55. Morris DM (1997) The role of long-term site productivity in maintaining healthy ecosystems: a prerequisite of ecosystem management. For Chron. 73:731-740.
56. Morris DM (2003) Elemental storage and cycling in boreal mixedwoods. Ont. Min. Nat. Resour., Boreal Mixedwood Technical Note 29.
57. Jeziorski A, Yan ND, Paterson AM, DeSellas AM, Turner MA, Jeffries DS, Keller B, Weeber RC, McNicol DK, Palmer ME, McIver K, Arseneau K, Ginn BK, Cumming BF and Smol JP (2008) The widespread threat of calcium decline in fresh waters. Science. 322:1374-1377.
9.0 Words and Terms
- Acidification
- A process that increases the acidity (lowers the pH level) of a water body.
- Acid rain
- Rain that has become more acidic than normal by mixing with pollutants in the atmosphere. The term is often used to describe the various acidic substances (wet and dry) that are deposited from the atmosphere. A more precise term is acid deposition, which includes wet deposition (rain, snow, fog) and dry deposition (dust particles and gases).
- Acid deposition
- See Acid rain.
- Algae
- A group of aquatic organisms that have all or most of the following features: they photosynthesize, they have simple vegetative structures without a vascular system and reproductive bodies that lack a sterile layer of protecting cells.
- Algal Toxins
- Also known as cyanobacterial toxins or cyanotoxins, they are metabolites that certain species of cyanobacteria can produce. These toxins can impair water quality and affect the health of humans and animals. Well-known types of cyanotoxins are microcystin-LR and microcystin-LA, which can cause liver damage.
- Ambient
- Natural or background conditions in the environment that are away from areas where a specific discharge or source of pollution influences water quality.
- Aquifer
- A layer of soil, sand, gravel or rock that contains groundwater.
- Area of Concern
- An area within the Great Lakes basin where water quality problems have been identified.
- Background
- Water quality conditions upstream of a source of pollution.
- Beneficial use
- The role that the government decides a water body will fulfill (e.g. fish consumption, safe drinking water source, etc.). Restoring beneficial uses is the primary goal of Remedial Action Plans for Areas of Concern in the Great Lakes. See Remedial Action Plan and Area of Concern.
- Beneficial use impairment
- A negative change in the quality (health) of a water body making it unusable for a beneficial use that has been assigned to it. See Beneficial use.
- Benthic invertebrates
- Insects, worms, crustaceans and other organisms without a backbone that live in, on or near the bottom of water bodies.
- Benthos
- Synonymous with benthic invertebrates.
- Bioaccumulative
- A substance with the potential to build up (accumulate) in an organism to concentrations higher than the surrounding environment.
- Biomonitor
- An organism that is sensitive to, and shows measurable responses to changes in the environment, such as changes in pollution levels. See Sensitive species.
- Chemical of emerging concern
- See Emerging chemical/Emerging contaminant.
- Community (aquatic)
- All of the species that interact in a body of water.
- Concentration
- Amount of a substance in a given volume of sample. In water, concentration is usually expressed as milligrams per litre (parts per million), micrograms per litre (parts per billion) and nanograms per litre (parts per trillion).
- Contaminant
- A substance that impairs water quality when released to the environment.
- Contamination
- Degradation of water quality compared to natural or original conditions caused by the release of contaminants.
- Cyanobacteria
- A type of photosynthetic bacteria commonly found in freshwater bodies. When conditions are favourable, growth accelerates and cyanobacteria can accumulate within the surface water body as a “bloom” or as a blue-green “scum” on the water’s surface. Also known as “blue-green” algae.
- Dichloro-diphenyl-trichloroethane (DDT)
- A now-banned pesticide that was used to control insect and bat populations.
- Dioxins (polychlorinated dibenzodioxins) and furans (polychlorinated dibenzofurans)
- A group of chemical compounds created as unwanted by-products in the manufacturing of other chemicals.
- Dissolved oxygen
- Oxygen dissolved in water. Maintaining a certain concentration is essential for aquatic life.
- Discharge
- A volume of water that flows past a given location in a given time interval. In streams, discharge is usually expressed in cubic metres per second.
- Ecosystem
- A community of organisms and the environment in which they live.
- Embayment
- An indentation of a shoreline that forms a bay.
- Emerging chemical/Emerging contaminant
- A substance of increasing interest to scientists and the public.
- Emission
- The release of a substance into the environment.
- Eutrophication
- A process where water bodies receive excess nutrients that stimulate excessive plant growth.
- Food web
- The interconnected feeding relationships in an ecosystem.
- Groundwater
- Water that occurs beneath the surface of the Earth in saturated soils and geologic formations.
- Indicator species
- An organism whose presence, absence or relative well-being in an area is a sign of the health of its ecosystem.
- Inland
- Away from large bodies of water (e.g. the Great Lakes) and surrounded by land.
- Intake
- The location where water is withdrawn from a lake or stream for domestic purposes.
- Load
- The amount of a substance entering a water body over a given time interval.
- Mean
- Average (the sum of the values divided by the number of values).
- Multiple stressors
- Two or more stressors that have interactive and cumulative impacts on aquatic ecosystems (e.g. acid rain and climate change).
- Nearshore
- Locations that include the shore to water 30 metres in depth.
- Nutrient
- substance necessary for the growth and survival of an organism. However, when there is too much or too little nutrient in the water, it can have a negative effect on water quality and aquatic life.
- Ontario Drinking Water Quality Standard
- Maximum acceptable concentrations of a given water quality parameter, as prescribed in O.Reg. 169/03.
- Outflow
- The waterway where water flows out of a lake.
- Parameter
- A measurable characteristic or feature of water quality.
- Pathogen
- A bacteria, virus or other microorganism that can cause disease.
- Perfluorooctane sulfonate (PFOS)
- A humanmade chemical found in many consumer stain- and/or stick-resistant products.
- Persistent
- Substances that are not easily broken down and stay in the environment for a long period.
- Phytoplankton
- Small, usually microscopic, suspended aquatic plants. See also Zooplankton.
- Planktonic
- See Phytoplankton and Zooplankton.
- Polder
- tract of low land enclosed by embankments (barriers) known as dikes that has been reclaimed from a body of water, such as a lake or river.
- Pollutant
- Any substance that, when released to the environment, degrades the environment to such an extent that living organisms can be harmed or human uses of natural resources are impaired.
- Polychlorinated biphenyls (PCBs)
- Human-made chemicals used as coolants and lubricants.
- Provincial Water Quality Objectives
- Numerical and narrative criteria that are protective of all forms of aquatic life.
- Remedial Action Plan
- A strategy developed to restore and protect an Area of Concern in the Great Lakes.
- Remediate/Remediation
- Taking action to reduce, isolate or remove contamination from the environment.
- Runoff
- Water from melting snow and rain that moves from the landscape into receiving water bodies.
- Sediment
- Particles derived from rocks, soils and organic materials that are suspended in or deposited at the bottom of a water body.
- Sediment core
- A long, cylindrical sample of sediment from the bottom of a water body that is collected using a hollow tube.
- Sensitive species
- An organism that is particularly vulnerable to harm if there is degraded water quality or change in the environment. See Biomonitor.
- Source
- A place or object from which pollutants are released (pollution source). Also used to describe surface water bodies and groundwater aquifers that have the potential to supply a drinking water system (drinking water source).
- Stressor
- An event or factor that adversely affects the well-being of an organism.
- Surface water
- Water on the Earth’s surface including lakes, streams and wetlands.
- Toxin
- A poisonous substance produced by living cells or organisms.
- Toxicity
- The extent to which a substance can have harmful effects on organisms.
- Tributary
- A stream that flows into a larger stream or a lake.
- Watershed
- An area of land from which water drains to a given point. Synonymous with drainage area, basin and catchment.
- Weathering
- The processes by which rocks are broken down.
- Zooplankton
- Small, usually microscopic, aquatic animals that graze on phytoplankton. See also Phytoplankton.