Water Quality in Ontario 2014 Report
The Water Quality in Ontario 2014 Report highlights findings from water monitoring programs that directly relate to the government’s environmental priorities. These include protecting the Great Lakes, toxics reduction, climate change, and establishing baseline environmental data for the Far North. This report focuses on three main areas of water monitoring:
- the Great Lakes
- inland lakes
- streams and groundwater
It also features results for other issues that affect water quality, such as nutrients, invasive species and extreme weather events.
Executive summary
Ontario is rich in water resources. Our province borders four of the five Great Lakes, and we have more than a quarter of a million lakes, rivers and streams. These water resources are the cornerstone of the quality of life that we enjoy in Ontario. Our health, the health of the environment, and our economic prosperity depend on them.
The Ministry of the Environment and Climate Change (MOECC or the ministry herein) oversees many long term water monitoring and science programs that provide vital information for identifying threats and learning about the current state of Ontario’s water resources. This science is then used to make informed decisions to better protect and improve the quality of our water.
The 2014 Water Quality in Ontario Report provides findings from some of the ministry’s water monitoring programs, and includes key findings for the Great Lakes, inland lakes, and streams and groundwater:
Great Lakes:
- Thanks to management actions that reduced the amount of phosphorus discharged from sewage treatment plants, concentrations in the Great Lakes nearshore zone declined significantly between the 1970s and 1990s. More recently, however, they have levelled off and in parts of Lake Erie they have increased slightly since the mid-1990s. This has been accompanied by an increase in the frequency and severity of cyanobacteria blooms (also known as Blue-green algae and commonly described as “Harmful Algal Blooms” due to the potential association with algal toxins). For more information on harmful algal blooms, visit Ontario’s webpage on blue-green algae.
- Under the binational Great Lakes Water Quality Agreement (GLWQA) process, scientists on both sides of the Canada-U.S. border concluded that to control nuisance and harmful algal blooms in Lake Erie, the best approach is to reduce the amount of phosphorus entering the lake. Subsequently, Canada and the U.S. have formally adopted binational phosphorus loading reduction targets of 40 percent to improve Lake Erie water quality. Ontario is actively working with Canada through the Canada-Ontario Agreement on Great Lakes Water Quality and Ecosystem Health, 2014 (COA) to establish by 2018 a Lake Erie Domestic Action Plan for meeting the binational targets which apply to Ontario’s portion of Lake Erie. More information on this work will be available in Ontario’s Great Lakes Strategy Progress Report, which will be released in March 2016.
- There are concerns about the prevalence and potential effects of so-called “emerging chemicals” such as flame retardants and pharmaceuticals that tend to be more prevalent in urban areas where their use is the highest. Although these chemicals breakdown more readily in the environment than historical substances of concern such as PCBs and DDT, ongoing low level inputs from urban areas results in increased local exposure by aquatic life. For example, recent research has shown that dechloranes, a class of flame retardants, and their degradation products are present in Great Lakes sediment and fish. The most toxic and bioaccumulative of these compounds, known as the pesticide Mirex, was banned in the 1970s, but other less toxic flame retardants have replaced it. A degradation product of one compound was found to have higher concentrations in Lake Trout and to be 300 times more bioaccumulative than its parent form. These findings highlight the importance of considering how emerging chemicals may change once they enter the environment.
- Provincial actions to reduce mercury emissions have resulted in a long-term decline in the levels of mercury in Great Lakes fish. More recently, however, mercury levels in fish from the Great Lakes are declining at a slower rate, not changing, or increasing slightly in some areas such as Lake Erie. The reason for this short-term change is unclear; however, researchers speculate that changes could be due to increased global emissions to the atmosphere, food web changes related to invasive species, climate change and changes in water chemistry.
- Chloride levels have been increasing in Lake Ontario since the mid-1990s. Increasing urbanization and the associated use of road salt on many roads, parking lots and sidewalks is likely contributing to these increases. Although concentrations in the lake remain far below those associated with adverse effects on aquatic life, chloride levels are highest at sampling locations in intensely urban areas. Not only is urban stormwater runoff driving increases in Lake Ontario, it is potentially causing periodic adverse effects in urban rivers. Climate may also play an important role in rising chloride levels, as chloride concentrations tend to be higher in years with more precipitation and greater total snow depth during the winter.
- The research featured in the Water Quality in Ontario Reports also shows that through working with our partners, we have achieved measurable success in cleaning up contaminated areas in the Great Lakes basin. Some of these recent successes include:
- extensive clean up actions have brought us closer to restoring sediment quality at Peninsula Harbour on Lake Superior.
- ongoing efforts to clean up contaminated sediment in Randle Reef in Lake Ontario’s Hamilton Harbour are helping to prevent the spread of the contaminants throughout the harbour.
- recent actions to clean up contaminants, including PCBs and mercury, in Lake Ontario’s Areas of Concern (AOCs) have resulted in significant reductions in contaminant levels in fish from these hot spots, including the Niagara River, Hamilton Harbour, Toronto & Region, Bay of Quinte and St. Lawrence River, since the 1970s.
- in the Niagara River AOC, targeted actions have been taken to remediate contaminant sources on the US side of the river and ultimately improve water quality in the river. Over time, lower contaminant levels have been found in caged mussels from these remediated sites.
Inland lakes:
- The first five years of standardized, long-term monitoring of the province’s fisheries resources in over 800 inland lakes show that all regions in Ontario have similar levels of total phosphorus (TP) concentrations, with 60% of the lakes having concentrations less than 10 micrograms per litre, the concentration at which a high level of protection against aesthetic deterioration is provided. Only 7% of the lakes in the data set have TP concentrations more than 20 micrograms per litre, the level above which nuisance concentrations of algae are more common.
- In inland lakes in south-central Ontario, climate change has been linked to warming lake water temperatures and changes in lake mixing, which may be causing lake waters to remain stratified for longer periods of the year and increasing the growing season for algae.
- Calcium levels are declining in Ontario’s inland lakes and resulting in a decrease in calcium-rich zooplankton populations in our inland lakes, an important food source for other aquatic life such as fish. Recent research has shown that climate change is partially contributing to this decline, such as in Red Chalk Lake in central Ontario.
Streams and groundwater:
- The ministry, in collaboration with Environment and Climate Change Canada and Conservation Ontario, has completed a 6-year study comparing cosmetic pesticide levels before and after the Cosmetic Pesticides Ban took effect in 2009. Results show that levels of herbicides in study streams decreased significantly after the ban came into effect. Longer-term trends from 2003-2012 indicate that concentrations of three common lawn care pesticides are decreasing, and that they have been since before the ban came into effect.
- Ministry scientists found significant increases in chloride levels at 96% of 24 long-term stream monitoring sites in habitats that support salt-sensitive, freshwater mussel species at risk.
- Climate and land use changes will affect water quantity and quality in complex ways. The ministry has been working with Conservation Ontario, the Ministry of Natural Resources and Forestry, and Environment and Climate Change Canada to study the linkages and relationships between precipitation and the other parts of the hydrologic cycle at an integrated water monitoring site at Parkhill Creek in Ausable Bayfield Conservation Authority. Collecting measurements like soil moisture, groundwater levels and stream flow from a single location will help ministry scientists and their partners build an integrated surface-groundwater model that will simulate the different parts of the hydrologic cycle.
The findings presented in this report show that we are achieving some successes in protecting and restoring parts of the Great Lakes, inland lakes, and other water bodies in Ontario, however there is more work to be done.
Introduction
Ontario borders four of the five Great Lakes. We have more than 250,000 lakes, and 500,000 kilometres of rivers and streams and vast groundwater resources. Our lakes, rivers, streams and groundwater are essential to our health, environment and economic prosperity. They supply our drinking water, and are home to many plant and animal communities. They also play a vital role in industry, agriculture, recreation and food processing.
The Ministry of the Environment and Climate Change’s water monitoring programs provide information about water quality conditions and trends across the province that is published in scientific journals, technical reports and the Water Quality in Ontario Reports. Many of the ministry’s monitoring datasets are also available through the OPS Open Data Catalogue.
Ontario has hundreds of thousands of lakes and millions of streams, making it difficult for any one organization to monitor everything. As such, our monitoring programs are a result of the collaborative work with our many partners. These relationships help us maintain and increase our scientific and technical expertise, expand the scope of our programs, interpret and report findings in a timely manner and keep abreast of new research.
This fourth Water Quality in Ontario Report highlights findings from some of the ministry’s water monitoring programs that directly relate to the government’s key environmental priorities. These include protecting the Great Lakes, toxics reduction, climate change and extending monitoring efforts into the Far North. This report features water quality results for Ontario’s Great Lakes, inland lakes, streams, groundwater and the Far North, with a focus on factors that affect water quality such as nutrients and algae, contaminants and climate change.
Water quality in Ontario
Ontario’s climate, geography and geology have shaped its regional settlement and land-use patterns as well as water quality. In southern Ontario, the sedimentary rocks and overlying glacial deposits have created thick, nutrient-rich soils in a favourable climate that is ideal for agricultural development. Three of the five Great Lakes (Huron, Erie and Ontario) surround southern Ontario. As a result, there is dense population and industrial, agricultural and urban development. This has led to a range of human-induced water quality problems, including discharge of biological nutrients (like phosphorus and nitrogen) and the release of toxic substances into Ontario’s waterbodies.
In contrast, the cooler Canadian Shield region of northern Ontario typically has thin soils and is largely undeveloped. The rocks of the Canadian Shield contain large mineral deposits that are important to Ontario’s economy. A few urban areas have developed around the mining and forestry industries, and there are seasonal residences on the shores of some of the lakes in this region. Despite the Shield’s lower population density, water quality issues also affect waterbodies within the Shield. In particular, the soft water of the region’s lakes is especially vulnerable to the effects of acid deposition and excess nutrients.
The Hudson Bay Lowlands are north of the Shield. They cover part of Ontario’s Far North region. This northernmost area of Ontario reaches to the shores of Hudson and James Bay. The region is characterized by flat topography, wetlands and small, sparsely populated settlements along the Hudson Bay shores, including First Nations communities such as Moose Cree First Nation, Attawapiskat First Nation, Fort Albany First Nation, and Kashechewan First Nation. The aquatic ecosystems that make up the Shield and the rest of the Far North region are vulnerable to various threats. These include resource extraction (e.g., mining and forestry) and climate change.
Water quality across the province is also susceptible to climate change. The last few decades have demonstrated a connection between increased water temperature in Ontario lakes and increased air temperatures caused by climate change. Average air temperatures in Ontario could rise by as much as 8°C over the next century. A warmer climate could result in milder winters and longer growing seasons. There could also be more frequent severe weather events, such as storms, floods, droughts and heat waves.
Rising air temperatures and other climate changes are already affecting Ontario’s surface and groundwater. Changes in water temperature, seasonal lake process (e.g., lake mixing), water quality and the water balance will significantly alter aquatic communities leading to cascading effects throughout food chains and ecosystems.
Ontario’s aquatic ecosystems will be faced with multiple stressors in the years to come, including the effects of a warmer climate, which is often thought of as a “multiplier” of existing threats. In the past, most of the problems facing fresh waters, and the science that informed the solutions, have been local in nature. This situation is now changing, and the framework in which we need to consider the cumulative effects of multiple stressors requires an integrated approach, with involvement from scientists, stakeholders and policy makers alike. The solutions need to be proactive and include a recognition and assessment of past, present, and future threats in order to develop watershed–based management and mitigation actions. Our ministry will continue to provide the best available monitoring and science that will be critical to informing and guiding these efforts.
The Ontario Government’s role in protecting water quality
Ontario has some of North America’s most rigorous programs and legislation to protect water quality. Our water protection actions are founded on science and are often ecosystem- or watershed-based. We work with a range of partners to protect and restore water quality using best practices and best science.
Much of the scientific information that forms the basis for Ontario’s water quality protection legislation and regulations is directly due to the ministry’s monitoring and reporting programs. Some examples of Ontario’s legislation include:
Ontario’s Climate Change Strategy outlines the province’s plan to reduce greenhouse gas emissions to 80% below 1990 levels by 2050, and build a prosperous low-carbon economy.
The Ontario Water Resources Act is designed to conserve, protect and manage Ontario’s groundwater and surface water.
The Environmental Protection Act was designed to provide for the protection and conservation of the natural environment.
Ontario’s Great Lakes Protection Act, 2015 strengthens the province’s ability to protect and restore the Great Lakes and St. Lawrence River, and the waterways that flow into them. It enables the province to address significant environmental challenges to the Great Lakes.
Ontario’s Great Lakes Strategy is the province’s road map to protect the Great Lakes. It sets out Ontario’s Great Lakes goals and the priority Great Lakes actions for Ontario ministries. First released in 2012, it will be reviewed in 2018 and every six years thereafter.
The Canada Ontario Agreement on Great Lakes Water Quality and Ecosystem Health helps the province carry out the Great Lakes Strategy. It also helps Canada meet commitments under the Canada-U.S. Great Lakes Water Quality Agreement.
The Lake Simcoe Protection Act and the Lake Simcoe Protection Plan, the first plan of its kind in Ontario, focus on improving Lake Simcoe’s water quality, protecting the wider watershed’s natural heritage and resources, and managing the effects of climate change and invasive species. The Lake Simcoe Phosphorus Reduction Strategy aims to reduce phosphorus levels by almost 40%.
The Nutrient Management Act aims to protect Ontario’s water quality from unacceptable impacts from the excess use of nutrients.
The Far North Act is the foundation for land use planning that protects the unique ecology and vast boreal environment of Ontario’s far north forests and peat lands.
The Water Opportunities Act sets a path to help Ontarians use water more efficiently and further develop and market clean water technology and services to Canada and the world.
Helping regulated facilities use fewer toxic substances and move to safer alternatives with the Toxics Reduction Act is part of the province’s toxics reduction program and reduces the amount of toxic substances entering our waterways. The Cosmetic Pesticides Ban prohibits the sale and use of certain pesticides for cosmetic purposes on lawns, gardens, parks and schoolyards.
The Clean Water Act ensures communities protect the quality and quantity of their drinking water sources through prevention — by establishing 22 locally developed, science-based Source Water Protection plans. These plans set out actions to reduce the risk of contamination or depletion of drinking water sources near municipal wells or intakes.
Learn more about source protection and read the Ministry of the Environment and Climate Change: Minister’s Annual Report on Drinking Water 2015 for information on the actions to protect Ontario’s drinking water and its sources while addressing the impacts of climate change.
Incorporating traditional ecological knowledge into water initiatives
Water policy initiatives such as Ontario’s Great Lakes Strategy, the Canada-Ontario Agreement on Great Lakes Water Quality and Ecosystem Health, and the new Great Lakes Protection Act acknowledge and recognize the important role of Traditional Ecological Knowledge (TEK) in achieving environmental sustainability in Ontario. In light of this recognition, the ministry, in cooperation with the Chiefs of Ontario (COO), coordinated a TEK Workshop in 2014.
The workshop was hosted by the Six Nations of the Grand River and brought together representatives from First Nations community groups and the ministry, including well established environmental and TEK professionals.
The purpose of the two-day workshop was to open a conversation, explore our understanding of what TEK is and to develop a forward-looking road map on how First Nations communities and governments can collaboratively strengthen opportunities to appropriately consider TEK in current and future Great Lakes and related environmental initiatives.
The ministry is committed to maintaining an ongoing dialogue with Indigenous peoples and supporting collaborative efforts to meaningfully and respectfully incorporate First Nations and Métis TEK in Great Lakes and water initiatives.
The importance of water quality monitoring
Through monitoring and science, the ministry obtains the information it needs to effectively protect and manage the environment. The ministry achieves this by operating a series of carefully designed programs as part of an overall strategy for environmental monitoring and management that:
- identifies the causes of problems and emerging environmental issues;
- develops and tests options to address these issues;
- sets environmental standards;
- establishes and implements policies and programs; and
- reports on the state of the environment.
Environmental monitoring is also done to measure the impact of human activities, provide input into proposed programs and actions and track the effects of remediation.
The ministry’s Environmental Monitoring and Reporting Branch leads the province-wide programs that monitor water quality in the Great Lakes, Lake Simcoe, inland lakes, rivers, streams and groundwater.
Given the abundance of fresh water in Ontario, the ministry cannot monitor every water resource in the province. Instead, the ministry has carefully designed a network of water monitoring programs that includes a combination of intensive water monitoring at a few, select locations on a smaller geographic scale and extensive water monitoring that takes places at many locations over a larger geographic area. This complementary approach provides the ministry with the information it needs to protect and restore water quality in Ontario.
For example, the ministry’s Inland Lake monitoring program conducts intensive weekly to monthly monitoring on eight small lakes in south-central Ontario and extensive monitoring across hundreds of lakes on a less frequent basis. This combination of intensive and extensive monitoring helps characterize and protect aquatic ecosystem health by identifying trends and emerging issues at a smaller scale and then determining whether similar patterns exist across the landscape. In turn, we can better understand the types of lakes, watersheds or regions that are most sensitive to environmental stressors of interest.
The combination ultimately allows us to develop lake management models and plans that can be used to protect and restore our aquatic resources. This approach also helps the ministry identify cause and effect relationships from the many stressors impacting Ontario’s lakes and rivers. By identifying these issues, the ministry can then generate knowledge needed to address them.
The effects of multiple stressors, instead of predominantly single ones, present new challenges in our efforts to ensure the continued health of our aquatic ecosystems. Through the ministry’s diverse network of monitoring programs, we have acquired a growing database of water quality information on a suite of environmental indicators, allowing scientists to study the cumulative effects of multiple stressors on Ontario’s water quality. Two such studies from our Inland Lakes and Great Lakes monitoring programs are included in this report for the first time.
| Type of Monitoring | Description of Monitoring |
|---|---|
| Great Lakes | An extensive program to monitor the nearshore area for algal productivity, nutrient cycling, contaminant levels in sediment and fish, and the health of benthos (riverbed or lakebed dwelling invertebrates) communities. |
| Inland Lakes | Partnership-based programs to monitor the quality of predominately softwater lakes within the Precambrian Shield, recovery of acid-rain impacted lakes in the near-north, fish contaminant levels in lakes featuring recreational fisheries, algal productivity and the structure of benthos communities. |
| Lake Simcoe | A comprehensive program with a focus on sources and levels of nutrients, algal productivity and the link to dissolved oxygen levels critical to the objectives of maintaining coldwater fish habitat. Collaborate on many research projects to investigate other stressors affecting the lake such as pathogens, climate change, invasive species and contaminant loads. |
| Rivers and Streams | Partnership-based programs to assess the impacts of urbanization and agriculture on stream water quality, the structure of benthos communities and contaminant accumulation, including emerging substances like pharmaceuticals released by sewage treatment plants. |
| Groundwater | A partnership program with Ontario’s conservation authorities to assess long-term trends in groundwater quality and quantity, with an emerging focus on the impact of climate change on Ontario’s aquifers. |
| Drinking Water | A research program run in partnership with municipalities and other drinking water plant operators to assess new and emerging trends of substances in support of setting standards to protect Ontario’s drinking water. |
| Far North | A new program to better understand the quality of the lakes, rivers and streams of the Far North. |
The Water Quality in Ontario 2010 Report has information on the ministry’s water monitoring programs. The ministry has been monitoring water quality in parts of the province for up to 50 years, helping build an extensive record of water quality information. For example, since the 1960s, we have been monitoring the quality of Great Lakes nearshore year-round from water that is taken from the Great Lakes for domestic uses at 17 municipal water treatment plants. The monitoring data collected are being used to measure changes in water quality in response to management actions such as phosphorus controls, as well as environmental stressors in the Great Lakes basin such as climate change. The ministry has also started new monitoring programs to collect baseline environmental data in places in Ontario where such information does not exist, such as Ontario’s Far North. Below we describe our recent efforts in the Far North to establish an integrated environmental monitoring network in the Ring of Fire area.
Baseline environmental data in the far north
Ontario’s Far North is unique, with huge volumes of freshwater draining to the marine environments of Hudson Bay and James Bay. The aquatic ecosystems in the Far North are potentially vulnerable to various stressors, including resource extraction, mining and forestry, hydro dam development, access road construction and climate change.
To understand how these systems might change in the future and how to protect them, it is important to understand what they are like now and how they have already changed. The ministry’s ongoing work will inform future programs and action plans once we have determined where and when actions are required and the best course to be taken.
In the summer of 2013, the ministry began establishing an integrated environmental monitoring network in the Ring of Fire area within the James Bay Lowlands, approximately 500km north of Thunder Bay. This work is part of a three-year project to establish baseline environmental conditions in the Ring of Fire region of Ontario’s Far North. This area is currently undeveloped and consists of vast peat lands, lakes, rivers and streams. The area is currently the focus of considerable mining exploration and pre-development activity; however there is very limited baseline environmental data for this part of Ontario due to its remoteness and the logistical challenges of operating in the Far North.
The ministry has been working closely with the Ministry of Natural Resources and Forestry (MNRF) to establish a monitoring network that will provide a better understanding of not only current baseline environmental conditions, but also how the various components that make up the environment are related and inter-dependent.
For example stream flow, water and sediment quality, and benthos have been monitored at the same locations, wherever possible, so that relationships and inter-dependencies between these ecosystem components can be explored. Similarly, groundwater and terrestrial monitoring sites have been co-located.
Because the Ring of Fire area has the potential for significant development, the regional environment monitoring network is also designed to provide information on:
- reference conditions in areas that are expected to remain outside of the influence of development;
- baseline conditions in areas that may change as a result of development activities and;
- cumulative impacts in areas that may change as a result of multiple development activities.
Ministry experts have traveled to the area, setting up monitoring sites and collecting baseline environmental data in the challenging wetland environment of the Hudson Bay Lowlands.
In 2013 and 2014, the ministry established and sampled:
- thirty-nine (39) terrestrial monitoring sites (soil and vegetation) in the two dominant terrestrial ecosystems in the Ring of Fire region (bog and fen peatlands) for species composition and vegetation chemistry. Peat cores have also been collected at select sites;
- ninety-nine (99) nested groundwater monitoring wells at 34 locations within the peat for groundwater levels and temperature. 59 of these wells have also been sampled for water chemistry. Select sites have also been measured for conductivity and barometric pressure; and
- thirty (30) stream water monitoring sites in the Muketei River, Ekwan River and Gleason Creek watersheds for water chemistry. Four (4) regional reference sites have also been established on the Attawapiskat and Ekwan Rivers in collaboration with Environment and Climate Change Canada.
In addition, the ministry with its partners from Laurentian University sampled:
- twenty seven (27) lakes for aquatic plants and animals such as phytoplankton, zooplankton, sediment and water chemistry; and
- one hundred and three (103) stream sites along the Attawapiskat, Muketei and Ekwan Rivers for benthos and water chemistry.
Ministry staff returned in July 2015 to collect additional baseline environmental information.
The partners who are working with the ministry during these field visits include the MNRF, University of Guelph, Laurentian University and the Canadian Museum of Nature. Local First Nations also support the ministry’s field work.
The Fish Contaminant Monitoring Program, which tracks contaminant levels (e.g., metals) in fish sampled from the Great Lakes, inland lakes, rivers and streams in Ontario, has also recently begun gathering fish metals data in the Far North.Little is known about the baseline concentrations of metals in fish in the Far North, as well as how these concentrations naturally vary across the landscape. This program data will help to further understand the natural variability of metals in Far North fish.
The data collected by the ministry will establish reference conditions that can be used to detect changes associated with potential future development of the region, including the cumulative effects of multiple mines. The baseline environmental data will support land-use planning and related policy and management decisions for the Ring of Fire, and the development of a longer term regional monitoring program.
The data collected since 2013 will be presented in a future Water Quality in Ontario Report.
About the water quality data collected and the monitoring methods used by the Ministry
Every year, the ministry and its partners collect thousands of samples of water, sediment and aquatic life. The types of samples that are collected vary based on the objectives of each monitoring program. Monitoring objectives influence all aspects of the design of monitoring programs from the monitoring duration, frequency, timing and location of sample collections to data analysis, interpretation and reporting.
For example, water samples collected from Ontario’s lakes and streams are analyzed for phosphorus and nitrogen levels to assess the impacts of nutrient sources and the potential for excessive plant growth and algal blooms. Also, tissue samples from fish are collected and analyzed for a variety of substances that persist in the environment and have the potential to bioaccumulate through the food web such as metals (e.g., mercury) and organic contaminants (e.g., polychlorinated biphenyls or PCBs). Results are compared to human health guidelines to provide consumption advice for Ontario sport fish, which is available through the ministry’s Guide to Eating Ontario Fish — a publication that the ministry has been producing since 1977.
For information on how we collect and analyze water, sediment and aquatic life samples, please see the Water Quality in Ontario 2008 Report (Chapter 2, pages 4 to 7).
Ministry scientists and technical field staff use a variety of methods to survey a lake over a field season. Conventional monitoring methods include the use of portable sensors to measure physical and chemical properties of water, such as water temperature, turbidity, dissolved oxygen and pH. Staff can also use other approaches. For example, remote sensors are used to collect high resolution environmental data from above and below the water surface and transmit it in near real-time to the ministry for analysis.
The Great Lakes monitoring programs use sensors, such as the Acoustic Doppler Current Profilers (ADCPs), to measure water currents and wave action. ADCPs collect longer-term information throughout the day and over many months. This, along with data that other sensors collect (e.g., on water temperature, turbidity, oxygen and conductivity, chlorophyll a and levels of light for aquatic vegetation), provide an understanding of the features of water quality related to storms and other events that can be difficult to collect with traditional field surveys.
We have also used the Land Ocean Biophysical Observatory (LOBO) in Lake Ontario. LOBO is a monitoring buoy that collects a range of physical and water quality data in real time that the ministry retrieves online.
More recently, our Inland Lake Monitoring program, in partnership with the Harp Lake Association and the Global Lake Ecological Observatory Network, has put a sophisticated monitoring raft known as THELMA (The Harp Environmental Lake Monitoring Ark) into Harp Lake to collect a variety of real-time, high-frequency water quality data from Harp Lake.
These are innovative environmental monitoring methods that enable us to improve our understanding of nutrient loading and algal blooms. This makes it possible to monitor changing environmental conditions in the Great Lakes and inland lakes more closely, and to improve our understanding of and ability to manage emerging environmental issues.
The ministry’s Laboratory Services Branch supports water monitoring activities through its sample analysis activities. Every year, our laboratories analyze thousands of samples and test them for basic water quality parameters (e.g., pH and hardness) and for signs of pollution, such as nutrients, metals (e.g., mercury and lead) and organic compounds (e.g., PCBs and pesticides).
The laboratories’ analytical methods are continually evolving. They are now able to measure contaminants at lower levels. For example, they can detect and monitor emerging contaminants of concern, such as pharmaceuticals and flame retardants that we couldn’t detect before.
Fifty years of stream water monitoring
The year 2014 marked the 50th anniversary of the ministry’s Provincial Water Quality Monitoring Network (PWQMN). This program has been measuring water quality in rivers and streams across Ontario since 1964.
More than 400 locations are currently monitored in partnership with conservation authorities, provincial parks and municipalities. Water samples collected from each location are analyzed in the ministry’s laboratory. The data collected are shared freely between the program partners and with the public. Recent data are available for download on the ministry’s Open Data Catalogue page and can also be explored using the Google Maps application on the Ontario government website.
The PWQMN provides a valuable database for tracking changes in water quality over time, and also helps us understand the impacts of land-use activities on water quality so we can make informed decisions about how to manage and protect our water resources. Special studies in agricultural and urban watersheds have been recently implemented to collect additional information in support of source protection planning and the management of nutrients, pesticides and road salts.
Key findings from this program are available in the following ministry reports:
- Water Quality of 15 Streams in Agricultural Watersheds of Southwestern Ontario 2004- 2009: Seasonal Patterns, Regional Comparisons, and the Influence of Land Use – includes nutrient levels in streams in agricultural watersheds.
- Changes in Urban Stream Water Pesticide Concentrations One Year after a Cosmetic Pesticides Ban – compares pesticide levels in urban streams before and after the Cosmetic Pesticides Ban.
- Water Quality in Ontario Reports from 2008, 2010 and 2012 – include trends in nutrient and chloride levels in streams in urban watersheds.
Water quality monitoring partnerships
Many partners contribute to the success of our monitoring programs: the federal government, other provincial ministries, municipalities, conservation authorities, academic institutions, environmental organizations, industry, First Nations and volunteers.
The next section of this report has an example — one of many — of how the ministry’s partners are helping collect valuable water quality information to inform future decisions and actions.
The appendix of the Water Quality in Ontario 2010 Report has information on some of the ministry’s programs and the partners that help support them.
Working together to improve Ontario’s inland lakes
The Dorset Environmental Science Centre (DESC) is the ministry’s centre of scientific expertise on environmental issues affecting Ontario’s inland lakes.
Through collaborations between government, academia, non-government organizations, conservation authorities and public volunteers, DESC-based studies have collected data from thousands of inland lakes across Ontario for over 40 years. For example, nearly 550 lakes are sampled through Ontario’s Lake Partner Program each year.
The water quality studies in the Far North are another example of a collaborative effort between scientists from the Ontario government (MOECC, MNRF, and the Ministry of Northern Development and Mines and its Ontario Geological Survey branch), as well as a number of universities (Laurentian, Queen’s, Ottawa, Trent, Wilfrid Laurier, Carleton and Toronto). Water quality information is also being collected in collaboration with members of First Nation communities.
In partnering with academia and other organizations, we are able to share our resources, experience and expertise so that scientists can tackle bigger, more complex environmental problems in a cost-efficient way.
For instance, at any given time, the cumulative effects of multiple stressors are interacting in a lake to affect water quality. This complex environment poses challenges to protecting and restoring lakes.
Through partnerships, the ministry studies the effects of multiple stressors on Ontario’s inland lakes such as lakeshore development (nutrient enrichment), atmospheric deposition of toxics (e.g., acid rain), global climate change, mercury contamination and invading species.
With the help of these partners, scientists have uncovered a number of surprises. For example, calcium concentrations in Shield lakes are decreasing. Decades of acid loading, coupled with logging, have depleted watershed stores of calcium, and further decreases are predicted. Laboratory studies at DESC have shown that calcium loss is an important stressor for many aquatic species, especially when less calcium is combined with lower food availability and the warmer temperatures that are predicted in future climate change scenarios.
The increase in scientific capacity and the cutting-edge science that the centre is internationally recognized for are just some of the benefits of working in this collaborative setting. In addition, scientists will be better equipped to detect emerging issues early, before damage is irreversible, and this new knowledge will provide the foundation to develop scientifically sound policies that protect our inland waters.
Real-time partnerships in Muskoka: from local to global
Scientists at DESC created THELMA (The Harp Environmental Lake Monitoring Ark) in the summer of 2010. THELMA is a water quality monitoring buoy that is made possible through the continued support of the local community that has been involved since the outset of this project. THELMA collects high-frequency data on lake chemistry, physics and biology that are broadcast to the web in real-time. The lake community is keenly interested in what these data can tell them about their lake as well as lakes in general. Further, the real-time interactive data is representative of many similar lakes in a region that is regarded for its exceptional water quality and scenic beauty.
THELMA collects data at a much higher frequency than we have been able to in the past: weekly to monthly data is the norm for research and long-term monitoring programs. Data from THELMA is captured once every 10 minutes. As a result, DESC scientists and academic research partners have also been very interested in what these data say about how lakes function. THELMA’s data have been published in several scientific papers examining the role that both weather and climate have on lake physical properties and ice dynamics. Other papers in progress will examine how weather and climate affect lake biology – all at a time scale that we have previously been unable to investigate. Monitoring at high frequencies can help us better understand how lake ecosystems respond to changes at a scale that is critically important to organisms at the base of the food web: the microbes and algae, whose life spans are often measured in hours or days rather than weeks or months.
THELMA was the first Canadian site in the Global Lakes Ecological Observatory Network (GLEON), a world-wide network of buoys monitoring the status of lakes. GLEON enhances collaboration and the sharing of data and knowledge, leading to a better understanding of how aquatic ecosystems respond to multiple stressors and how best to develop appropriate management and mitigation strategies. In a world where multiple stressors can interact to affect water quality and quantity, this is very valuable for Ontario’s inland lakes.
Great Lakes
The ministry and its predecessors have been monitoring Great Lakes water quality since the 1960s. Through its long term monitoring programs, the ministry has amassed a rich database of environmental indicators that the province and many partners use to track and report on the state of the Great Lakes. Below are two examples of state of environment reporting on the Great Lakes that provide us with information on Great Lakes water quality.
The binational state of the Great Lakes report
The State of the Great Lakes reports are coordinated and released by Environment and Climate Change Canada and the U.S. Environmental Protection Agency as a reporting requirement under the Great Lakes Water Quality Agreement to describe basin-wide environmental trends and lake-specific conditions using ecosystem indicators. These reports are part of a series that are published regularly. Ministry scientists work with their federal partners by providing water quality data, authoring indicators and providing scientific input throughout the reporting process; see the Index of Water Quality for Great Lakes Tributaries information below. The report uses many indicators of lake and ecosystem health to determine how the Great Lakes are doing.
What the binational report says about water quality in the Great Lakes
According to the latest 2011 State of the Great Lakes report
Water quality in Lake Superior
The report notes that differences in the status and trend of water quality between Lake Superior and the other Canadian Great Lakes can be explained in part by lake size, nutrient status and regional differences in developmental pressures. Of all the Great Lakes, lake-wide concerns over nutrient and algal issues are lowest in Lake Superior as expected for an oligotrophic (low nutrients), cold-water lake with generally low development density. The 2011 State of the Great Lakes Report notes that phosphorus levels in Lake Superior’s offshore waters are low, but not currently a concern to the existing food web and fisheries. Incidences of nuisance and harmful algal blooms are less common compared to the other Great Lakes, but they do occur along areas of shoreline as a result of localized human activity.
The report also notes that some additional ecosystem indicators reflecting the health of Lake Superior are generally assessed as good. For example, the fisheries are healthy with self-reproducing Lake Trout populations throughout the Lake Superior basin. The lower food web is robust. Zooplankton and phytoplankton biomasses and benthos assemblages are those expected in this oligotrophic, cold water lake. Populations of Diporeia, a native, shrimp-like organism that forms the base of the local food web, are generally doing well despite low populations in other Great Lakes. Priority chemical substances are largely decreasing or remaining stable with many toxic chemical concentrations being the lowest among the Great Lakes.
Despite Lake Superior’s overall good water quality, some contaminants still cause fish consumption restrictions and are above water quality guidelines. For example, mercury is found at higher concentrations in fish in Lake Superior than the other Great Lakes because the lake is more susceptible to atmospheric transport and deposition of mercury. Impacts from mining add additional stress to parts of the lake. There are also other pressures such as chemicals of emerging concerns (e.g., flame retardants) and climate change that affect water quality in all the Great Lakes.
Water quality in the lower Canadian Great Lakes
Water quality in the lower Canadian Great Lakes (Lakes Huron, Erie and Ontario) is considered fair, but the trend is declining (i.e. deteriorating) based on the ecosystem health indicators used in the State of the Great Lakes report. Nutrient and algal issues are a main concern for water quality in Lake Erie, the shallowest of all the Great Lakes. Offshore total phosphorus levels are increasing in Lake Erie and often exceed binational water quality targets. Concentrations in the western basin of Lake Erie, for example, were highest in the 1970s and have declined over time. However, the most recent values from 2010 for the western basin indicate concentrations comparable to those in the 1970s. Algal blooms are a problem in Lake Erie again, but the species make-up of these blooms has changed since the 1960s and 1970s, making this a familiar yet new challenge to tackle. In Lake Erie’s eastern basin, nuisance algae continue to wash up on shore and foul beaches. Lake Erie’s central basin is also prone to low or no oxygen conditions in the summer, which is exacerbated by increased amounts of decaying algae and has resulted in extensive fish kills in the lake. See how the ministry’s monitoring data was recently used to explain the reason for the fish kills in Lake Erie in 2012.
Lakes Ontario and Huron are also afflicted by many pressures, including nutrient and algal issues. Offshore phosphorus levels are decreasing in Lakes Ontario and Huron but may be getting too low to support productive food webs. Invasive zebra and quagga mussels are believed to play a key role in declining offshore levels as they are efficient at filtering particles and phosphorus out of water and converting it to a form that aquatic plants and algae can easily use to grow. In this way, nuisance aquatic plants and algae can thrive in the nearshore, and prevent the movement of phosphorus to offshore regions for use by food webs there.
As a result, the lakes’ food webs are under stress, and Diporeia, an important food source for small fish, is declining and almost gone from both lakes. Diporeia was extirpated from Lake Erie in the 1990s and the establishment and spread of invasive zebra and quagga mussels have been linked to its decline and loss in the Great Lakes. Preyfish populations including Perch, Lake Whitefish and Rainbow Smelt are also declining because of food web changes related to invasive species and increased predation. Preyfish population numbers for some species are near historic lows in Lake Huron.
Lake-wide pressures
In all the Great Lakes, water quality is also affected by new and emerging contaminants. Some toxic chemicals in offshore waters of the Great Lakes are at low concentrations and decreasing, but others are increasing or unchanged. Levels of many legacy chemicals are low and declining in the offshore, but they are still detectable in fish and waterbirds and exceed fish consumption guidelines in some areas. Mercury levels in fish in the Canadian Great Lakes are mostly below fish consumption guidelines, but levels appear to be increasing in Erie since 1990. PCB levels in fish in the Canadian waters of the Great Lakes have also decreased since the 1970s but larger sizes of mostly fatty species remain above fish consumption benchmarks for the protection of human health, as outlined in the Guide to Eating Ontario Fish.
Climate change is also placing stress on the Great Lakes. Studies undertaken for the International Joint Commission have indicated considerable uncertainty regarding the impacts of climate change on water levels but have flagged potential increases in fluctuations and a possible decrease in average lake levels
How Ministry data and experts contribute to state of the Great Lakes reporting by partners
The index of water quality for Great Lakes tributaries
What is the overall water quality status of tributaries (rivers and streams) that drain into the Great Lakes? The ministry set out to answer this question for the most recent publication of the Binational State of the Great Lakes report
Water quality monitoring results from the ministry’s Provincial Water Quality Monitoring Network were assembled for 95 monitoring stations that are located at or near the outlets of tributaries to the Great Lakes, from the Kaministiquia River in Thunder Bay to the Cataraqui River near Cornwall. The results were entered into the Canadian Council of Ministers of the Environment (CCME) Water Quality Index (WQI)
Results showed that the average water quality status of tributaries to the Great Lakes can be described as Fair (average WQI =70). Of the 95 monitoring stations, 39% of sites were categorized as having Good water quality, 48% were Fair and 13% were Poor. Good water quality was found in certain tributaries to Lakes Superior, Huron and Ontario and the St. Lawrence River. Poor water quality was found in certain tributaries to Lakes Erie and Ontario. The WQI values at individual sites ranged from 7.6 (Sturgeon River, Lake Erie) to 100 (Montreal River and Michipicoten River, Lake Superior; Mississagi River and Serpent River, Lake Huron).
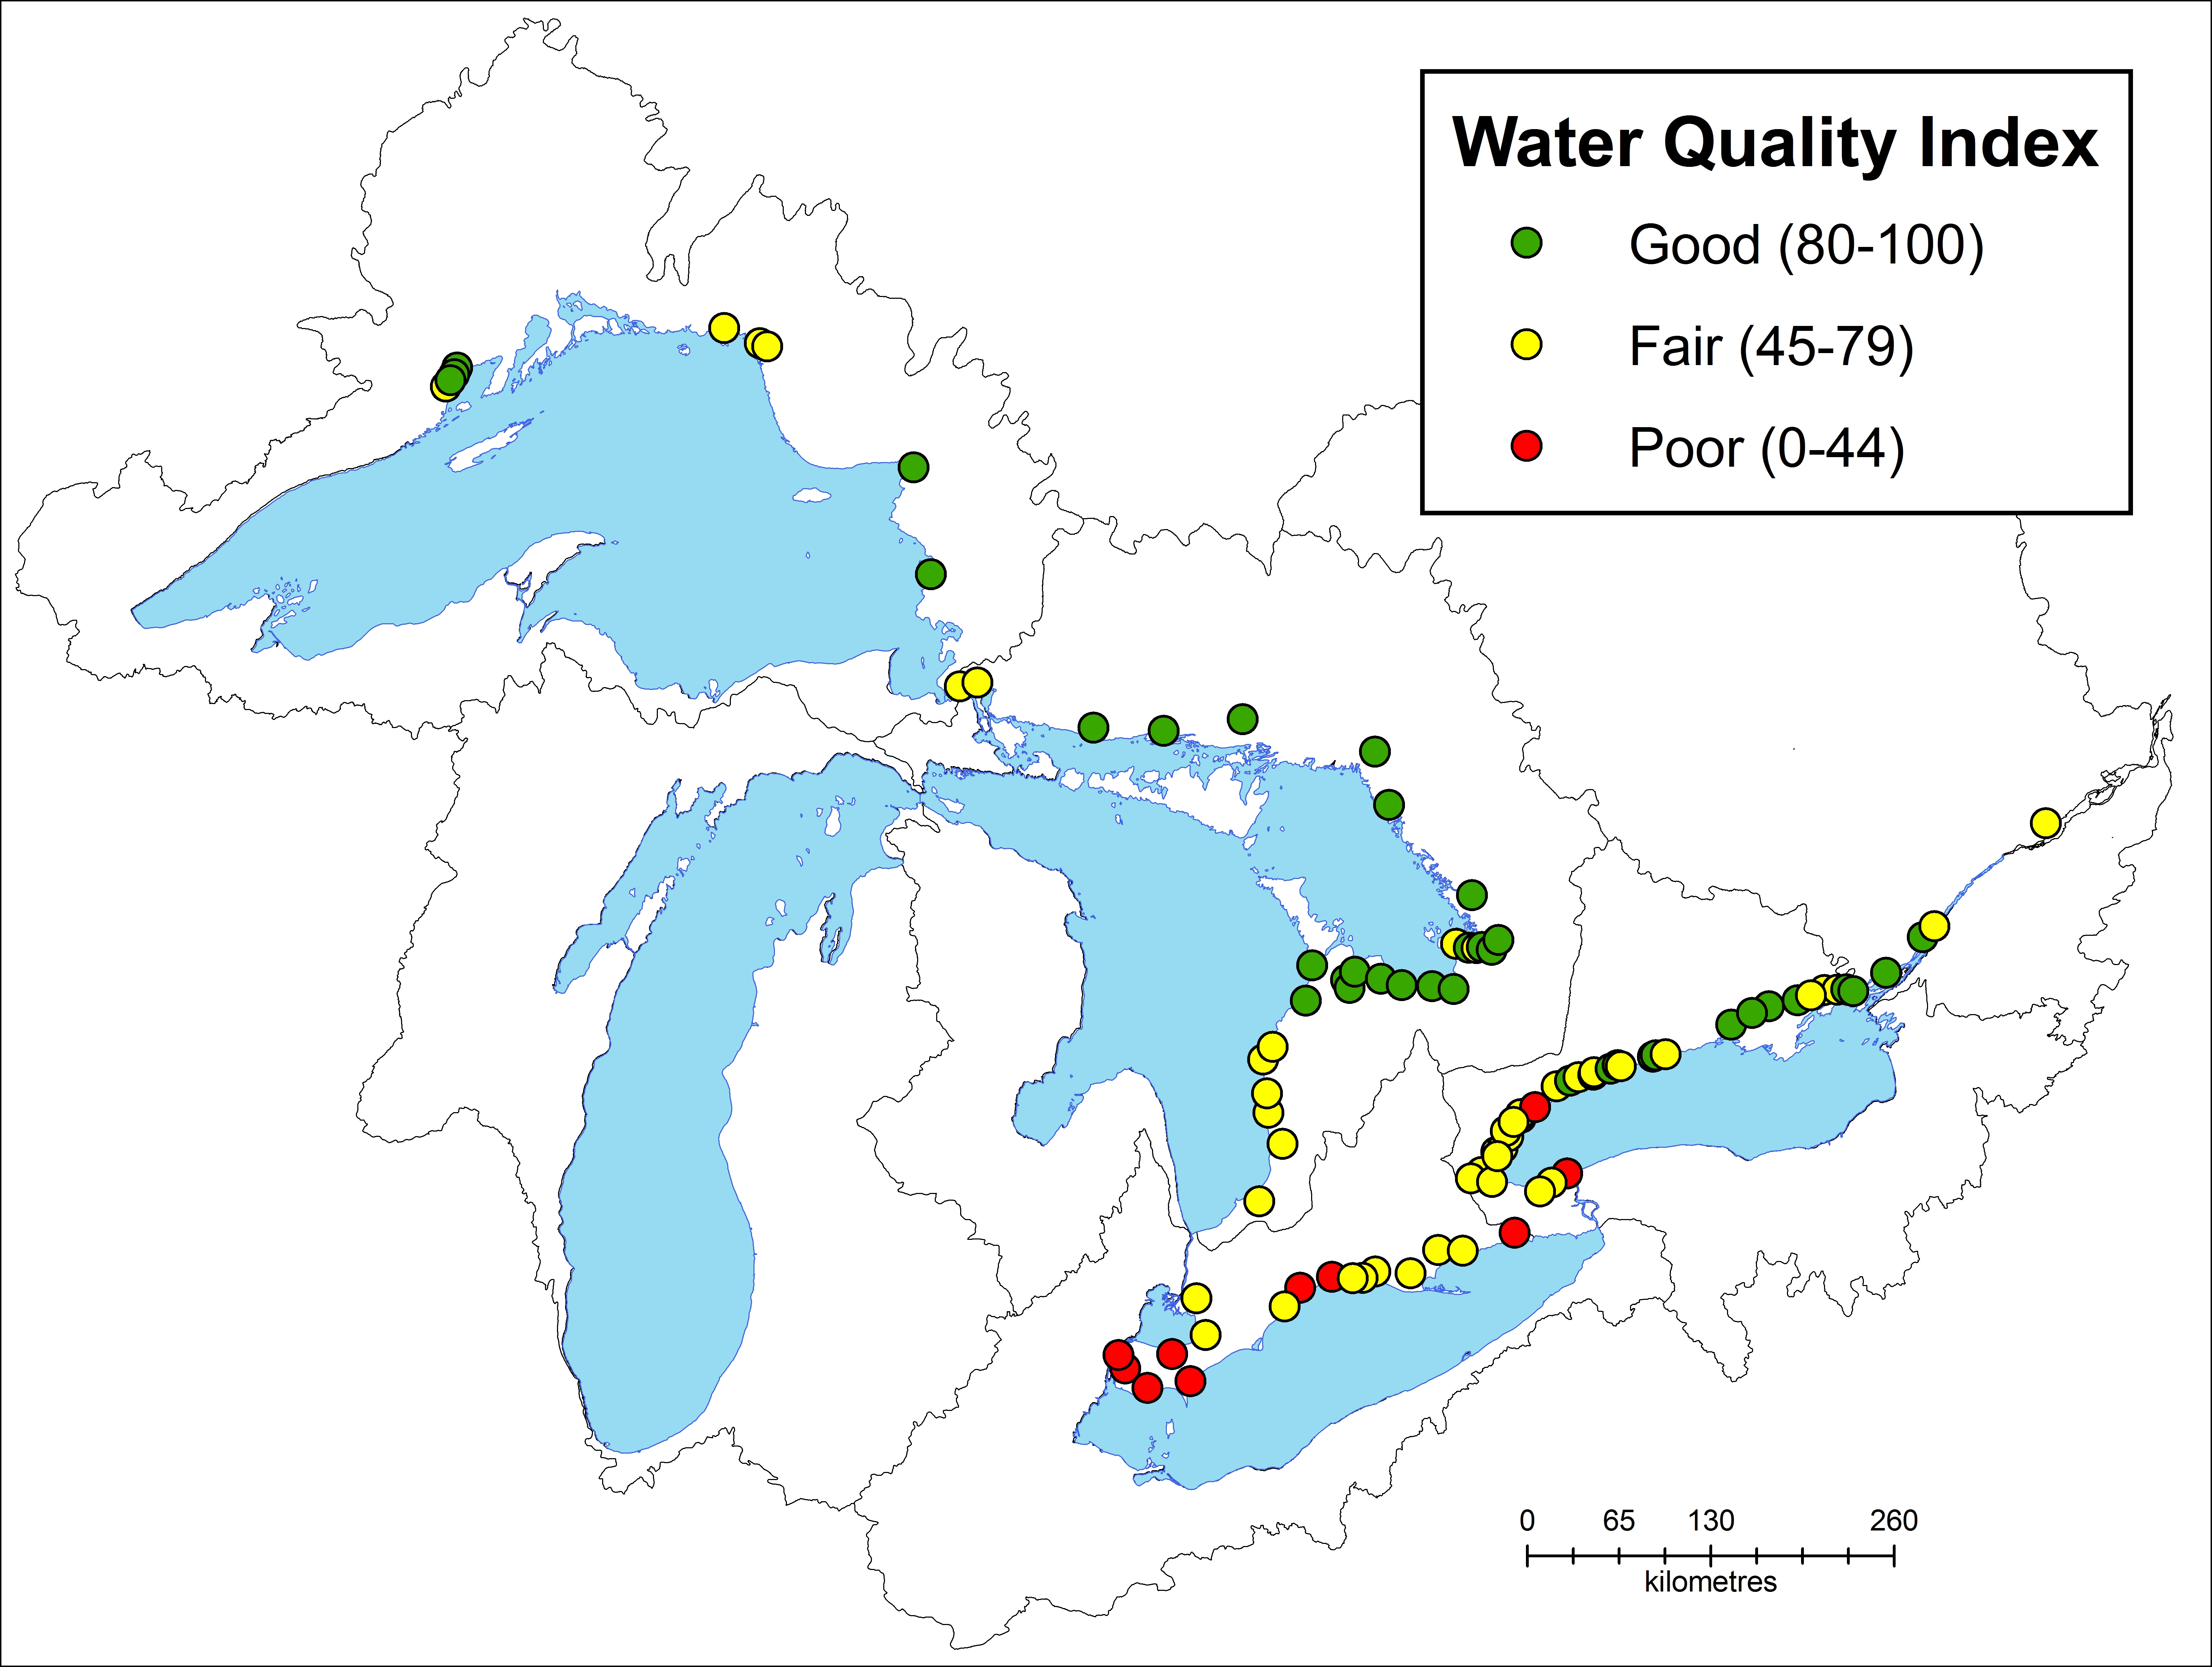
Figure 1: Water Quality Index values for 95 tributaries to the Great Lakes.
On a lake-by-lake basis, tributaries to Lake Superior (average WQI = 80), Lake Huron (average WQI = 83) and the St. Lawrence River (average WQI = 81) can be described as having Good water quality. Tributaries to Lake Erie (average WQI = 45) and Lake Ontario (average WQI = 66) had Fair water quality. Not surprisingly, further analysis showed that watersheds with the least amount of human development had the highest WQI values.
This work supports the objective of ensuring that surface waters in the Great Lakes basin are of a quality that is protective of aquatic life and points to regions within the basin where sustained efforts are needed to reduce the effects of tributary water quality on the Great Lakes.
Ontario’s first Great Lakes strategy progress report to Ontarians
The province developed Ontario’s Great Lakes Strategy, 2012, in response to new pressures that were putting the Great Lakes in jeopardy. The Strategy maps out how the Government of Ontario will work across ministries and with our many partners to support the vision of healthy Great Lakes for a stronger Ontario – Great Lakes that continue to be drinkable, swimmable and fishable.
The six Great Lakes goals set out in the Strategy that we are committed to achieving are:
- engage and empower communities
- protect water for human and ecological health
- improve wetlands, beaches and coastal areas
- protect habitats and species
- enhance understanding and adaptation
- ensure environmentally sustainable economic opportunities and innovation
In March 2016 Ontario will release the first Great Lakes Strategy triennial progress report. The Great Lakes Strategy 2015 Progress Report to Ontarians will highlight some of Ontario’s achievements, partnerships and future actions, organized around the six6 goals of the Strategy.
The new Great Lakes Protection Act, 2015, sets out additional requirements for triennial Great Lakes progress reports. In future, triennial progress reports on Great Lakes will be required by the legislation to include information on Great Lakes environmental monitoring programs and their results, a description of Great Lakes progress as measured by a set of performance measures, and information on new or emerging threats to the Great Lakes-St. Lawrence River Basin. Many of the monitoring and research programs described in the Water Quality in Ontario Reports will help to meet those Great Lakes reporting requirements.
What the Ministry’s water quality in Ontario reports say about water quality in the Great Lakes
Similar to the State of the Great Lakes Reports, the findings presented in the Water Quality in Ontario Reports show that there have been some improvements in water quality in the Canadian Great Lakes between the 1970s and 1990s due to management actions. However, in recent years improvements have generally levelled off and in some cases conditions are deteriorating because of new and familiar problems. For example, since monitoring first began, we have seen improvements in levels of phosphorus and in contaminants, such as PCBs and mercury, in our Great Lakes between the 1970s and 1990s, but new challenges presented by chemicals of emerging concern, invasive species, climate change and population growth are getting in the way of further progress.
Nutrient and algal issues and the role of invasive species
- Phosphorus levels in the Great Lakes have declined between the 1970s and 1990s in response to management actions, but since then have generally levelled off; however, reported algal blooms have increased in some of the Great Lakes and in recent years phosphorus levels are increasing in parts of Lake Erie.
- In Lake Erie, cyanobacterial blooms are re-appearing in the lake’s western and central basins (Figures 3.6-3.8, Water Quality in Ontario 2012 Report). The ministry works closely with local public health teams when responding to algal blooms.
- Some of the nutrient and algal issues observed today have been linked to the establishment of invasive mussels in some of the Great Lakes. Invasive mussels are redistributing nutrients into the nearshore areas of the lower Great Lakes (Figure 3.2, Water Quality in Ontario 2012 Report). The mussels provide clearer water by their filtering action, and provide a hospitable surface for algae to attach to, promoting an increase in algae growth.
Older, persistent contaminants
- Levels of contaminants such as PCBs, dioxins and furans have decreased in the Great Lakes by as much as 90% in the last four decades (see the 2013-2014 Guide to Eating Ontario Sport Fish) and Figure 5.1, Water Quality in Ontario 2010 Report).
- Concentrations of pesticides such as dichloro-diphenyl-trichloroethane (DDT), toxaphene and mirex have decreased significantly in Great Lakes fish and are generally no longer of concern (Figure 4.4(c), Water Quality in Ontario 2010 Report). Although levels of pesticides and contaminants such as PCBs have decreased in Great Lakes fish, fish consumption advisories are still in place in many parts of the Great Lakes. For more information, see the Guide to Eating Ontario Fish.
- Provincial actions to reduce mercury emissions have resulted in a long-term decline in the levels of mercury in fish in the Great Lakes (Figure 4.2, Water Quality in Ontario 2012 Report). More recently, however, mercury levels in fish from the Great Lakes are declining at a slower rate, not changing, or increasing slightly. The reason for this short-term change is unclear; however, researchers speculate that changes could be due to increased global emissions to the atmosphere, invasive species, climate change and changes in water chemistry.
Emerging chemicals and urban areas
- Emerging chemicals are a broad category of compounds that were previously unknown, unrecognized, or unregulated but have been found to be present in the environment. They are being increasingly detected in the Great Lakes and tend to be more concentrated in urban areas where more of the chemicals are used due to higher population density. For example:
- trace quantities of pharmaceuticals have been detected in the Great Lakes. While levels are in the low nanogram per litre (ng/L) range, concentrations tend to be highest in waters near urban centres (Figures 4.8 and 4.9, Water Quality in Ontario 2012 Report). We are working with national and international scientists to understand the risks of trace quantities of pharmaceuticals in the environment.
- levels of one group of flame retardants, polybrominated diphenyl ethers (PBDEs) in Great Lakes sediment have increased dramatically since the 1980s (Figure 5.2b, Water Quality in Ontario 2008 Report). PBDE levels in Great Lakes sediment are highest near urban areas (Figure 4.2 and 4.3, Water Quality in Ontario 2010 Report). Government and industry have begun to take actions such as banning or phasing out the use of PBDEs.
- ministry and university scientists have found that a class of flame retardants, referred to as dechloranes, and their degradation products are present in Great Lakes sediment and fish. The most toxic and bioaccumulative compound, known as the pesticide Mirex, was banned in the 1970s, but other flame retardant compounds with lower toxicity have replaced it. A degradation product of one compound was found to have higher concentrations in Lake Trout and to be 300 times more bioaccumulative than its parent form. These findings highlight the importance of considering how emerging chemicals may change once they enter the environment. The ministry and its partners continue to work to identify whether there are chemicals accumulating in the environment and determine whether they are of concern to environmental and human health.
- levels of oil and water repellants, specifically perfluorooctane sulfonate (PFOS), have declined in Etobicoke Creek – a tributary of Lake Ontario – following an airport incident that released PFOS into the creek, but there are conflicting trends in Lake Ontario. PFOS levels in Lake Ontario Lake Trout have levelled off while PFOS concentrations in the lake’s sediment continue to rise (Figure 4.11, Water Quality in Ontario 2012 Report). Government and industries have taken action by banning or phasing out the use of certain types of PFOS, but the ministry continues to monitor for PFOS in some Ontario communities.
- Microplastic particles are another example of an emerging concern in Ontario’s water resources. Microplastics are small but harmful plastic particles that can damage lakes, rivers, fish and wildlife. The Province of Ontario is currently undertaking research to gain a better understanding of microplastics in the Great Lakes.
Chloride levels, road salt use, urban growth, and changes in climate
- Chloride levels peaked in Lake Ontario between the 1960s and 1970s and then decreased between the mid-1970s and 1995 as a result of reductions in chloride loading following controls on industrial sources.
- However, chloride levels have been increasing in Lake Ontario since the mid-1990s. Increasing urbanization and the associated use of road salt on many roads, parking lots and sidewalks is likely contributing to these increases. Although concentrations in the lake remain far below those associated with adverse effects on aquatic life, chloride levels in Lake Ontario are highest at sampling locations in intensely urban areas where urban stormwater and runoff is potentially causing periodic adverse effects in urban rivers. Climate may also play an important role in rising chloride levels, as chloride concentrations tend to be higher in years with more precipitation and greater total snow depth during the winter.
Extreme weather events and climate change
- The ministry recently used its monitoring data to examine how nearshore water quality in Lake Ontario at the Toronto waterfront was affected by a record-breaking rainfall event in July 2013. Water quality in the nearshore was impaired by stormwater runoff that entered the lake during the event, containing elevated levels of suspended solids, phosphorus and fecal indicators. The study provides an example of how the ministry’s Great Lakes monitoring program is well-positioned to measure the effects of climate change on Great Lakes water quality. The information from this study will be used by the ministry to help form strategies for mitigating the effects of climate change on Ontario’s water resources.
Cleaning up “hotspots” in the Great Lakes basin
The research featured in the Water Quality in Ontario Reports also shows that through working with our partners, we have achieved measurable success in cleaning up contaminated areas in the Great Lakes basin:
- we have cleaned up toxic hot spots in Collingwood Harbour, Severn Sound and Wheatley Harbour (see section 4.1, Water Quality in Ontario 2010 Report).
- with the major sources of pollution controlled, monitored natural recovery is underway in Spanish Harbour and Jackfish Bay (see Section 4.4, Water Quality in Ontario 2012 Report). Extensive clean up actions have brought us closer to restoring sediment quality at Peninsula Harbour. Efforts to clean up Randle Reef in Lake Ontario’s Hamilton Harbour are also underway.
- actions to clean up contaminants, including PCBs and mercury, in Lake Ontario’s Areas of Concerns (AOCs) including the Niagara River, Hamilton Harbour, Toronto & Region, Bay of Quinte and St. Lawrence River, have resulted in significant reductions in contaminant levels in fish from these hot spots since the 1970s. Recovery efforts within these hot spots are ongoing, and further decreases in levels of these major harmful chemicals in fish from these areas are generally expected during the next 10-20 years.
- in the Niagara River Area of Concern, the ministry is using caged mussels to identify sources of contaminants to the river. This has resulted in targeted actions to remediate contaminant sources on the US side of the river and ultimately improve water quality in the river. Over time, lower contaminant levels have been found in caged mussels from these remediated sites. Concentrations of many contaminants have also decreased over time in fish, water and sediment samples collected at the head and the mouth of the river. The ministry will continue to use mussels to identify existing sources of contamination along the river.
- in the Great Lakes basin, through investigative monitoring using multiple sampling in targeted locations, we have tracked PCB contamination to its source. This has resulted in many sediment clean-ups including the remediation of Beaverdams (Figure 4.14 and 4.15, Water Quality in Ontario 2012 Report), Turkey and Sinister Creeks and the Cataraqui River.
The remainder of this chapter presents some of these key findings in more detail.
Multiple stressor effects on Great Lakes water quality
The water quality of the Great Lakes has been significantly affected by human activities. Loading of nutrients and other pollutants, climate change and invasion by exotic species are key stressors impacting the Great Lakes and the ecosystem services and functions they provide. Routine monitoring of raw water samples from water treatment plants began in the 1960s to track the cumulative effects of these and other interrelated stressors on nutrients and planktonic algae in the nearshore areas of the Great Lakes.
The Great Lakes Intake Program is a 50-year partnership between the ministry and municipal water treatment plants to provide low-cost, high-frequency monitoring of source water in the Great Lakes Basin. Untreated water samples are collected year-round on a weekly or bi-weekly basis at water treatment plant intakes and then analyzed in the ministry’s laboratory. Seventeen intakes in the Great Lakes – St. Lawrence River, shown in the figure below, are currently monitored in the Great Lakes nearshore through this program. Data from this program is available on OPS Open Data Catalogue.
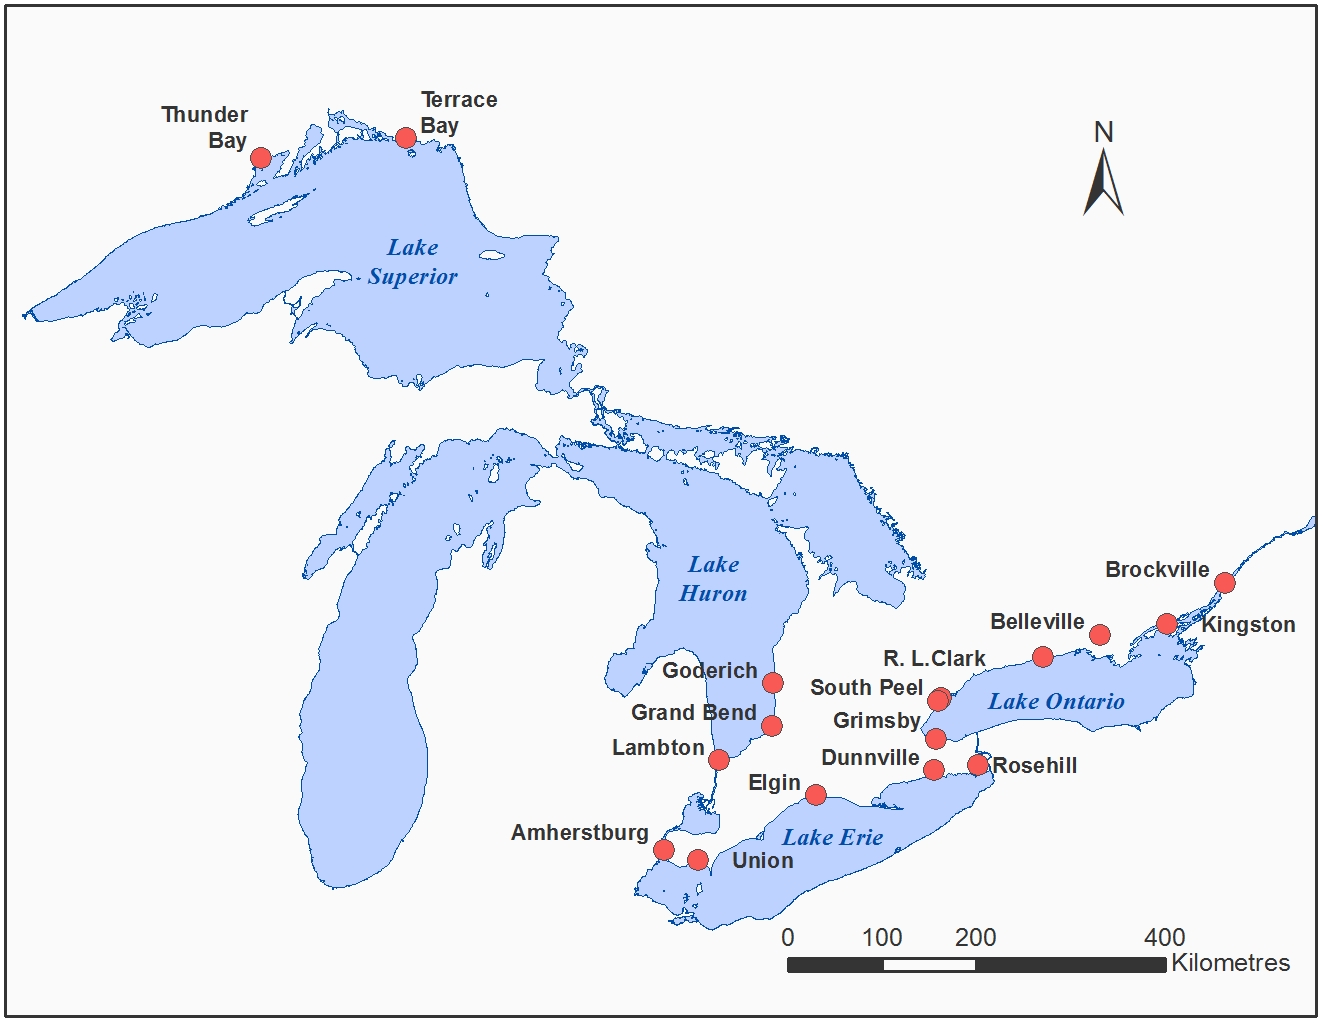
Figure 2: A map of the Great Lakes showing the water treatment plant sampling locations for the Great Lakes Intake Program.
Long-term monitoring at the intakes provides data that are essential for identifying the stressors affecting the nearshore and their cumulative effects on water quality. These data are also needed to assess the effectiveness of management actions to restore and protect the Great Lakes. Phosphorus and chloride data from the intakes are examples of long-term monitoring data that are used to identify and address water quality issues resulting from multiple stressors.
The effects of nutrients, algae and invasive mussels on Great Lakes water quality
In the 1960s-1970s, phosphorus levels in Lakes Huron, Erie and Ontario were elevated due to excess phosphorus loading from multiple land use activities around the lakes (Figure 3a). This excess phosphorus promoted the growth of planktonic algae and caused harmful algal blooms to proliferate in some areas of the Great Lakes. Chlorophyll levels, which are an indicator of algal abundance, were particularly high in Lakes Erie and Ontario (Figure 3b).
Public concern about the health of the Great Lakes led to the signing of the first Canada-Ontario Agreement on Great Lakes in 1971. Following this agreement, a number of initiatives were introduced to reduce nutrient loading, including lowering phosphorus levels in sewage treatment plant effluent discharged to the Great Lakes and legislation to limit phosphorus in detergents
Nutrient reduction initiatives led to significant decreases in phosphorus and chlorophyll levels in the lakes between the 1970s and 1990s (Figure 3a,b). Further reductions occurred in the mid-1990s following the establishment and proliferation of the zebra and quagga mussels. These invasive species are filter-feeders that filter algae and particles, thus removing from the water column some of the phosphorus that is within the algal cells or bound to the particles.
However, monitoring at the intakes shows that nutrient and algae problems are not resolved in the Great Lakes. In general, levels of phosphorus and chlorophyll have levelled off at monitored sites in Lakes Huron and Ontario. In Lake Erie, levels of phosphorus and chlorophyll have increased in recent years (Figure 3a,b), particularly in the western basin where large blooms of potentially toxic cyanobacteria have correspondingly re-occurred
Invasive mussels, which initially promoted further reductions in phosphorus levels in the Great Lakes in the mid-1990s, are now contributing to increasing nutrient levels and other water quality issues in the nearshore where they are particularly abundant, even covering the lakebed in some areas. As filter-feeders, dreissenid mussels, such as zebra and quagga mussels, increase water clarity, which allows sunlight to penetrate to greater depths, and may be increasing the retention and recycling of nutrients in the nearshore. This enables Cladophora, a green, hair-like alga that grows on the lakebed of the nearshore, to grow on a larger area of the lakebed. The mussels also release nutrients at the lakebed, providing more nutrients for Cladophora growth. When mussels spread on the bottom of the lake, their shells create a hard and hospitable surface promoting further Cladophora growth. When Cladophora die, they periodically wash up on shores, accumulating on and fouling shorelines and beaches.
Invasive mussels in the Great Lakes have also been linked to cyanobacterial blooms. Mussels selectively eat some algae, but not cyanobacteria, which may alter competition between cyanobacteria and other phytoplankton, and promote cyanobacterial blooms.
The effects of chloride, urban growth and changes in climate on Great Lakes water quality
Other measures of water quality in the Great Lakes have also changed in response to multiple stressors. Long-term chloride data from Lake Ontario intakes provide an example of how land use changes and climate can affect water quality. The ministry currently monitors chloride in water as an indicator of the impacts of human land use, including the use of road salts, on water quality; in decades past, chloride was primarily attributed to industrial inputs. Road salts are mostly comprised of sodium chloride, which separates into its two components, sodium and chloride, when it comes into contact with water. Chloride, which is highly mobile in the environment, is the greater threat to aquatic life. Studies show that elevated concentrations of chloride can negatively affect the health of plants, animals and aquatic ecosystems and can contaminate sources of drinking water
Chloride levels peaked in Lake Ontario between the 1960s and 1970s and then decreased between the mid-1970s and 1995 (Figure 3c). These decreases reflect reductions in chloride loading following controls on industrial sources
However, chloride levels have been increasing in Lake Ontario since the mid-1990s. Increasing urbanization and associated use of road salt on many roads, parking lots and sidewalks is likely contributing to these increases
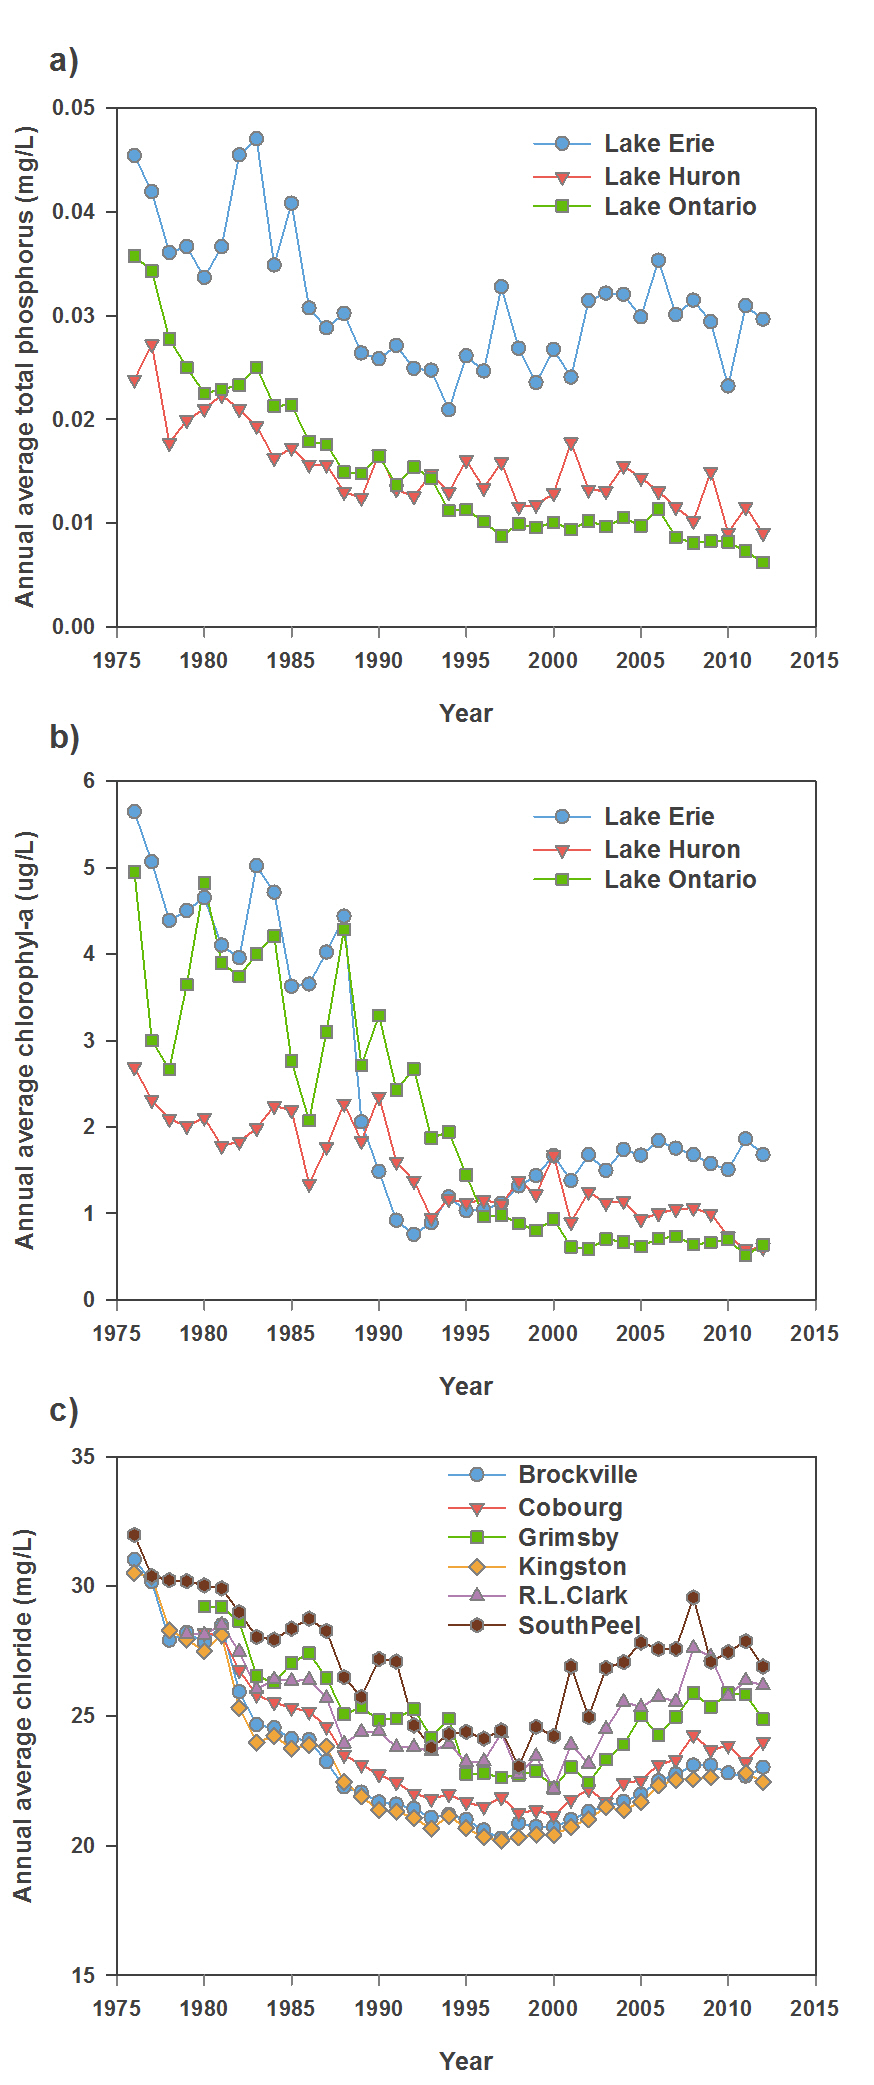
Figure 3: Annual average (a) total phosphorus and (b) chlorophyll-a concentrations at monitored locations in Lakes Erie, Huron and Ontario, 1975-2012, and (c) chloride concentrations at six locations in Lake Ontario, 1975-2012. Notes: Lake values in (a) and (b) were calculated by averaging the annual values for the sampling locations within each lake; the Belleville location, which is in the Bay of Quinte, was not included in the open water average for Lake Ontario.
Climate may also play an important role in rising chloride levels. Lake Ontario chloride concentrations tend to be higher in years with more precipitation and greater total snow depth3. Chloride levels also tend to peak during the winter. Collectively, these findings suggest that changes in climate that alter winter conditions, and thus the use of road salt and seasonal snowmelt and runoff, will also affect chloride levels in the Great Lakes. Ongoing chloride monitoring in the Great Lakes will provide more information for tracking the effectiveness of best management practices in mitigating the environmental impact of road salts.
The Great Lakes are increasingly subject to multiple, interacting stressors that can affect water quality. The ministry is committed to protecting the Great Lakes to ensure they are drinkable, swimmable and fishable for future generations. The routine monitoring of raw water at drinking water intakes in the Great Lakes will continue to provide the long-term data needed to help successfully meet this challenge.
How the Ministry uses monitoring data to answer key questions about water quality
Finding the cause of Lake Erie’s fish kills
In the late summer of 2012 tens of thousands of dead fish washed up on a 40km stretch of Lake Erie’s north shore between Erieau and Port Stanley. A strong offensive odour was reported by nearby residents, with masses of dead fish first observed on some beaches on September 1, 2012. The dead fish were mostly comprised of Drum, Perch, Goby and Smelt, with fewer Carp, Sucker, Channel Catfish and Buffalo fish observed.
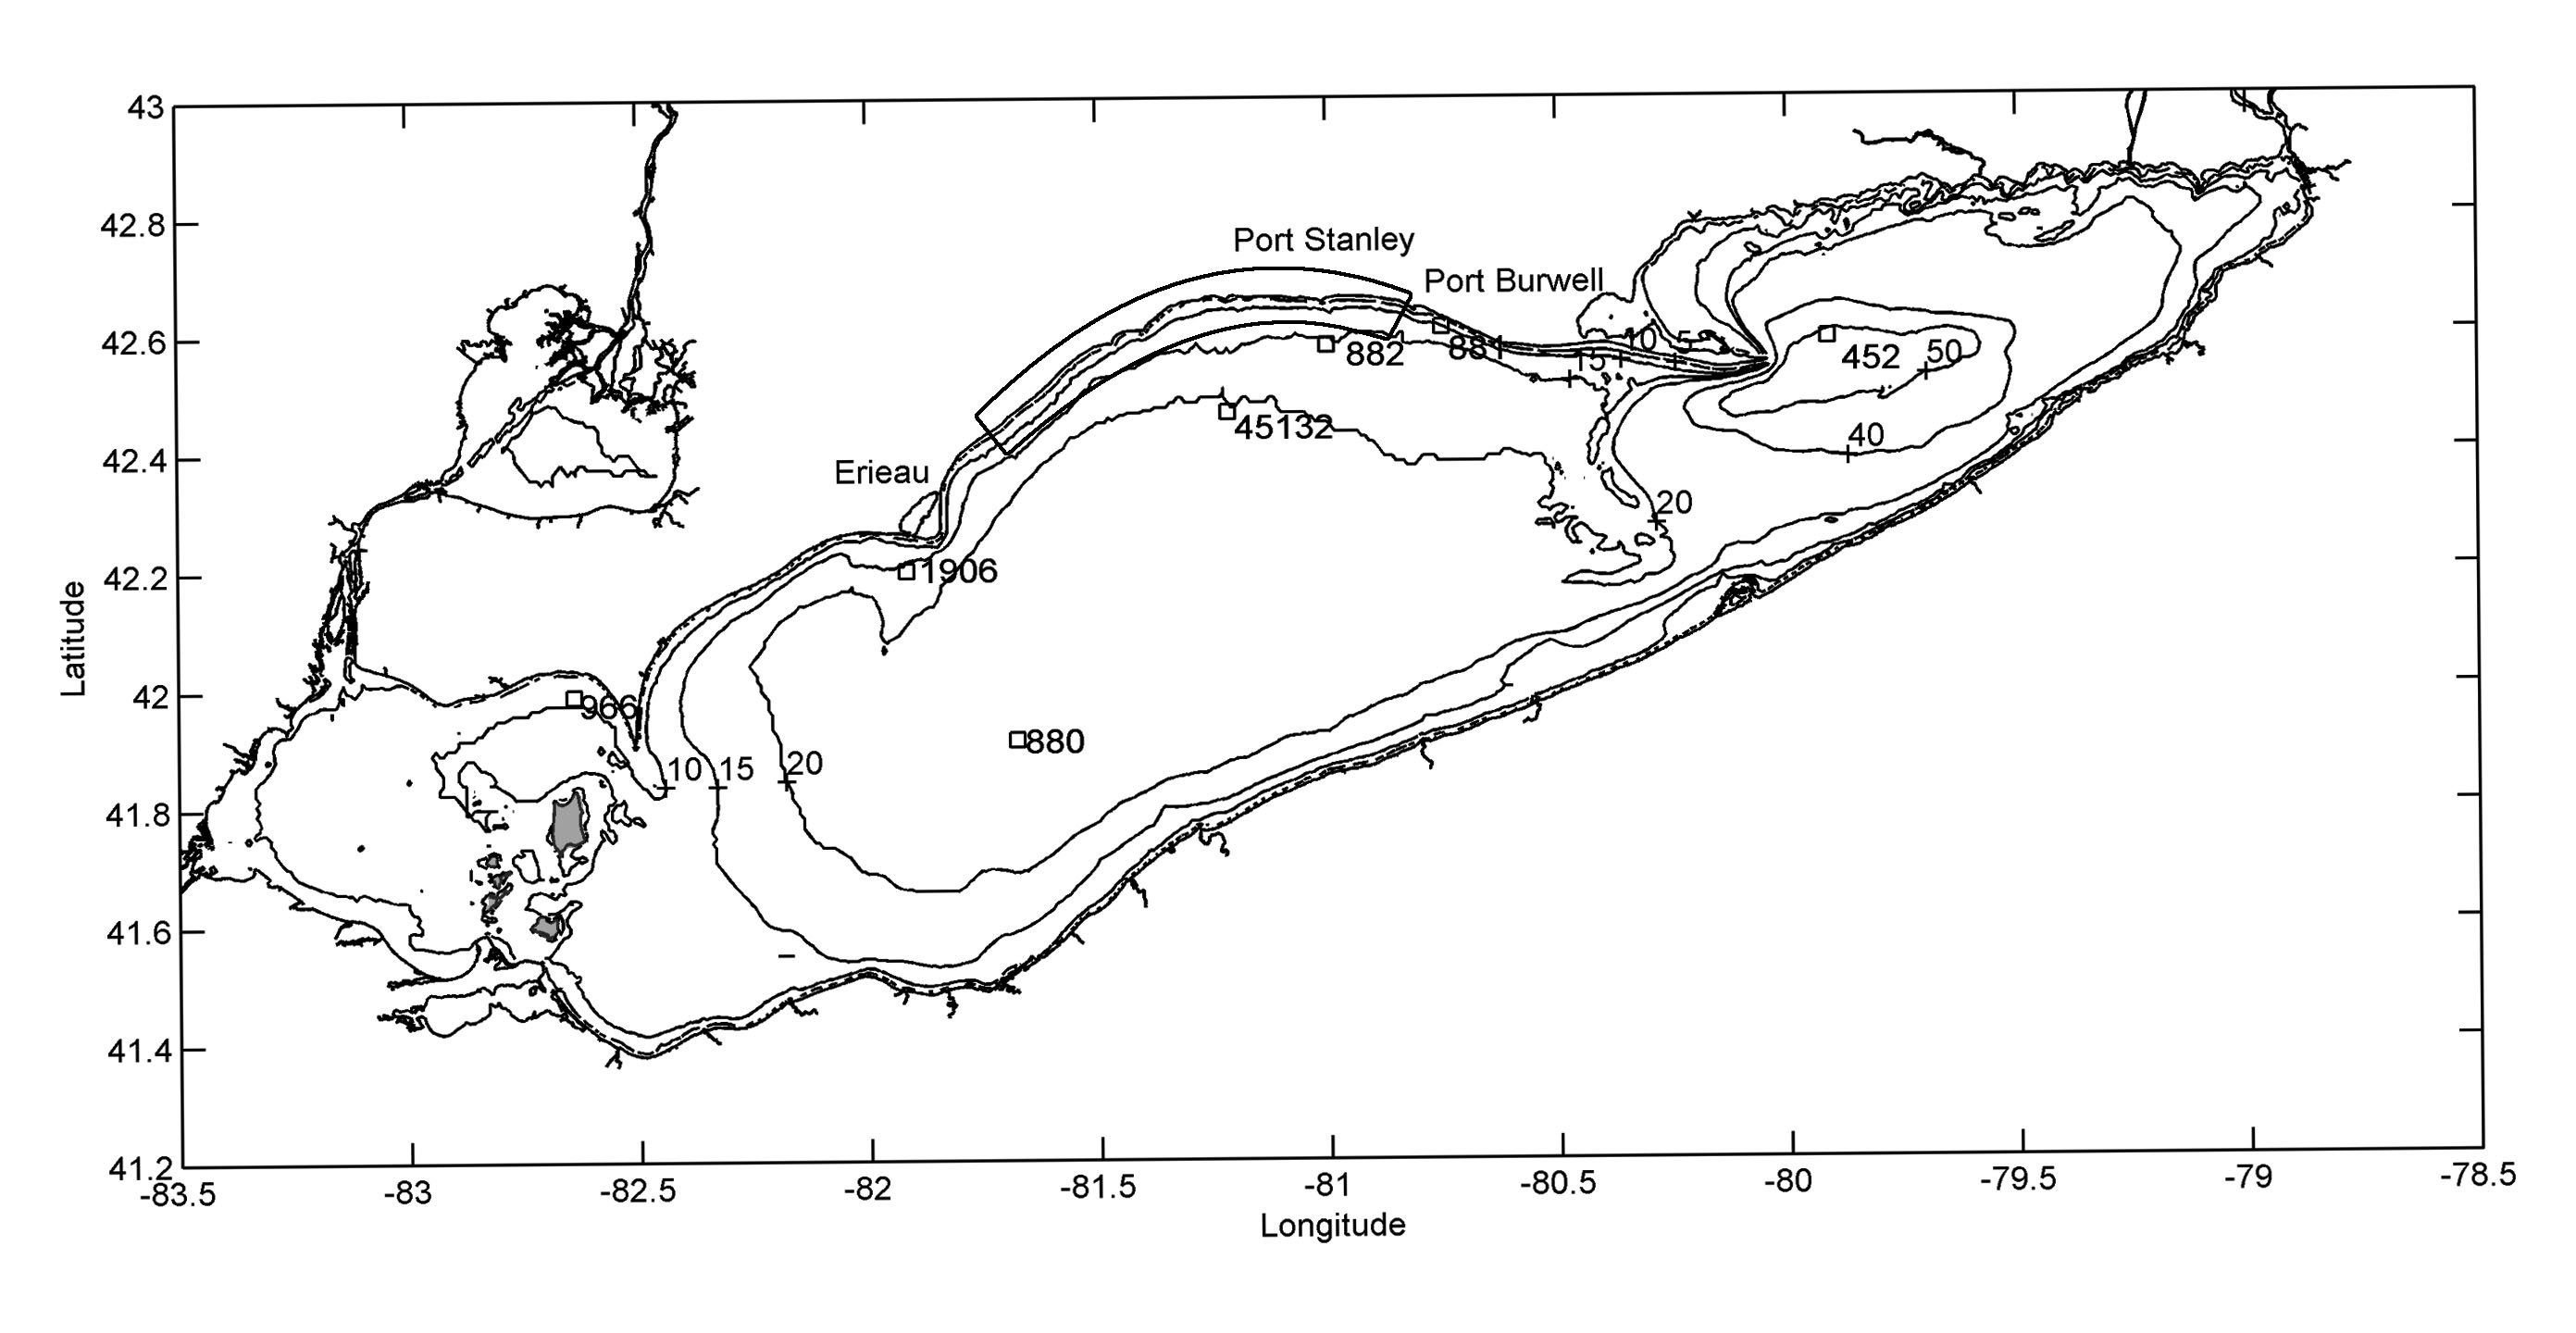
Figure 4: Map of Lake Erie with physical and water quality monitoring locations in 2012 (Rao et al, 2013).
Ministry and Environment and Climate Change Canada scientists set out to find the cause of the extensive fish kills. Some local residents were concerned that the incident could be linked to pollutants entering the water. The ministry promptly conducted lab tests on dead fish specimens and found no evidence of bacterial infections, diseases, algal toxins or contaminant poisoning. Both organizations were aware of similar incidents happening in the past in Lake Erie, though on a smaller scale.
The scientists believed the most probable cause was the movement of low-oxygen (hypoxic) waters from the deep, bottom layer of the central basin into Lake Erie’s nearshore zones. To test their hypothesis, they used temperature and water quality data collected from moored buoys at the ministry’s monitoring stations in Lake Erie’s nearshore zone. The data could be used to determine if weather and lake circulation were linked to the incident.
Ministry surveys of nearshore water quality being conducted around the time of the fish kill for other purposes indicated that water quality stressors such as fecal pollution or pollution runoff were not likely the cause.
Meteorological data at two nearby lake locations were also used to characterize the weather conditions before, during and after the incident, which included the period of August 27 to September 8, 2012.
Weather data revealed a series of strong southwesterly winds, with wind speeds peaking three times during August 30 to September 1. The wind conditions were favourable for an upwelling event, an event that occurs under certain wind conditions that causes the colder, low oxygen water to enter the surface layer. During this event, the thermocline, the thin layer of water between the top (epilimnion) and bottom (hypolimnion) layers, was raised to a depth of eight metres, where the temperature dropped six degrees (from 23 to 17 degrees Celsius) within an 18-hour period. A downwelling event occurs when the opposite happens ‒ water at the surface is moved downward to the lower layer. This downwelling event occurred a few days later, from September 3-5, resulting in a drop in the thermocline to a depth of below 14 metres at the nearshore station.
To characterize the oxygen levels in the water during the event, dissolved oxygen (DO) was measured in the upper and lower water columns at the three stations. The DO in the upper water column for the stations furthest from the fish kills showed little impact due to the upwelling event on August 30-September 2. However, DO depletion did occur at this time in the upper water column at the station closest to the fish kills (east of Erieau), with brief no oxygen (anoxic) conditions reached on September 2. DO levels in the upper water column then increased during the downwelling event on September 3-5 at this nearby station. Once the winds completely subsided, the DO levels returned to conditions observed before the events at all stations. Oxygen concentrations are lowest in the bottom waters from decomposition of algae and other organic material in this zone, which uses up oxygen as part of the process.
Water quality during the episode was assessed at drinking water intakes to the east of Erieau. At the West Elgin Water Treatment Plant, located 600 metres from the offshore and a few kilometres east of Erieau, significant changes in water quality were observed between August 31 and September 1. During the upwelling, a drop in pH from 8.6 to 7.5 occurred between August 31 and September 1, with a recovery on September 2. Water temperature also dropped by 2 to 3 degrees Celsius on August 31 and recovered on September 2 confirming the intrusion of colder waters to the nearshore zone.
The ministry also obtained shoreline samples on September 2 at several beaches where the incidents occurred to assess the algal composition of the nearshore waters. Algal toxins were detected in one of two samples tested, but levels were within the drinking water quality standards and below the level known to be acutely lethal to aquatic life.
The study
The ministry continues to monitor Lake Erie’s nearshore zones to understand how physical processes in the lake can affect water quality in the nearshore zones. The ministry is also working with Environment and Climate Change Canada to better understand nutrient dynamics and nearshore algal issues.
How investigative work is helping the Ministry identify and understand emerging contaminants
Emerging chemicals continues to be an area of investigation for the ministry. Flame retardants are one class of emerging chemicals, many of which have bromine and chlorine in their structures, making them more likely to persist in the environment and bioaccumulate in organisms such as fish. One group of flame retardants, the polybrominated diphenyl ethers (PBDEs) had rapidly increasing environmental concentrations (shown in WQR 2008 for Lake Ontario sediments), but they are now federally regulated and are being phased out of production around the world. Monitoring will continue for these compounds to ensure that environmental levels decline and cease to be of concern. A number of other flame retardants containing chlorine and bromine remain in use today, and researchers around the world are investigating these compounds to ensure environmental concentrations remain low and that they are not toxic to organisms.
Recent work by ministry scientists, in collaboration with researchers at Brock University and Environment and Climate Change Canada, has shown that a class of flame retardants, referred to as dechloranes, are present in Great Lakes sediment and fish
One way of assessing the potential of a chemical to bioaccumulate in fish is to calculate the biota-sediment accumulation factor (BSAF). The BSAF is the ratio of the concentration of the chemical found in fish to the concentration of the same chemical found in sediment in the area where the fish was collected; in this case Lake Ontario. Figure 5 compares the BSAF for several dechlorane compounds in Lake Ontario Lake Trout and sediment. Dechlorane Plus has the lowest tendency to bioaccumulate while the banned Mirex has the greatest potential. Dechlorane 604 has a relatively low BSAF compared to Mirex and Dechlorane 602. However, the breakdown product Dechlorane 604 Component B has a BSAF that is more than 300 times greater than the parent compound Dechlorane 604, demonstrating its greater potential to bioaccumulate and why we need to consider the impacts of the original compound Dechlorane 604, even if it isn’t directly toxic or bioaccumulative.
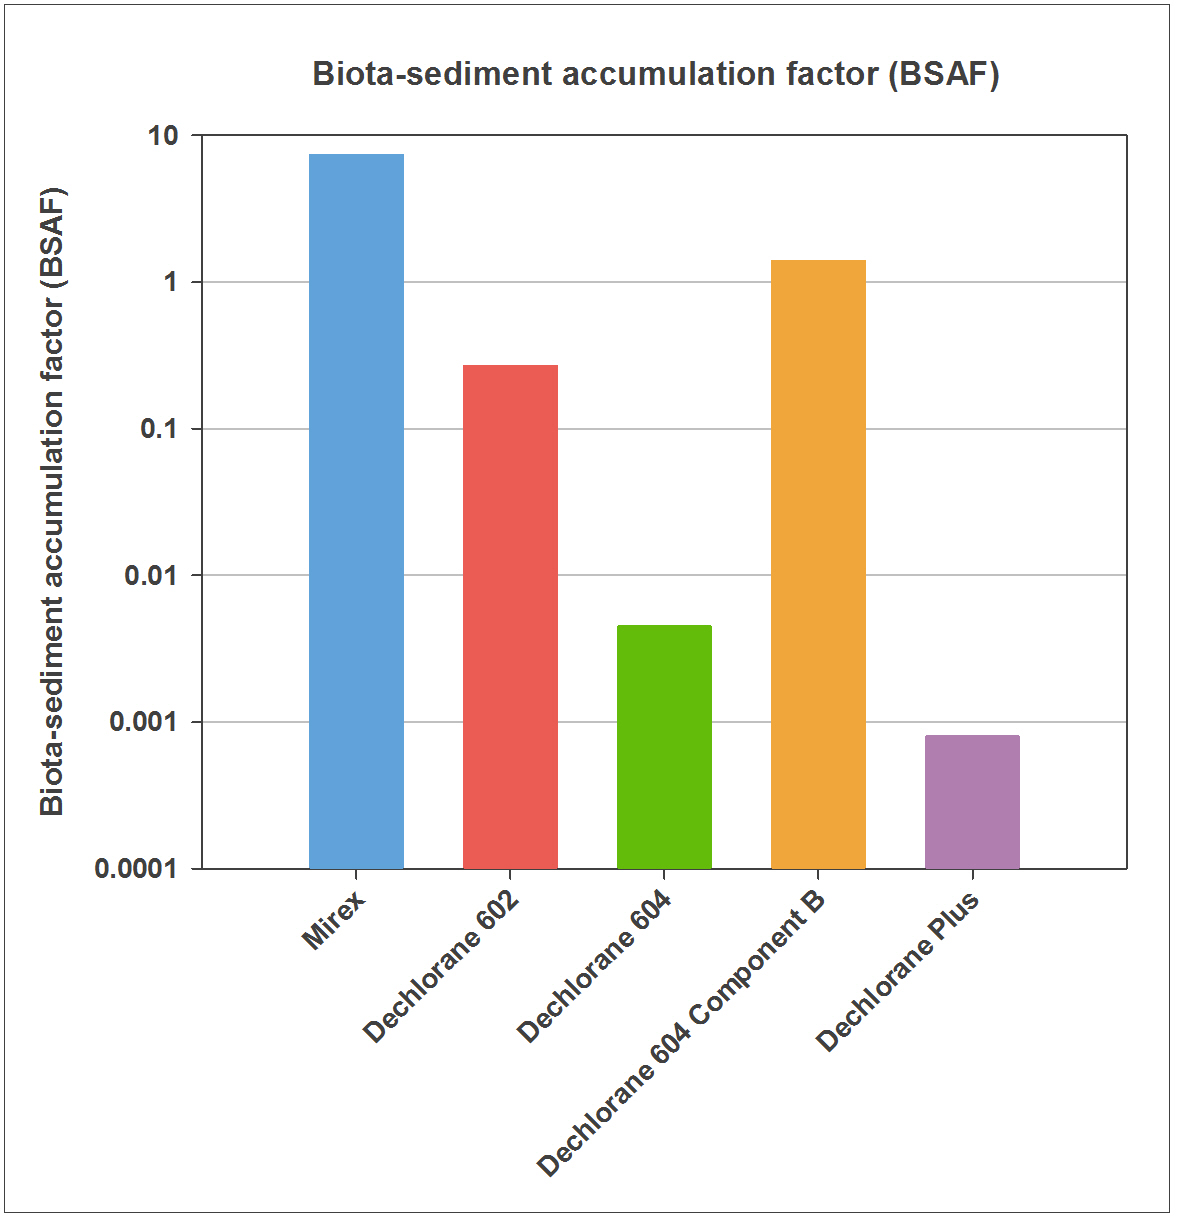
Figure 5: Bar graph showing the biota-sediment accumulation factor (BSAF) for several dechlorane compounds in Lake Ontario Lake Trout and sediment on a logarithmic scale, meaning for example that the BSAF for Dechlorane 604 Component B is more than 2 orders of magnitude greater (300 times) than the parent compound Dechlorane 604. The BSAF calculation shows the potential of a chemical to bioaccumulate in fish.
These findings highlight how important it is to consider the way chemicals of concern may change once they enter the environment. The ministry and our partners continue to work to identify whether there are chemicals accumulating in the environment and determine whether they are of concern to environmental and human health.
Climate change effects on Great Lakes water quality
The effects of climate change are already present in Ontario. Air temperatures have increased over the last century. Some of the highest rates of increase have been seen in northwestern Ontario. More frequent and intense weather events have also been recorded.
The ministry recently used its Great Lakes monitoring data to examine how a heavy rainfall event on July 8, 2013 affected the water quality of Lake Ontario’s shoreline at the Toronto waterfront. A record-breaking 126 mm of rain fell at Toronto Pearson Airport that day; more than the 121.4 mm received on October 15, 1954 due to Hurricane Hazel.
On the evening of July 8, 2013, heavy rain caused a surge in stormwater runoff from the land into the lake. The amount of water entering the lake from rivers extending from the Credit River to the Don River increased over the next one to three days, resulting in highly elevated levels of suspended solids, phosphorus and fecal indicators.
Monitoring on July 9 conducted over the Mississauga to Toronto waterfront revealed that runoff-impacted water extended more than three kilometres into the lake and was mostly confined to the surface layer of the water column. This lack of mixing between the runoff inputs and the deeper waters of the lake means less dilution of the polluted stormwater inputs, keeping pollutant concentrations high at the water surface. A significant amount of phosphorus that was bound to particulate matter was delivered to the lake during the event, with an estimate of about 27 metric tons attributable to the event. Levels of both E. coli and another fecal pollution indicator were highly elevated in surface water over much of the nearshore that was impacted by runoff.
Modelling of circulation patterns in Lake Ontario’s nearshore confirmed the spatial extent and location of adverse water quality and provided further projections of the dispersion of the stormwater runoff over the following days. Water quality conditions from the runoff persisted until July 11, at which time clean deep water from the offshore moved into the nearshore due to an upwelling event and diluted the runoff and pushed it offshore.
The ministry’s study highlights the spatial complexity of water quality in the nearshore environment and the sensitivity of this environment and water resources to extreme weather.
Cleaning up hot spots in the Great Lakes basin
Improvements in fish contaminants in Lake Ontario areas of concern (AOCs)
Elevated levels of contaminants in fish act as an environmental stressor to both fish and human health, and can also act as an indicator to measure the extent of environmental degradation. The Great Lakes have historically been impacted by a variety of environmental stressors, including high inputs of contaminants such as mercury, PCBs and dioxins. In the mid-1980s, a number of smaller sections within each lake, known as Areas of Concern (AOCs), were identified by the International Joint Commission of the U.S. and Canada as priority areas for remedial actions. One of the fourteen potential criteria for AOC designation was restrictions on fish consumption due to high contaminant levels. Within Lake Ontario, fish from the Niagara River, Hamilton Harbour, Toronto & Region, Bay of Quinte and St. Lawrence River AOCs were identified as having severely restricted fish consumption advisories, due to the inputs of locally-sourced contaminants.
Since their designation as AOCs, remedial actions have been implemented to improve the environmental health of these five regions. Now, almost 30 years later, data from the ministry’s Fish Contaminant Monitoring Program have been used to determine if levels of harmful chemicals have decreased in fish from the Lake Ontario AOCs. This assessment helps Remedial Action Plan teams determine if the actions taken have had an impact on the environmental health of the AOC, and whether restrictions on fish consumption remain.
The monitoring data show that, in general, concentrations of contaminants of major concern, including PCBs and mercury, have substantially decreased in fish within the Lake Ontario AOCs since the 1970s. A comparison of historical (1975-1985) and recent (2005-2013) PCB or mercury measurements in an indicator fish species for each AOC illustrates this change (Figure 6).
For example:
- on average, between 1975-1985 and 2005-2013, Rainbow Trout (60-70 cm) PCB concentrations from the Lower Niagara River decreased by 72% (from 1327 to 378 ng/g; Figure 6a).
- in Hamilton Harbour, Northern Pike (60-70 cm) PCB concentrations decreased by 76% (from 678 to 160 ng/g; Figure 6b).
- brown Trout (55-65 cm) PCB concentrations from the Toronto waterfront decreased by 58% (from 1836 to 776 ng/g; Figure 6c) and Smallmouth Bass (35-45 cm) PCB concentrations from the Bay of Quinte decreased by 92% (from 1036 to 85 ng/g; Figure 6d).
- in the St. Lawrence River at Cornwall, 55-65 cm Northern Pike mercury concentrations decreased by 26% (from 0.74 to 0.55 μg/g; Figure 6e).
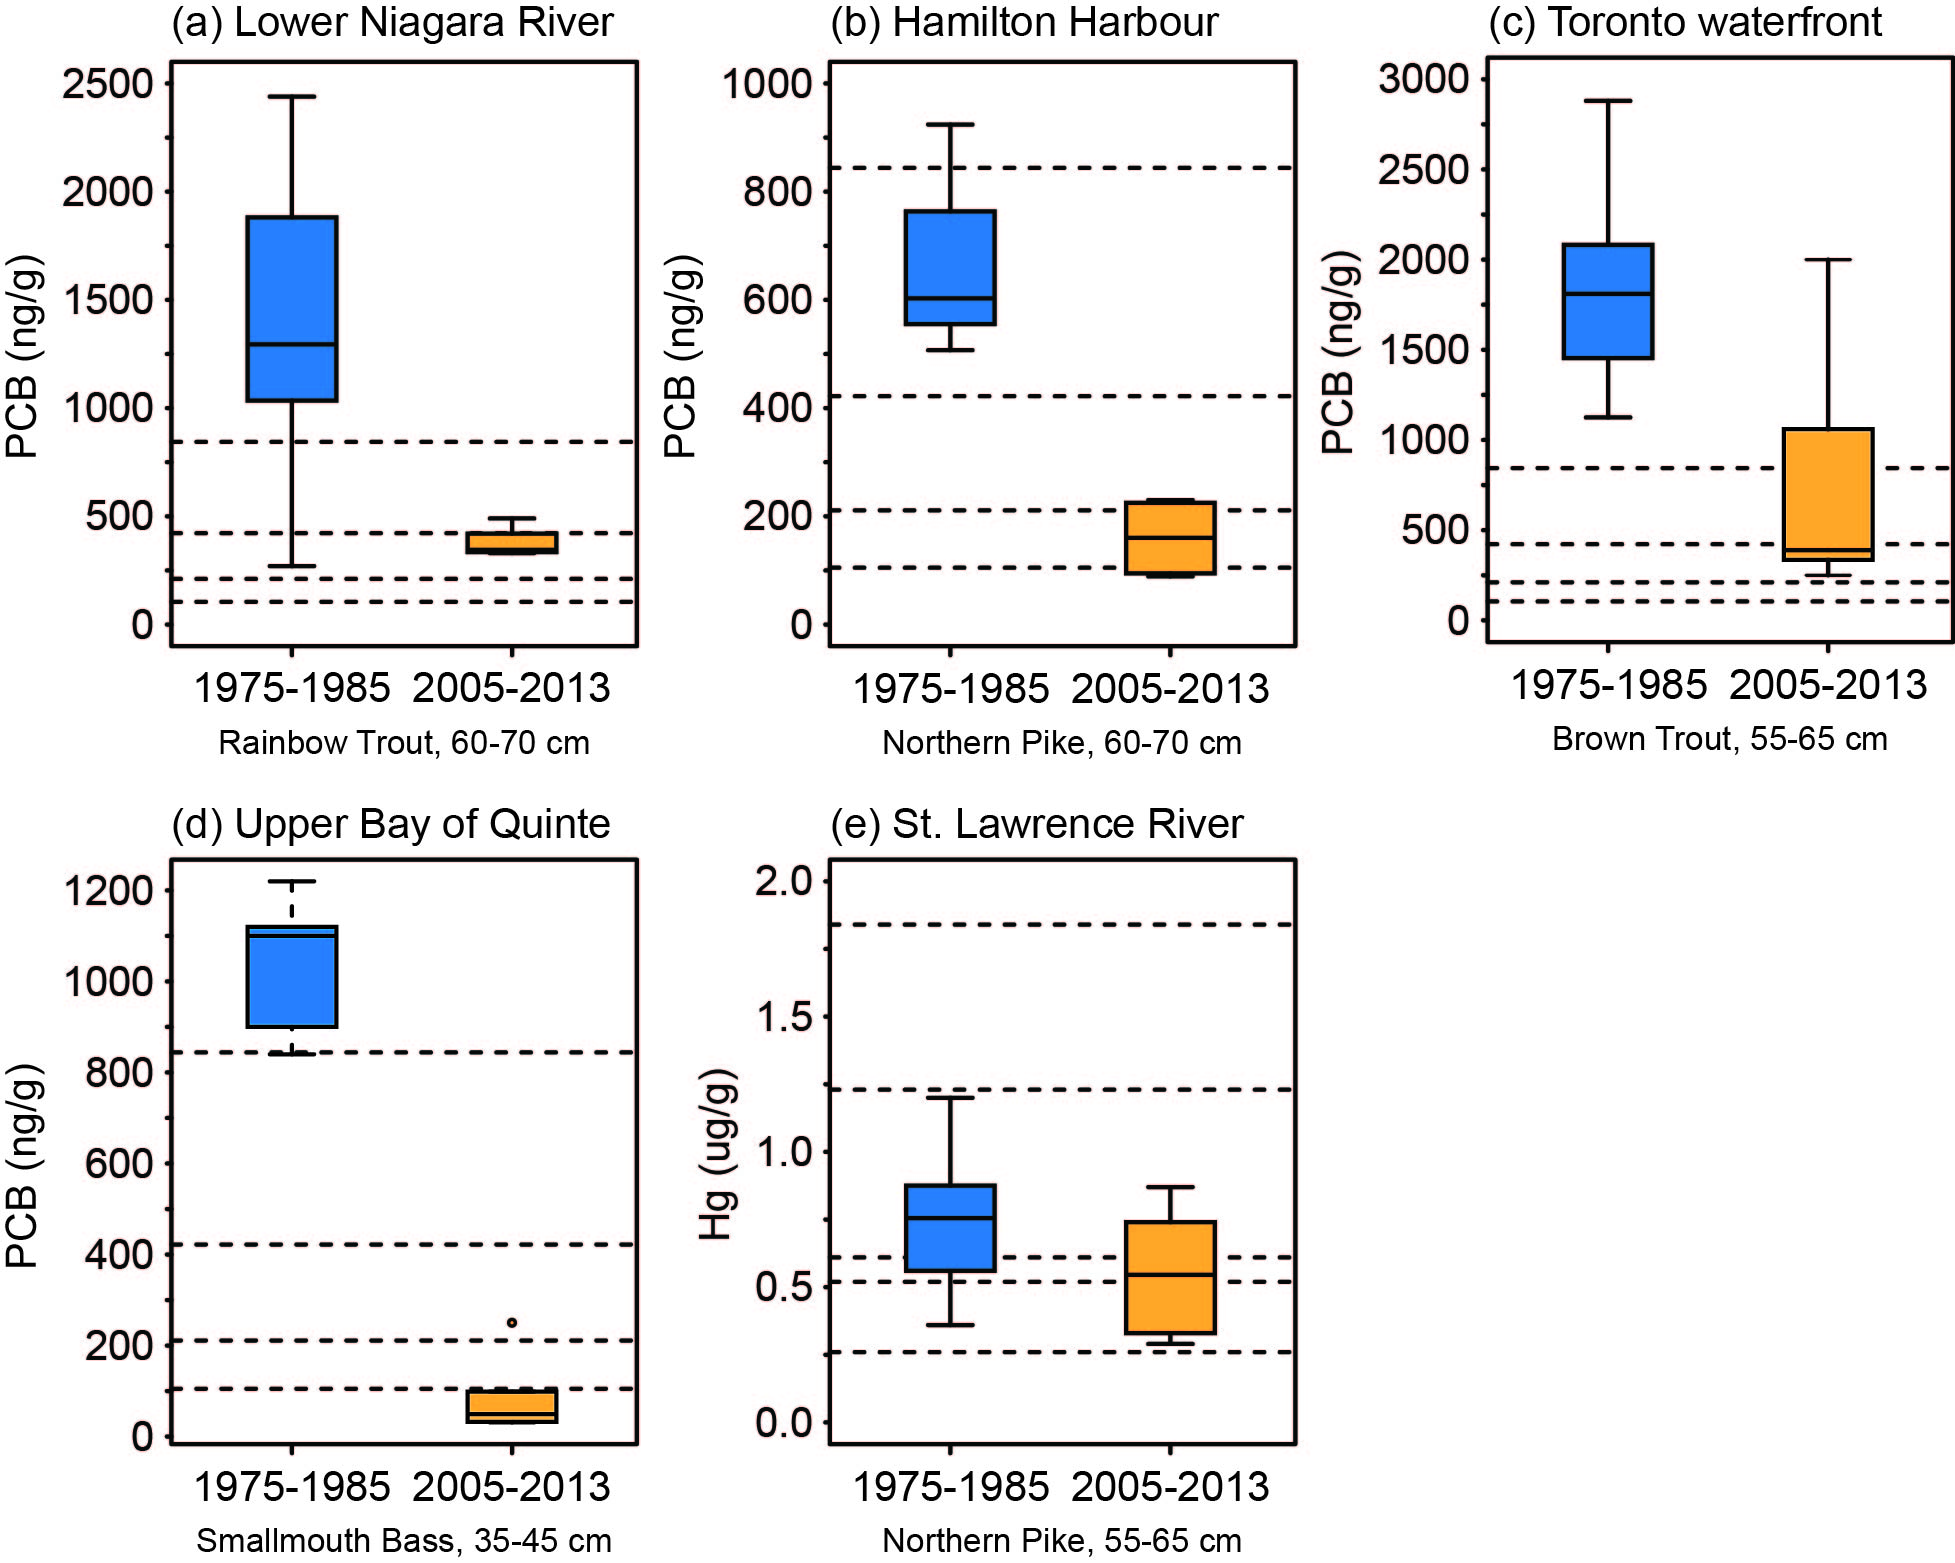
Figure 6: Historical (1975-1985) and recent (2005-2013) PCB or mercury measurements in an indicator fish species for each AOC in Lake Ontario.
These decreases were also seen in a number of other fish species from each of these AOCs. Overall, in the St. Lawrence River, fish mercury concentrations have decreased by 26-61%, depending on the size of fish and the species
Cleaning up Randle Reef in lake Ontario’s Hamilton Harbour area of concern
Randle Reef is an area of contaminated sediment located in Lake Ontario’s Hamilton Harbour Area of Concern. A sediment remediation project is underway that involves constructing an engineered containment facility on top of a portion of the most contaminated sediment, then dredging and placing most of the remaining contaminated sediment in the facility.
The project will address 675,000 cubic metres of sediment which is contaminated with coal tar (polycyclic aromatic hydrocarbons) and heavy metals. It will help prevent these contaminants from spreading throughout the harbour, and in doing so, improve fish health and habitat for local aquatic life. As one of the funding partners for this work, the province is contributing $46.3 million towards the cleanup.
Improvements in water quality in the Niagara River area of concern
The Niagara River is the interconnecting channel between Lake Erie and Lake Ontario, flowing 64 km through both urban and agricultural land (on the Canadian side), and highly industrialized urban centers on the American side (e.g., Buffalo and North Tonawanda).
Numerous persistent toxic contaminants that can accumulate in fish and other aquatic wildlife were released into the Niagara River for decades from waste disposal sites, industrial outfalls, wastewater treatment plants and surface runoff.
In 1987, the Niagara River was designated an Area of Concern on the Great Lakes under the Canada-US Great Lakes Water Quality Agreement. That same year, environmental agencies in Canada and the United States formalized the Niagara River Toxics Management Plan, with an overall goal to lower concentrations of toxic chemicals by reducing inputs from sources along the river.
Using caged mussels to monitor contaminants and track their sources along the river
The ministry has been committed to both routine and specialized monitoring of contaminants in the Niagara River using caged mussels (Elliptio complanata) since 1983. Mussels were routinely deployed on the American and Canadian side of the river and these studies have provided information on suspected and actual contaminant source areas in the river between Fort Erie and Niagara-on-the-Lake
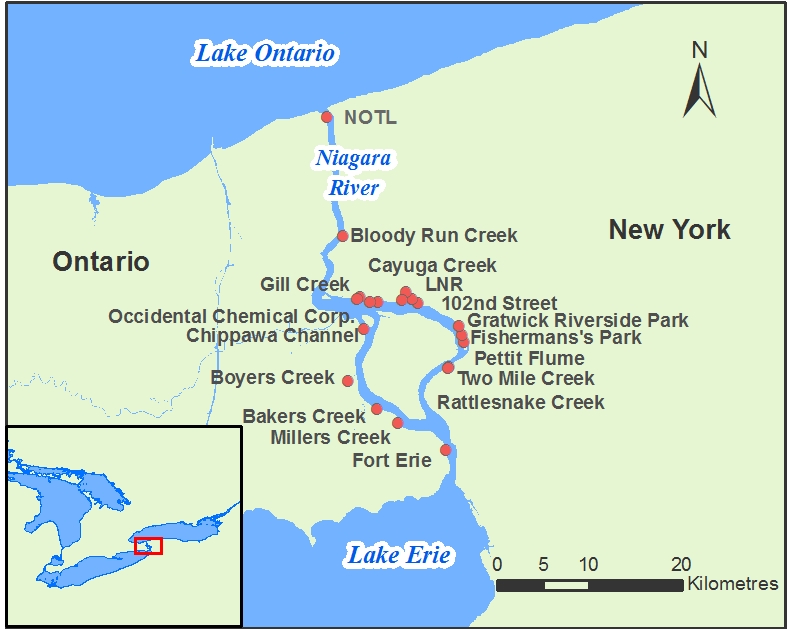
Figure 7: Sampling sites along the Canadian and American side of the Niagara River where caged mussels were deployed.
Identification of the presence of contaminants at many of these source areas has resulted in remedial actions. The principle behind the mussel biomonitoring program is to take mussels from a relatively uncontaminated site in south central Ontario (Balsam Lake) and place them in an environment that is known to be or suspected of being contaminated (i.e., upstream and downstream of outfalls, in the mouths of tributaries, and downstream of hazardous waste sites). The presence of the contaminants in the mussels indicates that these contaminants are present in the water in a form that can be accumulated by aquatic life (bioavailable).
Over 26 years of data from the deployment of caged mussels on the Canadian side of the river suggested that only a few contaminants were bioavailable and at trace concentrations: in particular, the metabolites of DDT. Accordingly, Canadian sources of organic contaminants to the Niagara River have not been identified.
At known contaminated sites on the American side of the river, caged mussels routinely accumulated compounds such as hexachlorobenzene or pentachlorobenzene, PCBs, dioxins and furans as well as organochlorine pesticides (such as isomers of BHC [lindane] and metabolites of DDT and mirex).
In general, there have been decreasing trends in the contaminant concentrations through time at American sites that have been remediated (e.g., PCBs at Gill Creek, Figure 8, and chlorinated benzenes at the Pettit Flume, Figure 9). This decrease has also been found in juvenile fish and fish contaminant tissue concentrations, and in water and suspended sediment samples collected at the head and the mouth of the river
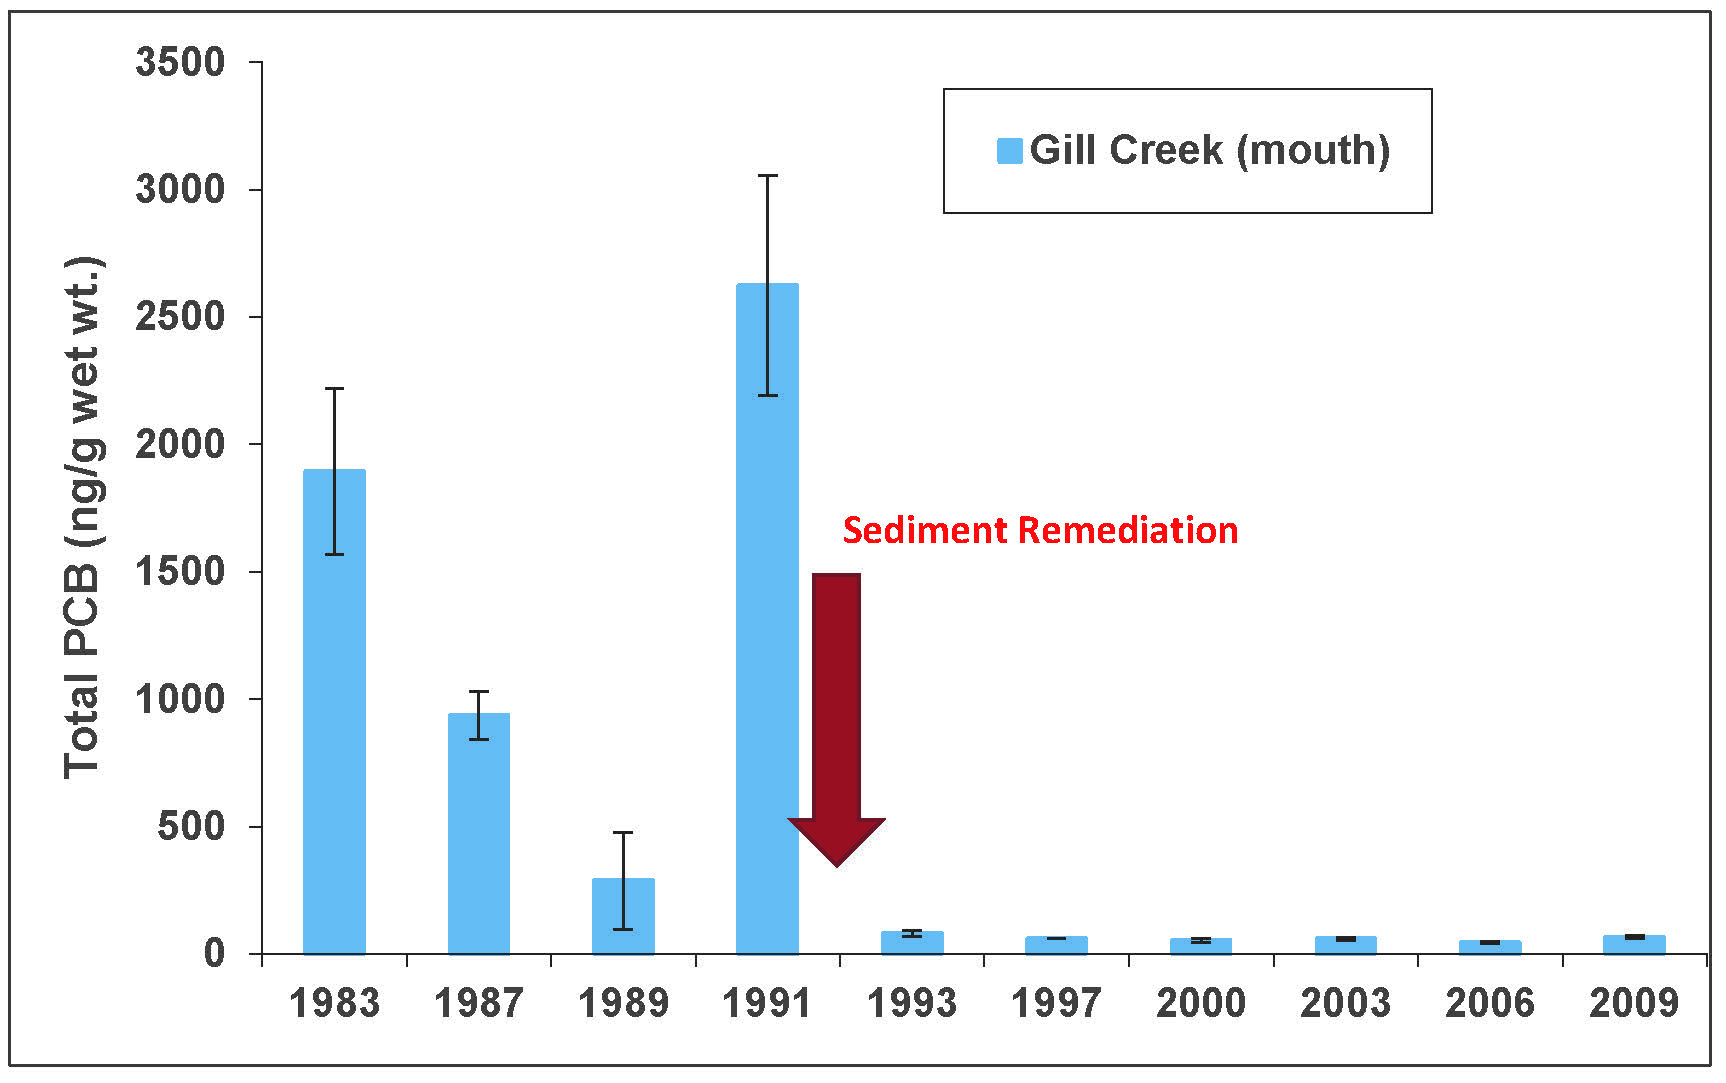
Figure 8: Caged mussel PCB tissue concentrations (ng/g wet wt.) through time pre- and post-sediment remediation of Gill Creek.
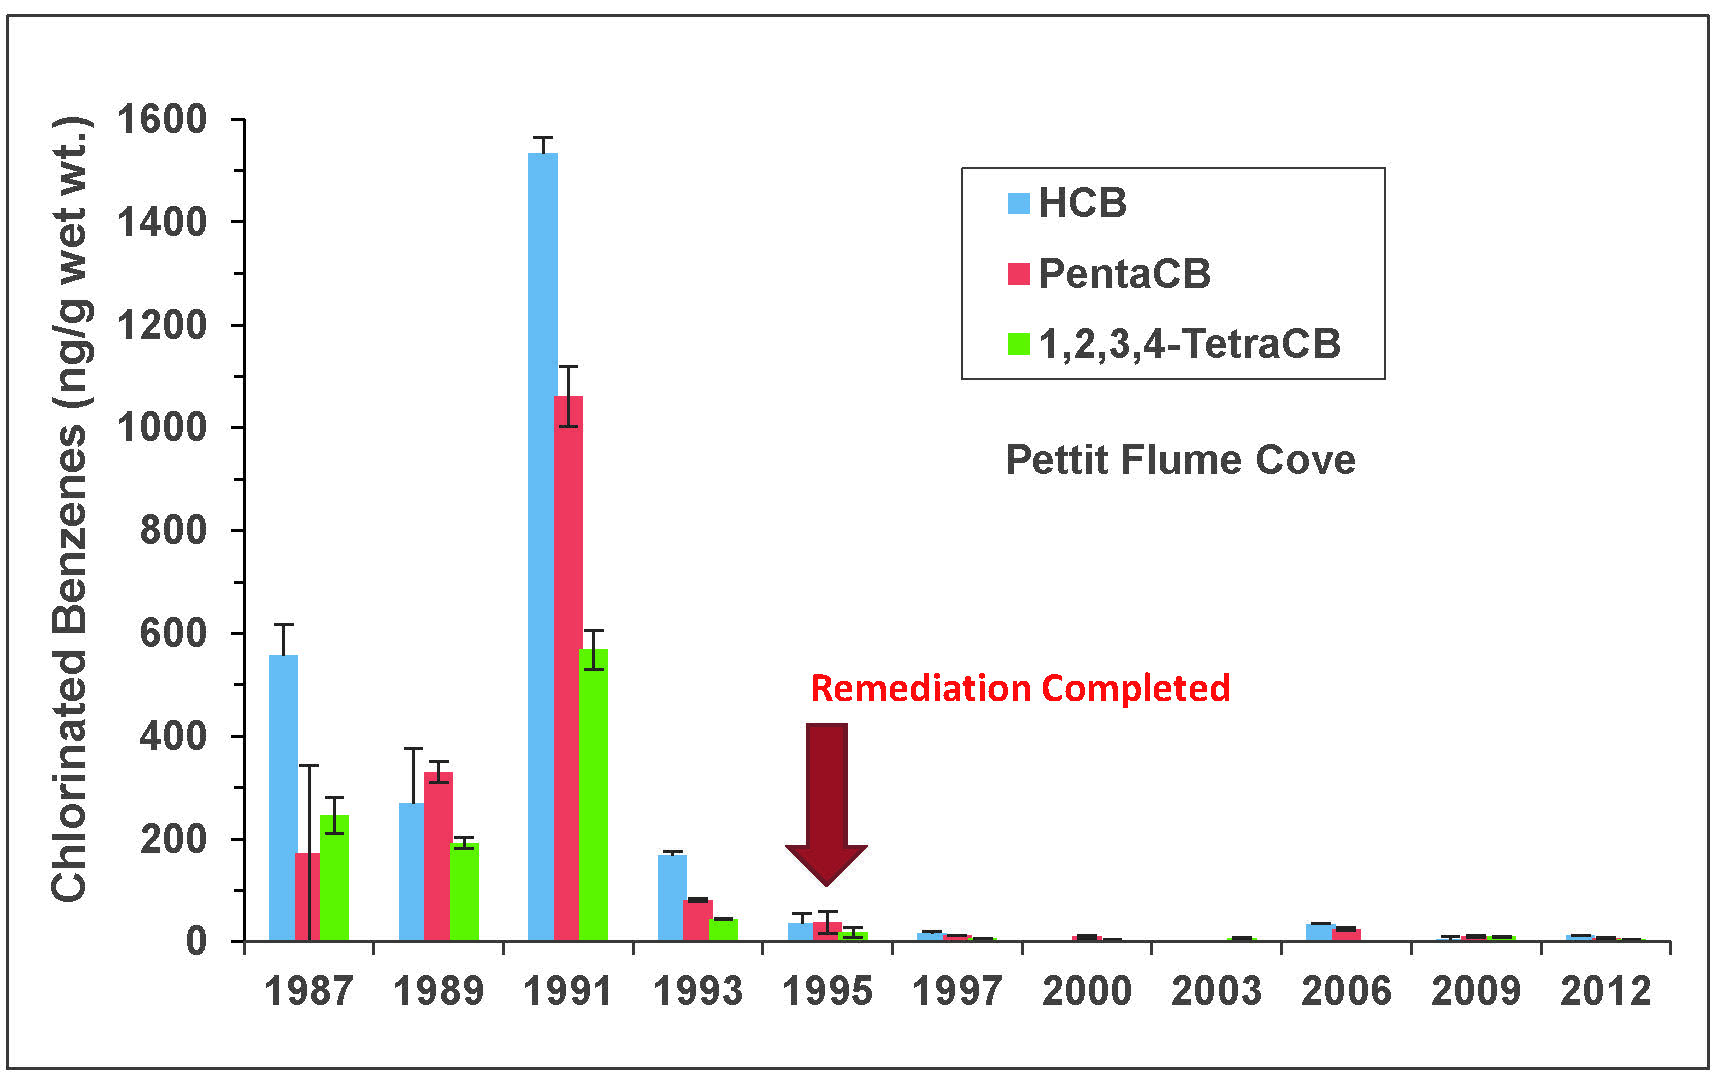
Figure 9: Caged mussel hexachlorobenzene (HCB), pentachlorobenzene (PentaCB) and 1,2,3,4-tetrachlorobenze (1,2,3,4-tetraCB) tissue concentrations (ng/g wet wt.) through time pre- and post-sediment remediation of the Pettit Flume cove.
These data sets all independently corroborate the mussel data, which suggests improving water quality in the Niagara for organic contaminants. Much of this improvement has been due to implemented remedial actions at known sources to the river. Many of these were identified by monitoring with the caged mussels. However, our work is not complete since there are sites on the American side of the river that still require remediation and even sites that have been remediated require long term monitoring to ensure the long term success of the remedial activities. The monitoring of contaminants using caged mussels will continue to be a critical component of the Niagara River Toxics Management Plan.
The data from this study is also available on the OPS Open Data Catalogue.
Restoring lake Superior’s peninsula harbour area of concern
Peninsula Harbour is located on the north shore of Lake Superior near the town of Marathon and about 300 km northeast of Thunder Bay. In 1987, Peninsula Harbour was designated as one of forty-three Areas of Concern (AOC) in the Great Lakes under the Canada-US Great Lakes Water Quality Agreement. The designation was a result of kraft pulp mill and municipal wastewater effluent discharges, as well as log booming activities. The AOC encompasses the entire Peninsula Harbour and a portion of the open Lake Superior south of the Harbour.
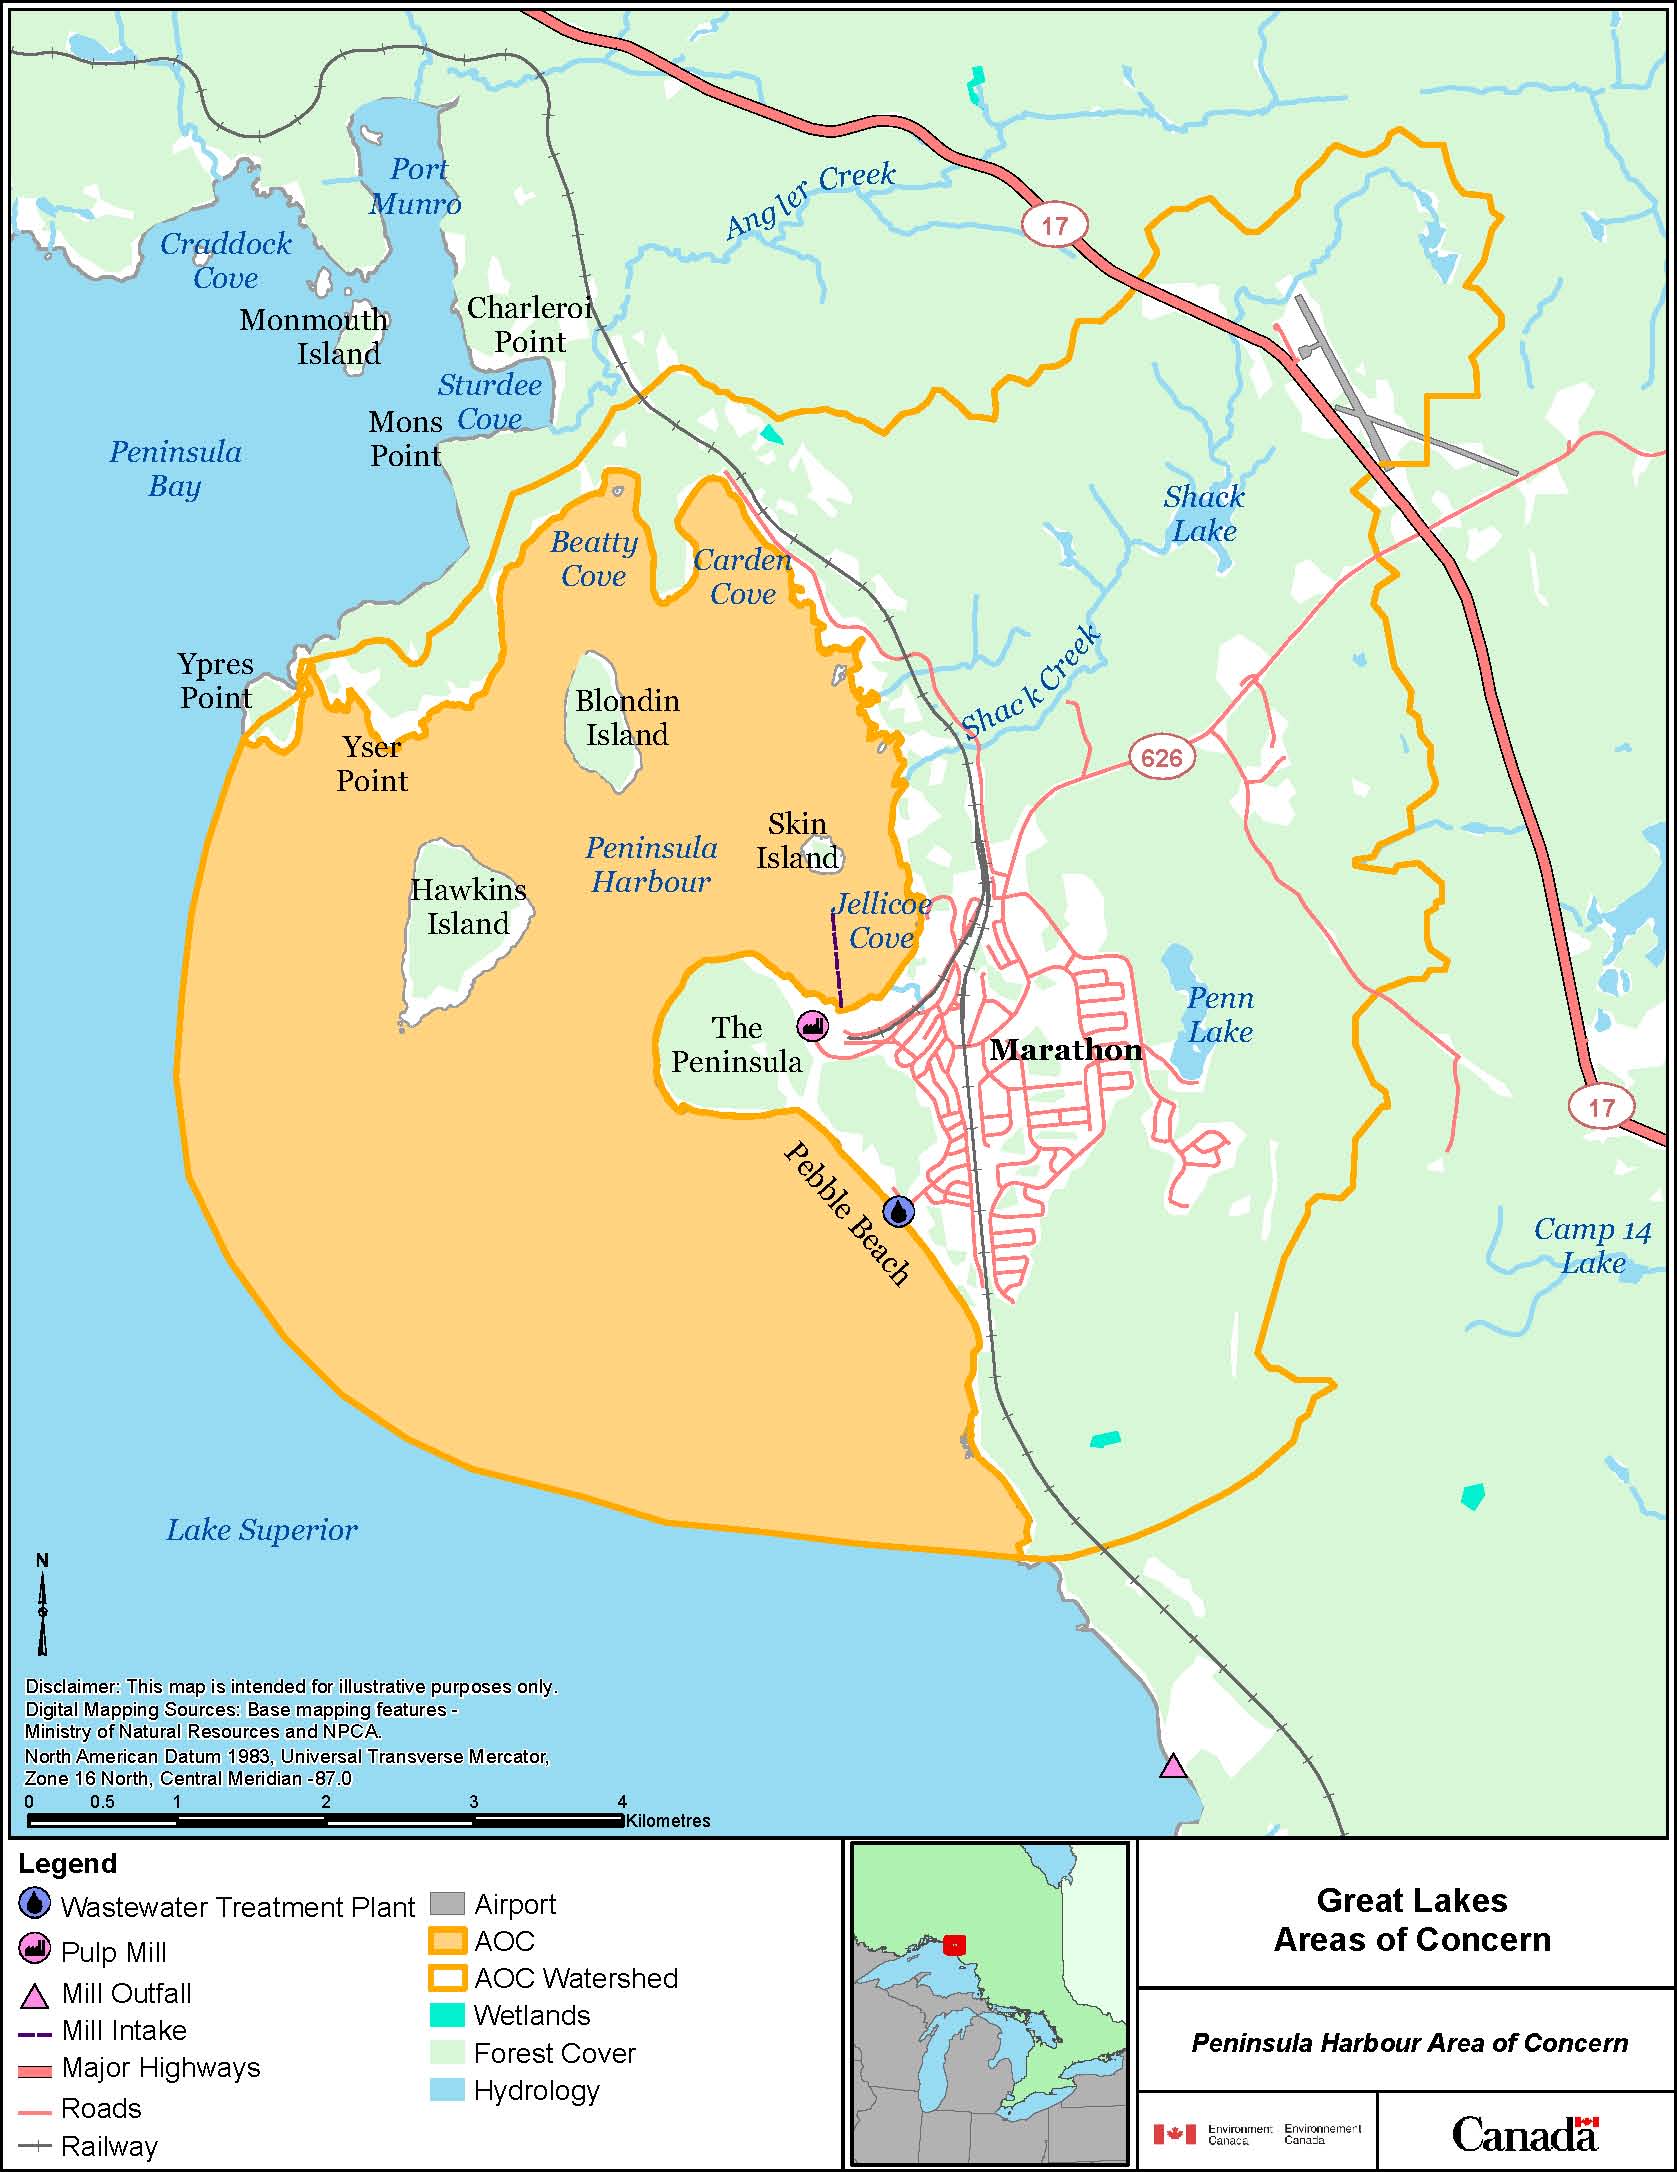
Figure 10: A map of Lake Superior’s Peninsula Harbour Area of Concern. The AOC encompasses the entire Peninsula Harbour and a portion of the open Lake Superior south of the Harbour. Source: © Her Majesty The Queen in Right of Canada, Environment Canada, 2008. Reproduced with the permission of the Minister of Public Works and Government Services Canada.
The sediment in Peninsula Harbour was contaminated with mercury and PCBs. These contaminants were discharged from the pulp mill that operated in the area, which closed in 2009. Loss of fish habitat, low fish populations, impacts to benthos (sediment-dwelling invertebrates), and high concentrations of mercury and PCBs in the sediment and fish has been the result of long-term exposure to these legacy contaminants and historical activities.
An ecological risk assessment was conducted and sediment management options were evaluated to determine the most effective way to manage the contaminated area. Based on the result of these assessments, and consultation with stakeholders and Aboriginal groups, the ministry and Environment and Climate Change Canada determined that a thin-layer cap was the most appropriate option to address the mercury and PCB sediment contamination. Thin-layer capping entails placing a layer of clean sand over the contaminated sediment. The main objectives of this sediment management strategy were to accelerate natural recovery, reduce fish, animal, and plant exposure to contaminants, and to reduce the spread of contaminated sediment.
Capping commenced in May 2012 under the direction of Environment and Climate Change Canada and continued until August 2012. Using a clamshell bucket on a sand supply barge that was directed by GPS, 10 to 20 cm of medium and coarse sand was placed over the most contaminated sediment, which was located in Jellicoe Cove in Peninsula Harbour. The deeper areas outside of Jellicoe Cove were left to recover naturally. Throughout the capping process, water quality was monitored and environmental controls were put in place, including silt curtains to control spread of suspended solids. In total 23 hectares, or the area of 28 football fields, of mercury and PCB-contaminated sediment was capped with clean sand.
The thin-layer capping project was the first of its kind in Canada, and was the last remedial action required in Peninsula Harbour. The project was completed ahead of schedule at a total cost of $7.3 million. Three parties contributed to the funding: Environment and Climate Change Canada ($2.7 million), the province of Ontario ($1.6 million), and the former owners of the pulp and paper mill ($3 million). The contribution of the former mill owners to the remediation project was guided by the ‘polluter pays principle.’
The next step of the sediment management project is to monitor the recovery of the area. A long-term monitoring program was developed by Environment and Climate Change Canada, the MOECC, and the MNRF. Generally, on a six-year cycle, the sediment quality, benthic communities and contaminant levels in benthos and fish will be monitored. Submerged aquatic vegetation and cap movement will be assessed more frequently within the first five years.
Inland lakes
Most of Ontario’s inland lakes are found within the Canadian Shield. This landscape is dominated by thin soils, bedrock and forests. The thin soils and acidic bedrock means that many of the lakes are nutrient-poor and clear. As such, the water quality of many of these lakes is generally good. Rocky shorelines and forest cover also dominate the Shield, increasing the aesthetic appeal of the region and attracting shoreline recreation in the form of cottages and resorts.
Shoreline development, contaminants, invasive species, acid rain and climate change are some key factors affecting inland lake water quality in Ontario.
Reporting on the state of Ontario’s inland lakes
The ministry, with the help of many partners, has been monitoring Ontario’s inland lakes for decades. They monitor the quality of cottage and shield lakes, recovery of acid-rain impacted lakes in the near-north, fish contaminant levels in lakes featuring recreational fisheries, algae and zooplankton, and the structure of benthos communities. The water quality data from inland lakes monitoring are commonly used by the province and its partners to track and report on the state of many of Ontario’s inland lakes. While there isn’t a single report on the state of water quality for all inland lakes in the province, there are individual reports that focus on recreational lakes such as Lake Simcoe, Muskoka lakes and Lake of the Woods. These reports are either led by the ministry or contain data and research findings from the ministry’s monitoring programs. Below are the reports and some of their key findings.
The Ministry’s Lake Simcoe monitoring program
The ministry has a comprehensive water quality monitoring program for Lake Simcoe. It focuses on sources and levels of nutrients, algal productivity and the link to dissolved oxygen levels critical to the objectives of maintaining coldwater fish habitat. The ministry collaborates on many research projects to investigate other stressors affecting the lake such as pathogens, climate change, invasive species and contaminant loads, and it regularly reports on the state of the lake’s water quality. The ministry’s recent Lake Simcoe Monitoring Report, 2014, is available online, and data from the ministry’s Lake Simcoe monitoring program can be accessed on the OPS Open Data Catalogue.
The Minister’s Five Year Report on Lake Simcoe outlines actions taken to address the goals of the Lake Simcoe Protection Plan and summarizes the results of ongoing environmental monitoring in the watershed included in the technical monitoring report.
The multi-agency state of the basin report for the Rainy-Lake of the Woods basin
Monitoring and research of water quality in Lake of the Woods and the Rainy River has been underway for decades by government agencies and academics. Federal, provincial and state agencies work together through partnerships and collaborations to monitor environmental conditions on the lake and river. They also work with academic partners to conduct research in the basin. The ministry’s Lake Partner Program has volunteers submitting samples from various locations in Lake of the Woods to collect information on phosphorus levels and water clarity.
A report compiling monitoring and research results on water quality in the lake and river was first released in 2009. The second and most recent State of the Basin Report, released in 2014, includes the results of monitoring and research that has taken place in the Lake of the Woods and the Rainy River since 2009. Some of the water quality results in the report are from research conducted by ministry scientists in collaboration with academic partners, and ministry staff also served on the report’s editorial board. The report offers a snapshot of water quality conditions in the basin and emphasizes gaps in monitoring, research and reporting. Although some long-term data are available for a few sites in the basin, many new monitoring sites have been added to routinely measure a suite of water quality parameters. As the dataset for the basin grows, the report will likely evolve to include trend information, and thereby show whether conditions are getting better or worse across the basin.
The detailed State of the Basin Report can be found on the Lake of the Woods Water Sustainability Foundation website. Here is a summary of some of the report’s key findings:
Phosphorus loads and algal blooms
- There are increasing concerns about the frequent occurrence of nuisance and harmful algal blooms in the basin, but supporting studies are limited. However, the report refers to preliminary findings showing an increase in chlorophyll concentrations (deposited by algae) in lake-bottom sediments since the mid-1900s, with larger increases since the early 1980s. This may indicate that algal blooms have been worse in the lake in recent decades.
- A study
footnote xxii showed a time-series of intense algal bloom occurrences in the lake over the last decade, with the average monthly bloom extent across as much as 80% of the lake’s surface. Peak bloom years coincided with warm, dry summers. The results suggest that warmer water temperatures affect the intensity and extent of blooms in the lake, and variations in precipitation and associated nutrient loads affect the timing of bloom in Lake of the Woods. - Rainy River is the largest source of phosphorus to Lake of the Woods. Phosphorus loads to the Rainy River have decreased since the 1960s with substantial reductions occurring between the 1970s and 1980s due to actions to reduce phosphorus loads.
- Despite improvements in phosphorus loads from Rainy River, the lake is still affected by historical phosphorus loads because much of the phosphorus that enters the lake is stored in the sediment and can be released back into the water in a process known as internal loading
footnote xxiii .
Contaminants
- Levels of contaminants, including persistent, organic pollutants and pesticides are generally low in the lake. However, the detection of mercury in fish in the lake has resulted in fish consumption advisories. Researchers concluded that mercury in soil and sediments is due to atmospheric deposition and that most mercury in fish is from human sources.
Invasive species
- Over the past five decades, many invasive species have established in Lake of the Woods with almost ten confirmed invaders such as Rainbow Smelt and spiny water flea.
Climate change and changing water levels
- The effects of climate change are already being measured in Lake of the Woods.
Warmer air temperatures in the region have resulted in a longer ice-free period since measurements first began in the 1960s.
- In recent decades, storm events in the region have become fewer but more intense.
- A paleolimnologicalstudy conducted by the ministry, in partnership with researchers at Queen’s University show shifts in algal (diatom) assemblages in response to climate change in the region, with marked changes occurring over the past three decades. The change was concurrent with increases in air temperature and increases in the duration of the ice-free period
footnote xxiv - The effects of water level fluctuations on water quality in Lake of the Woods is a concern especially during peak periods of water use when levels are low and can threaten fish habitat and spawning areas. Extreme weather events associated with climate change are anticipated to lead to even greater challenges with managing water levels in the lake.
The Muskoka watershed report card
The Muskoka Watershed Council routinely releases a Muskoka Watershed Report Card. The report covers all watersheds lying totally or partially within the District Municipality of Muskoka and includes areas in Algonquin Park, the Township of Sequin and the Township of Algonquin Highlands.
The Report Card, using data collected by the District Municipality of Muskoka in partnership with the MOECC Dorset Environmental Science Centre, provides a snapshot of the environmental health of the Muskoka watershed by summarizing measurements of the condition of water quality, natural areas, wetlands and biodiversity across the watershed. The ministry and other agencies provide monitoring data and research findings for the production of the report.
Benchmarks are established specifically for the Muskoka watershed based on the best available science for each health indicator. They are tailored to reflect the health conditions of the Muskoka watershed relative to watersheds in southern Ontario. The report breaks up the watershed into nineteen subwatersheds providing a grade of either “Stressed”, “Vulnerable” or Not Stressed” to each health indicator based on where measurements fall with respect to established benchmarks.
Water quality conditions in the Muskoka watershed are now evaluated based on four main categories of indicators: land, water, wetlands, and biodiversity. Within these categories are indicators such as total phosphorus concentrations, algae (i.e. the propensity for algal blooms to occur based on average total phosphorus levels), calcium levels, presence of invasive species, and fish habitat availability (i.e. percent of the shoreline and shallow water zone in a lake that’s in a natural condition.)
In general, the report states that the Muskoka watershed is in excellent natural condition, with water quality much better than provincial guidelines for recreational use and its wetlands largely intact. However, it cautions that there are already signs of multiple environmental stressors occurring through shoreline development, and other human-related activities within the watershed. Current stresses on lakes in the Muskoka watershed includes increases in nutrients, changes in algal communities, destruction of fish habitat and a decline in calcium levels.
Phosphorus levels
According to the report, 3 of the 19 subwatersheds in the Muskoka watershed were classified as stressed based on total phosphorus concentrations in the lakes and basin. These included Lake Muskoka, Lake Rosseau and the Severn River. However, overall, total phosphorus levels in Muskoka lakes were, on average, moderate and were below levels of concern for aquatic life. Overall nutrient levels in Muskoka lakes have not changed significantly since the 1990s.
Algae
Generally, lakes in the Muskoka watershed do not experience significant numbers of algal blooms. Of the 19 subwatersheds, only one was identified as having the potential for algal blooms. In this subwatershed, Three Mile Lake has phosphorus levels high enough for frequent algal blooms and has recently experienced these events. The Lake Muskoka subwatershed was considered vulnerable to algal bloom occurrences and will continue to be a focus of monitoring efforts.
Calcium cecline
Daphnia are one group of zooplankton that graze the algae found in lakes. Of the many different species of zooplankton, they are particularly efficient grazers and thus are an important member of the aquatic food chain, but they also have considerable difficulty surviving at low calcium levels. As such, lakes can be classified as stressed according to its calcium concentration. 57% of lakes in the Muskoka watershed have a moderately low calcium concentration making their Daphnia populations vulnerable to further declines.
In the Hollow River subwatershed, all 16 lakes were below the calcium threshold for Daphnia. Although this was the only subwatershed classified as stressed, lakes in five other subwatersheds (Lake of Bays, Oxtongue, Mary, Big East and Upper Black) were classified as vulnerable and if present rates of decline continue there is cause for concern that many lakes in these subwatersheds will soon cross the threshold for this key group of grazers.
Fish habitat
Unaltered shorelines, including natural shallow water zones in a lake, are habitat required for fish spawning and nursery areas. A subwatershed is considered stressed if more than half of the shoreline is altered. According to the report, six of the 19 subwatersheds were classified as vulnerable. The report cautions that although shoreline structures haven’t changed between the 2010 and 2014 study periods, the shorelines of large lakes in the watershed are especially vulnerable to the development of increasingly larger docks and boathouses.
Invasive species and changing climate
Invasive species are a threat to lakes in the Muskoka watershed. To date, seven invasive species have established, including zebra mussel, spiny water flea, Rainbow Smelt, goldfish, giant hogweed, purple loosestrife and Eurasian milfoil. 13 of the 19 subwatersheds (68%) are considered stressed by invasive species, while three were classified as vulnerable. The remaining three subwatersheds had no reports of invasive species in the lakes.
Climate change is expected to have a significant impact on the Muskoka watershed within the next 100 years. Climate data shows that the mean air temperature has increased between 1978 and 2013 by about 0.35 degrees Celsius per 10 years, or about one degree Celsius within 30 years. The annual precipitation had a significant decrease during 1978-1998 and then a weak increase during 1999-2013.
The Muskoka Watershed Report Card clearly highlights the increasing complexity of managing water quality and quantity in a world where multiple stressors are simultaneously impacting aquatic ecosystems, and underscores the need for continued monitoring and research efforts to understand and mitigate these effects.
What the Ministry’s water quality in Ontario reports say about inland lakes
The ministry’s Water Quality in Ontario Report provides information on the status of some of Ontario’s inland lakes based on long-term trends and research findings from the ministry’s monitoring programs. The ministry has been monitoring inland lakes in the Dorset and Sudbury Areas for decades. The long-term trends presented in the report tell us whether water quality conditions are getting better or worse in Ontario’s inland lakes. The scientific research highlighted in the report is filling gaps in our understanding of how the lakes are responding to multiple, interacting stressors.
Similar to the other inland lake reports, the findings presented in the Water Quality in Ontario Reports show that there have been some improvements in water quality in Ontario’s inland lakes, but there is still much work to be done to protect the lakes from new and ongoing problems. For example, since monitoring first began, we have seen improvements in levels of phosphorus and mercury in our inland lakes, but new challenges presented by chemicals of emerging concern, invasive species and climate change are getting in the way of present and future progress.
Nutrient and algal issues
- While monitoring shows long-term declines in phosphorus levels in some Ontario lakes since monitoring first began, reports of algal blooms have increased across the province, with cyanobacterial blooms increasing the most (Figure 3.17, Water Quality in Ontario 2012 Report).
- In Lake of the Woods, there has been growing concerns about water quality and the annual appearance of algal blooms. A recent study has identified the key sources of phosphorus to the lake (Figure 3.12, Water Quality in Ontario 2012 Report), with the Rainy River contributing the most phosphorus, followed by atmospheric deposition, smaller streams and runoff. Although there is extensive shoreline development, residential developments were a minor contributor. The pulp and paper mills along the Rainy River were the highest contributors of human activity sources of phosphorus to the lake.
- The first five years of broadscale monitoring of Ontario’s inland lakes shows that all regions in Ontario have a similar pattern with respect to total phosphorus concentrations, with 50% of the lakes having concentrations less than approximately nine micrograms per litre and with 90% of the lakes less than approximately 17 micrograms per litre.
Mercury levels
- Over the last 40 years, mercury emission reductions have lowered mercury levels in fish in northern inland lakes and the English-Wabigoon River system (Figures 4.2-4.4, Water Quality in Ontario 2012 Report).
- While long-term mercury emissions have decreased and mercury levels in fish have declined over the past 40 years, recent analyses suggest mercury levels in some Ontario fish may be increasing. At this time, statistical significance of the apparent increase is hard to determine. The ministry is working with provincial and academic partners to better understand the trends and potential causes for these apparent increases.
Acid rain and calcium levels
- Reductions in the damaging effects of acid deposition have led to the recovery of many lakes in central and northern Ontario. We have seen dramatic improvements in the Sudbury region with decreases in lake metal levels (Figure 4.7, Water Quality in Ontario 2012 Report) following reductions in emissions from metal smelters.
- Calcium levels in Ontario’s inland lakes are declining due to acid rain and timber harvesting and regrowth (Section 6.3, Water Quality in Ontario 2012 Report). This drop in calcium levels has resulted in a decrease in calcium-rich zooplankton populations in our inland lakes. Zooplankton are important parts of the aquatic food chain. The ministry has increased its monitoring of calcium levels to better understand the impacts of changing calcium levels.
Multiple stressor effects on inland lakes
- The cumulative effects of these and other stressors pose a significant threat to Ontario’s inland lakes and the socio-economic resources they provide. Although water quality in many areas of the province is very good, many different parameters (see above) are changing substantially and this is coinciding with a changing climate. How these changes will interact to affect water quality and quantity is difficult to predict and is an active area of research for the province.
- Ontario’s inland lakes are increasingly threatened by multiple, often simultaneous, stressors. Long-term monitoring and research by the ministry has been crucial for identifying these stressors and their impacts on lake ecosystems. The ministry’s on-going efforts will help to protect Ontario’s aquatic resources.
Climate change
- In inland lakes in south-central Ontario, climate change has been linked to warming lake water temperatures and changes in lake mixing, which may be causing lake waters to remain stratified for longer periods of the year and increasing the growing season for algae. Read more about the effects of Climate Change on inland lakes.
- In some inland lakes, warmer air temperatures have resulted in a shorter ice-cover season (Figures 5.2a and 5.2b, Water Quality in Ontario 2012 Report). Given the complexity of aquatic ecosystems, these changes in ice conditions will affect lakes in different ways.
- Climate change is partially contributing to calcium decline in inland lakes. For example, in central Ontario, decreases in stream calcium and stream discharge have contributed to calcium decline in Red Chalk Lake. The decrease in stream discharge is caused by reduced precipitation and warmer air temperature associated with a changing climate.
Experimental lakes area
The Experimental Lakes Area (ELA), operated by the International Institute for Sustainable Development with funding from the province and a host of private donors, is a unique facility operated for specialized purposes. Located outside of Kenora in northwestern Ontario, it features a series of lakes where deliberate whole-lake experimentation can be carried out to observe, in a controlled fashion, the impacts of environmental perturbations.
ELA studies have led to breakthroughs that have helped the world understand and address many environmental concerns including:
- understanding the role of acid rain in lake acidification;
- phosphorus as the principle cause of lake eutrophication and blue-green algal blooms;
- fish farming (aquaculture) as a major source of excessive nutrient that promotes excessive plant and algal growth, the subsequent depletion of oxygen levels and loss of key members of the aquatic food web;
- the deposition and movement of mercury in watersheds; shedding light on its migration from wetlands to overland areas and into the lakes and eventually fish; and
- ecosystem impacts of synthetic estrogens that make up birth control pill active ingredients, in particular, the negative effects on fish populations including the “feminization” of male fish and altered egg production by female fish.
Recently, Trent University has completed field work on a unique experiment to explore the implications of nano-silver (LENS or Lake Ecosystem Nano-Silver project), which is deliberately applied to athletic clothing and other garments to control odor, and which is washed out of the materials and discharged into our waterbodies and septic tanks when clothes are washed. ELA provided a set of paired lakes where natural conditions could be observed in a control lake and where a concentration gradient of nano-silver could be generated in the experimental lake and the impacts on microbial and aquatic ecosystems assessed. Importantly, the recovery time of the lake after the additions were ended can be assessed, which provides valuable information on the latency of impacts. The outcome of these experiments will become part of several M.Sc. and Ph.D. graduate theses’, be published in the peer-reviewed literature, and contribute to the body of knowledge about whether actions need to be taken to assess and/or mitigate the environmental impacts of these types of compounds.
Monitoring to determine the state of water quality in Ontario’s inland lakes
Water quality results from broadscale monitoring of Ontario’s inland lakes
In 2005, Ontario implemented its Ecological Framework for Recreational Fisheries Management, a component of which was the establishment of standardized, long-term monitoring of the province’s fisheries resource, referred to as Broadscale Monitoring (BSM). The BSM program was initiated in 2008, with the aim of collecting detailed fisheries and water quality information on a five-year cycle from hundreds of lakes across the province. In 2012, the first BSM cycle was completed, with more than 800 lakes sampled from southwestern Ontario to the Ontario-Manitoba border, and to within 100 km of the Hudson Bay coast.
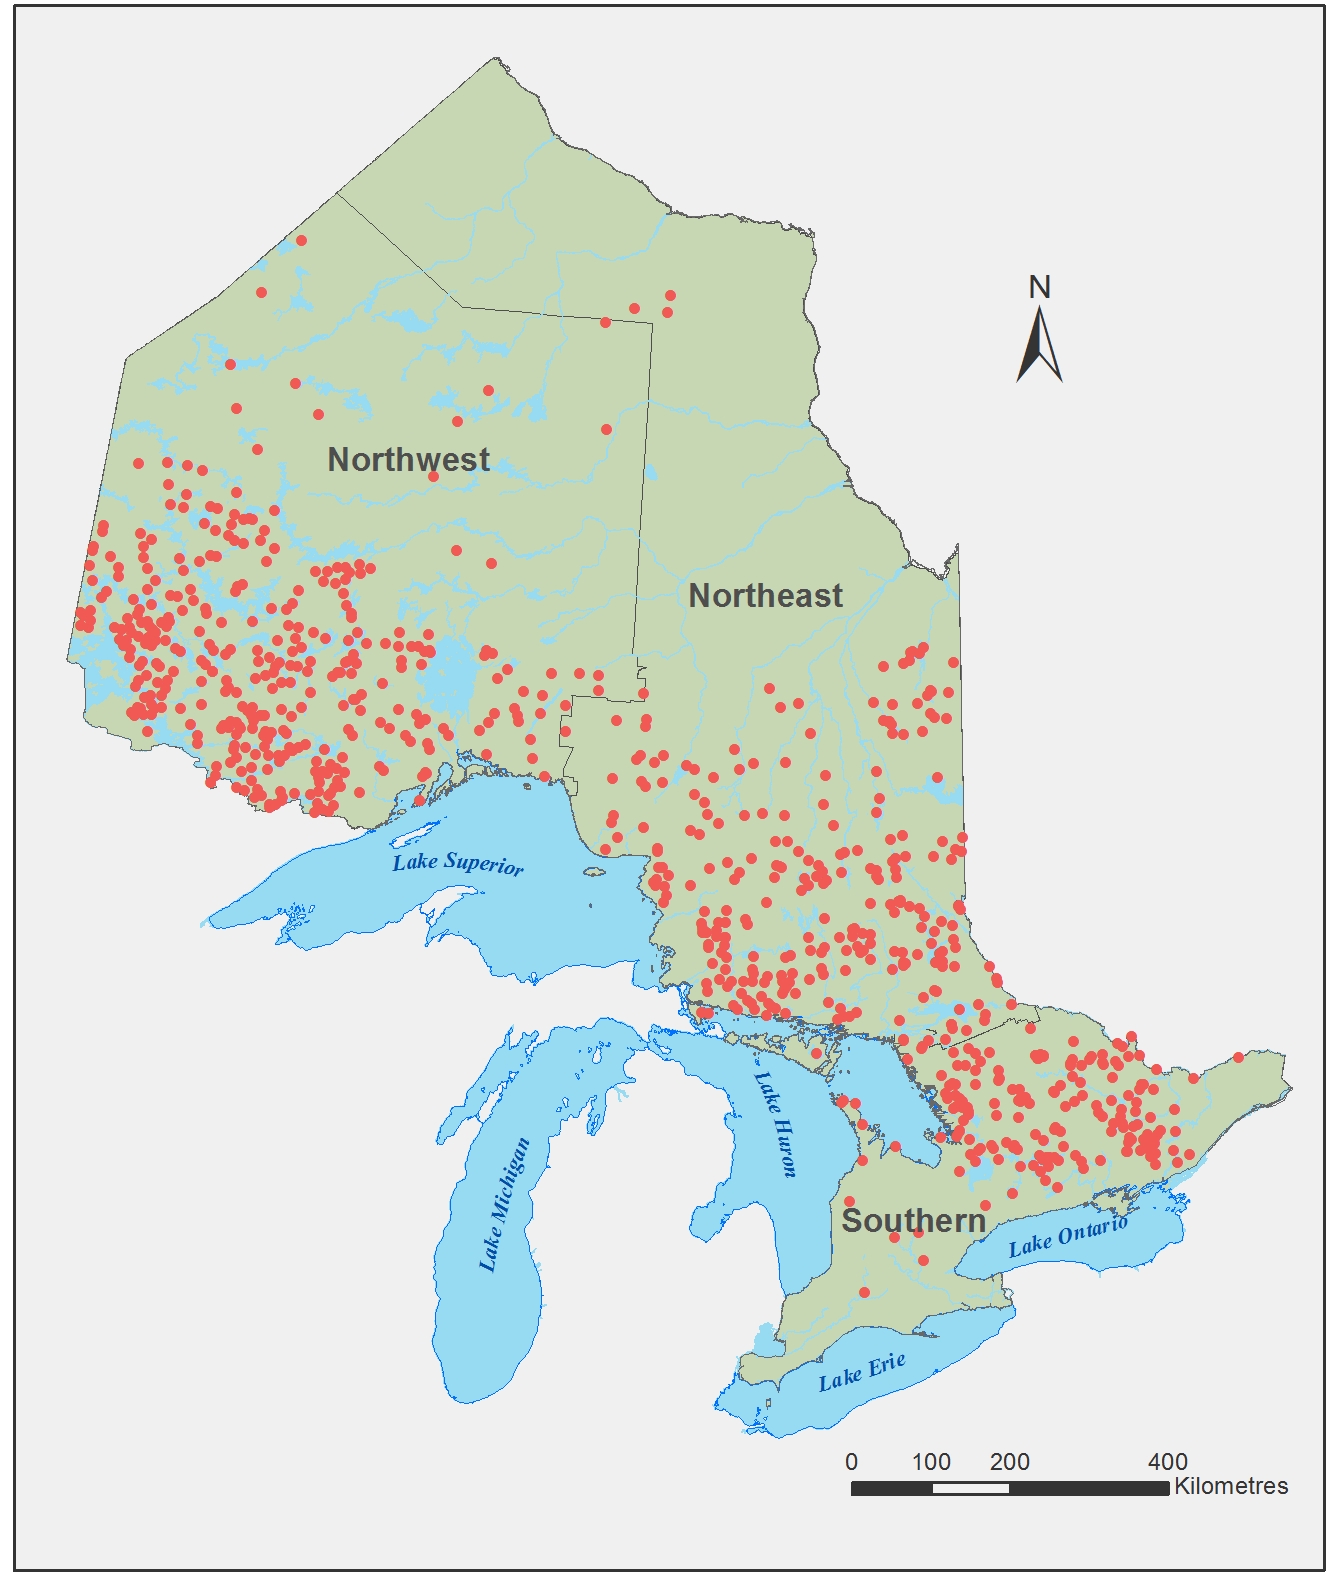
Figure 11: A map of Ontario showing the location of BSM lakes sampled during the first cycle (2008-2012). Three MNRF regional boundaries are also shown on the map (i.e., northeast, northwest and south).
In addition to gathering detailed biological information from every lake, field staff from the MNRF collected water samples for chemical analyses. These samples were analysed at the Dorset Environmental Science Centre (DESC) using standard analytical methods, and the data are stored in the ministry’s water quality database. The BSM water quality data set is generated as a partnership between the MNRF, MOECC, and the Federation of Ontario Cottagers’ Associations.
The following summary of the water quality results from the first BSM cycle focuses on four key parameters (concentrations of total phosphorus, dissolved organic carbon, calcium, and chloride), and uses cumulative frequency plots (Figure 12) to characterize the distribution of each parameter across the BSM lakes. The results are shown for all lakes with water quality data (826 lakes), and separately for lakes within the northeast (292 lakes), northwest (346 lakes), and southern (188) MNRF regional boundaries.
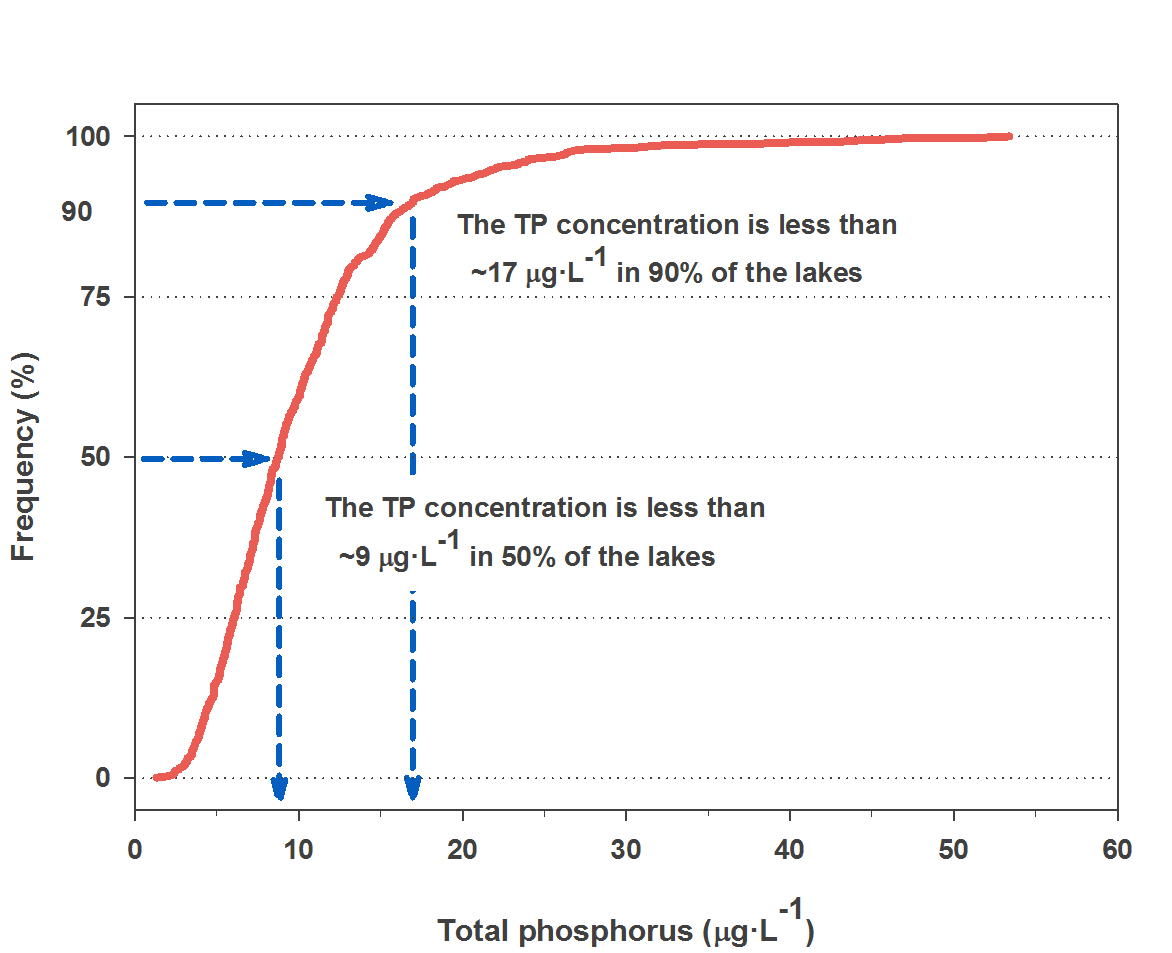
Figure 12: Cumulative frequency plots are commonly used to illustrate how water quality varies across many lakes in a landscape. The above example shows that 50% of the lakes in the Broadscale Monitoring (BSM) data set have total phosphorus concentrations (TP) less than approximately 9 micrograms per litre (μg/L). Similarly, 90% of the lakes have TP concentrations less than approximately 17 μg/L. From 2008 to 2012, the highest TP recorded in any lake in the BSM data set was 53 μg/L.
In Figure 13, shown below, frequency plots for all lakes, and separately for lakes in northeastern, northwestern and southern Ontario, are shown for TP, dissolved organic carbon, calcium, and chloride concentrations.
- Total phosphorus (TP): Phosphorus is an essential element in aquatic ecosystems, necessary for plant and algal growth and microorganism activity. However, levels in the environment may be increased by human actions, and too much phosphorus may lead to enrichment or eutrophication in lakes. In turn, this may lead to excessive plant or algal growth, and subsequent loss of deepwater oxygen in some lakes. In the BSM data set, all regions show a similar pattern within respect to TP concentrations, with 60% of the lakes having concentrations at or below 10 μg/L, the concentration at which a high level of protection against aesthetic deterioration is provided. Considering all lakes, only seven % of the lakes in the BSM data set have TP concentrations more than 20 μg/L , the level above which nuisance concentrations of algae are more common (Figure 13a). The vast majority of the BSM lakes are located within the Precambrian Shield, and the relatively low TP concentrations in these lakes reflect low, natural TP inputs that are typical of shallow, acidic, nutrient-poor soils on the Shield. The higher TP concentrations observed in some waterbodies may reflect higher natural inputs to lakes within wetland-dominated catchments (more common in the NE and NW regions), or lakes near urban areas or intensive agriculture, where they are likely to receive higher inputs from human activities (e.g., nutrients from fertilizer use, stormwater runoff).
- Dissolved organic carbon (DOC): Dissolved organic carbon is an important substance in lakes, commonly originating from wetlands within lake catchments. DOC plays many roles, and is an important physical and chemical regulator in lakes. As carbon is a basic building block of life, DOC fuels aquatic food webs. DOC gives some lakes its tea-like colour; it controls light quantity and quality in lakes, and protects organisms from harmful UV light. In the BSM data set, in contrast to TP, DOC concentrations show clear differences across regions (Figure 13b), with much of this variation occurring naturally. In boreal lakes in northern Ontario, wetland-dominated catchments are common, leading to higher average inputs of DOC, and consequently higher concentrations within these lakes. On average, lower concentrations of DOC were found in the south MNRF region, with the lowest concentrations recorded in slightly acidic lakes with thin soils and rocky outcrops within their catchments (near Parry Sound and Bancroft, Ontario).
- Calcium (Ca): Calcium is an important cation in many aquatic ecosystems, as it is required, to varying degrees, by all living organisms. As described in the Water Quality in Ontario 2012 Report, significant declines in calcium concentrations have been recorded in lakes within the Precambrian Shield over the past two decades, with levels in some lakes now nearing, or having crossed, critical thresholds for calcium-rich aquatic organisms. The BSM data set shows generally higher Ca concentrations in lakes in the southern MNRF region (Figure 13c), largely because of their position within calcareous soils off the Precambrian Shield, or in the transitional region zones at the southern and eastern fringes of the Shield. Although calcium concentrations are generally lower in both of the northern regions, some lakes with moderate to high Ca concentrations were found in the northeast region, particularly near Wawa, Ontario, where significant beds of carbonate rock exist. In the BSM data set, fewer than two % of the lakes had calcium concentrations less than 1.5 mg·L-1, a level below which calcium-rich zooplankton have been shown to be negatively impacted, although this number is expected to increase as calcium concentrations continue their decline.
- Chloride (Cl): Chloride is an essential element that comes naturally from the weathering of rock. Cl salts are poorly retained in soil, and so move readily to aquatic ecosystems. Cl may also be elevated in some lakes as a result of inputs from road salt, and to a lesser extent, dust suppressant. In all regions in the BSM data set, the lakes with the highest Cl concentrations (Figure 13d) are commonly situated near urban centres, adjacent to major highways. Because of the higher population and road densities, Cl concentrations are generally higher in the MNRF southern region, and long-term studies of water quality in lakes from south-central Ontario show that concentrations have increased over the past four decades. However, currently no lake in the BSM data set has Cl concentrations higher that the Canadian Water Quality guideline for chloride in freshwaters (120 mg·L-1).
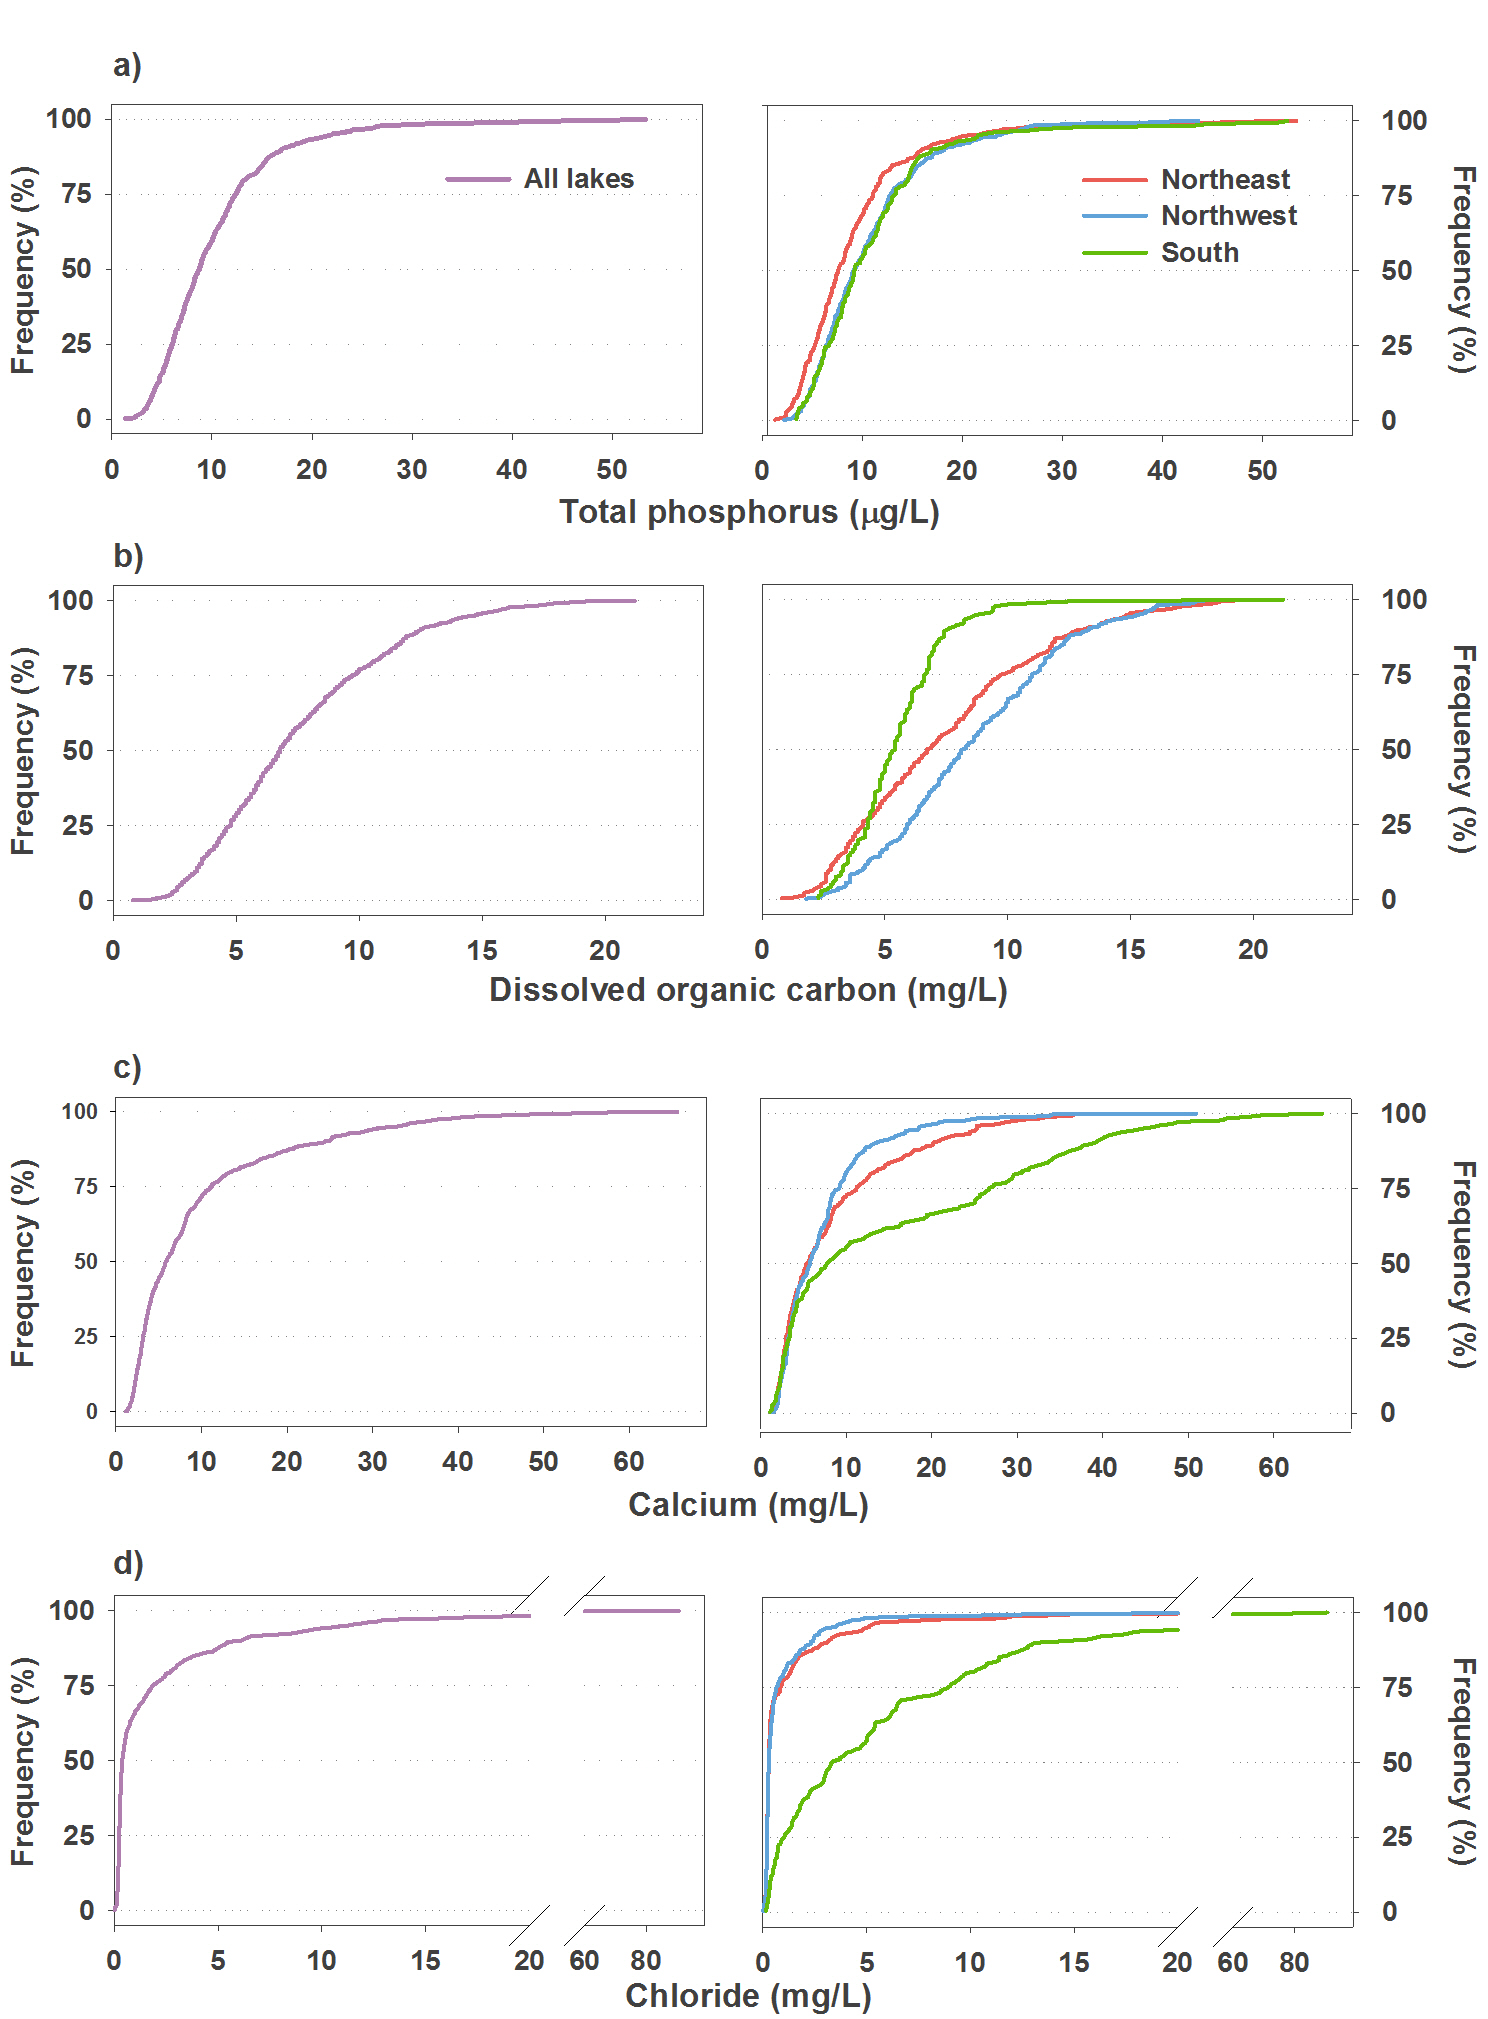
Figure 13: Cumulative frequency plots showing the distribution of key water quality parameters across the BSM lakes. The parameters include concentrations of: a) total phosphorus; b) dissolved organic carbon; c) calcium; and d) chloride. Distributions are shown for all lakes (left panels), and separately for lakes within the northeast, northwest, and south MNRF regional boundaries
As the BSM lakes are re-visited in subsequent cycles, an invaluable temporal data set will be built. This data set will provide physical, chemical and biological information that will strengthen fisheries management in Ontario, and improve understanding of the impacts of multiple stressors, including climate change, on lakes throughout Ontario. Although the program favours larger lakes that support recreational fish, the BSM data set is the only province-wide sampling program for inland lakes that includes a full suite of water quality parameters.
Multiple stressor impacts on inland lakes
Inland lakes play an important role in Ontario’s communities, including First Nations and Métis communities, and economy. For example, they provide drinking water, support recreational, commercial and agricultural activities, contribute to local economies and jobs, and also are culturally important to Indigenous peoples’ traditional way of life. Human use of Ontario’s inland lakes is increasing and most lakes are subject to multiple stressors. The ministry is working to better understand how these stressors are impacting our inland lakes. This knowledge is needed to support the conservation of our invaluable aquatic resources for future generations.
One example of an area of the province where multiple stressors are being studied is south-central Ontario (Figure 14). Although water quality is generally quite good in this region, monitoring and research on lakes in this area show that human activities have significantly altered lake environments. Climate change has been linked to warming lake water temperatures and changes in lake mixing
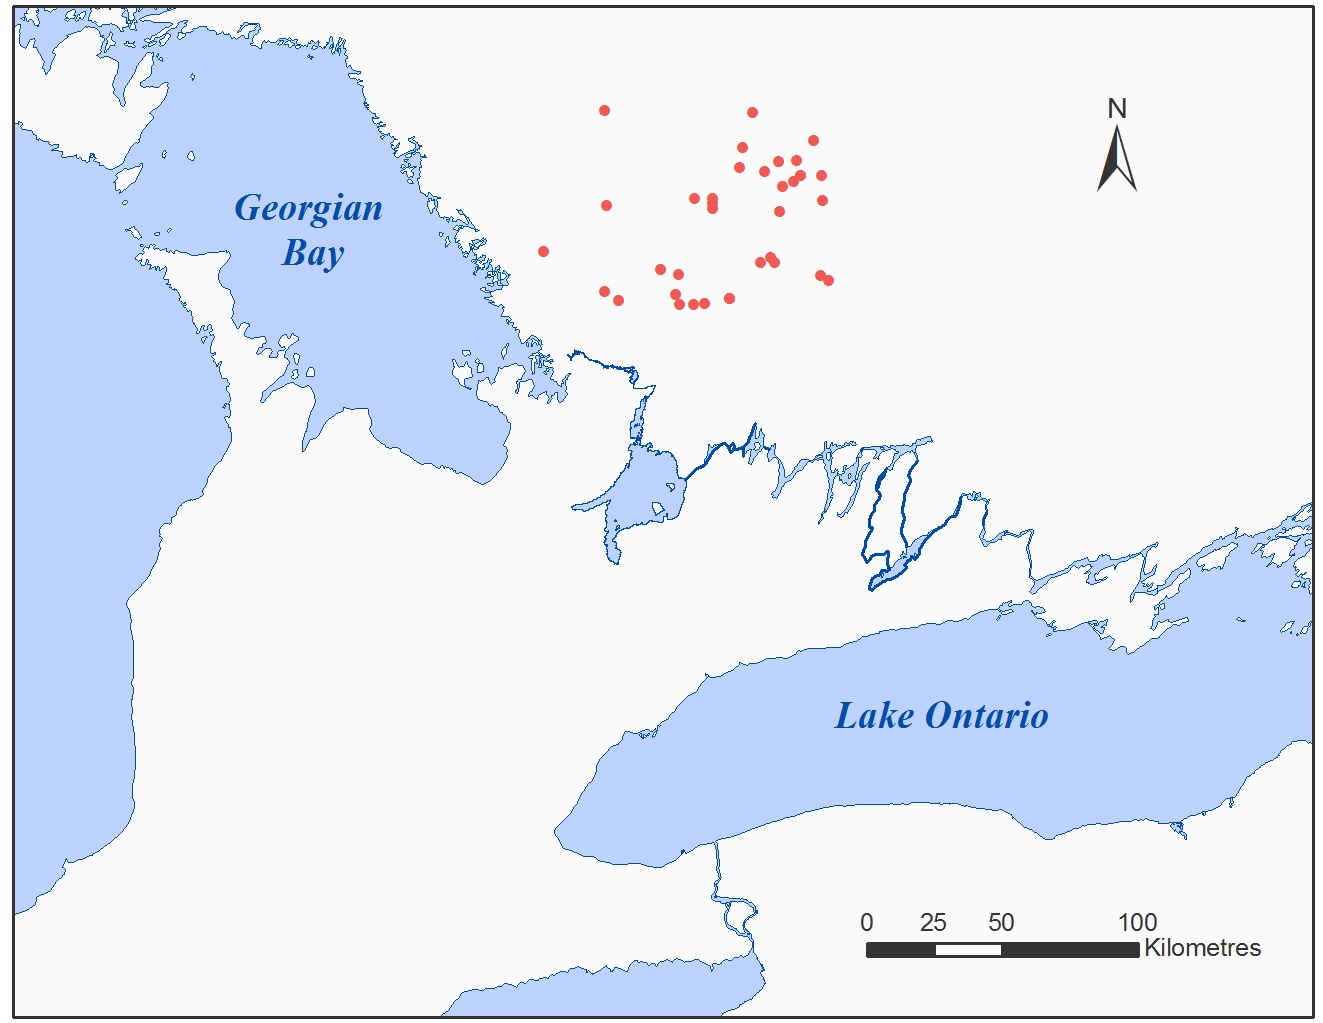
Figure 14: A map of south-central Ontario showing the locations of the study lakes.
Legislation in the 1980s to reduce acid rain has led to improvements in lake acidity. However, lake acidity has not decreased as much as expected because calcium and magnesium, which help to reduce lake acidity, have decreased. The loss of these cations is partly due to forest growth and harvesting and long-term acidification of the land around the lakes, both of which can remove ions from the soil and thus reduce the amount entering the lakes. The combination of changing acid deposition and climate may be contributing to additional changes in lake water quality, including decreases in phosphorus and metals and increases in ammonia and dissolved organic carbon. Sodium and chloride levels in the lakes have also increased over time, likely due to increased development and the use of road salt to maintain roads during the winter.
In turn, these changes in lake temperature and water quality, as well as invasion by the exotic predator Bythotrephes longimanus (the spiny water flea), have altered the biota in the lakes, including the zooplankton
Changes in the zooplankton were often due to a combination of stressors, highlighting the need to consider all stressors impacting a system when assessing biological response to human activities. For example, improvements in lake acidity and changes in nutrients and lake water temperature collectively contributed to increases in the diversity and number of zooplankton taxa. However, these increases did not occur in lakes that were invaded by the spiny water flea. The spiny water flea selectively feeds on certain types of smaller zooplankton, which reduces or removes them from the community and reduced the overall diversity of the zooplankton. Shifts in the zooplankton community following invasion by the spiny water flea may also affect the biomagnification of contaminants up the food web, which could lead to higher contaminant levels in fish
Ontario’s inland lakes and the socio-economic resources they provide are increasingly threatened by multiple, often simultaneous, stressors. Long-term monitoring and research by the ministry has been crucial for identifying these stressors and their impacts on lake ecosystems. The ministry’s on-going efforts will help to protect Ontario’s aquatic resources.
Climate change effects contribute partially to calcium decline in lakes
As a basic mineral in ecosystems, calcium has declined in inland lakes and streams over the past four decades, and fallen below or near a critical threshold level of 1.5 mg/L in a number of headwater lakes. The Water Quality in Ontario 2012 Report described three main factors contributing to the calcium decline:
- historical acidification (1950-70s) increased chemical-leaching rates from the soils and depleted the terrestrial storage pool in catchments. The depleted calcium pool has not yet recovered;
- atmospheric deposition of strong acids decreased in recent decades (1980-2000s) as a result of reduced sulfur dioxide (SO2) emissions, reducing the calcium leaching rate from catchments and the supply rate to lakes. Calcium deposition from the atmosphere also declined during that period; and
- logging and subsequent re-growth of forests in lake catchments removed calcium from the catchments and soils.
These factors influence calcium concentrations in soil, vegetation, streams and lakes, and offer reasonable explanations for the observed calcium declines in lakes. Moreover, recent analysis indicates that the long-term hydrological change, induced by climate variability, has also contributed to calcium decline.
The inflow load (mainly from streams entering a lake) and outflow export leaving a lake regulate the calcium concentration in the lake. Seasonal or inter-annual changes in lake calcium concentration are driven by the temporal changes in stream load. The stream load depends on two equally important factors: 1) The calcium concentration of stream water and 2) the stream water discharge reaching a lake. Indeed, a decrease in stream calcium concentrations would contribute to calcium decline in lakes. Similarly, a decrease in stream discharge would also contribute to calcium decline in lakes. To understand how much these factors influence calcium decline in inland lakes, the ministry used its long-term monitoring data from Red Chalk Lake in central Ontario.
Monitoring results for Red Chalk Lake showed a clear decline in calcium from 1978 to 2006 (Figure 15). The annual discharge from five inlet streams varied irregularly over the same period with a decreasing trend (Figure 16). Based on this trend line, the discharge decreased from 80.1 litres per second (L/s) to 60.7 L/s, or a 24.0% overall drop in 28 years. The annual-mean calcium concentration of the streams decreased from 3.2 mg/L to 2.2 mg/L (along the trend line in Figure 16), or a 31.3% drop. As a result of decreases in stream discharge and concentration, the calcium load decreased significantly, from 7299 to 3920 kg/year or a 46.3% drop, as seen in Figures 15 and 16. Correspondingly, the lake calcium concentration decreased from 2.7 to 2.1 milligrams per litre (mg/L) or a 22.2% drop. As a simple and direct assessment, the relative contributions to the decline in calcium levels by changes in discharge and stream calcium concentration are expressed as: 24% / (24%+31%) = 0.436 (44%) for the discharge, and 31% / (24%+31%) = 0.564 (56%) for the concentration
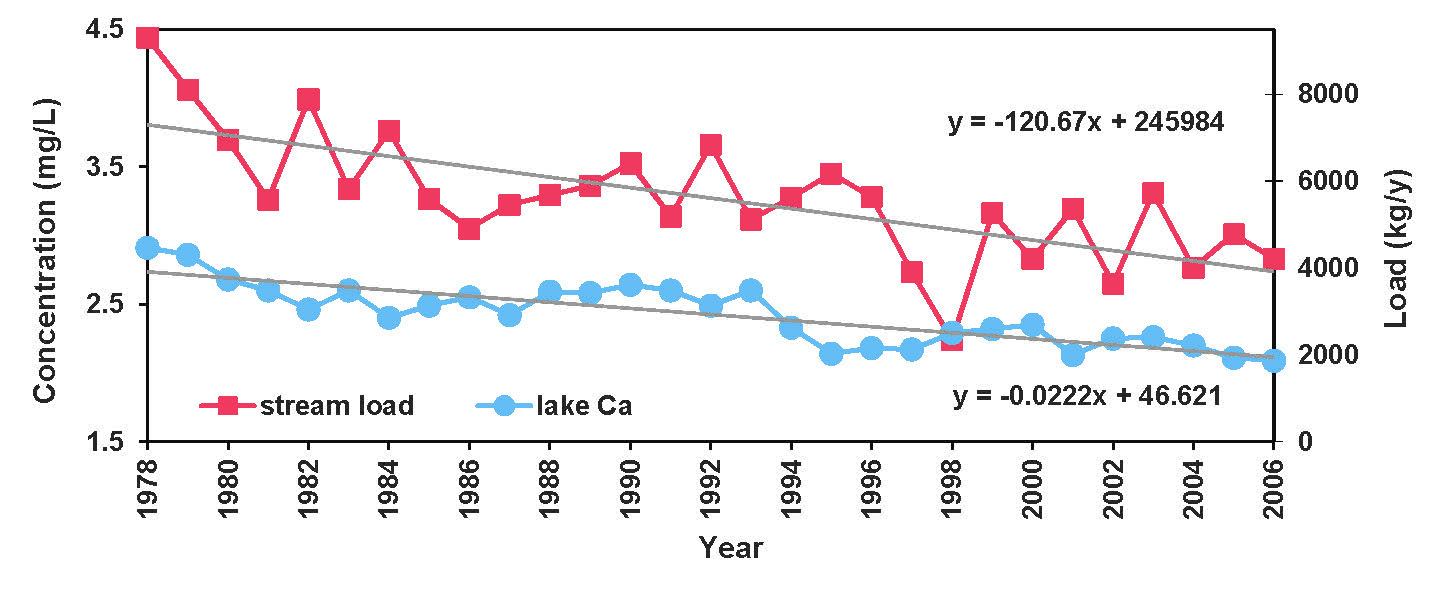
Figure 15: Long-term declines for Red Chalk Lake in stream calcium load and lake calcium concentration. Annual values are displayed by marked lines, their linear trends displayed by straight gray lines, with the regression equations shown.
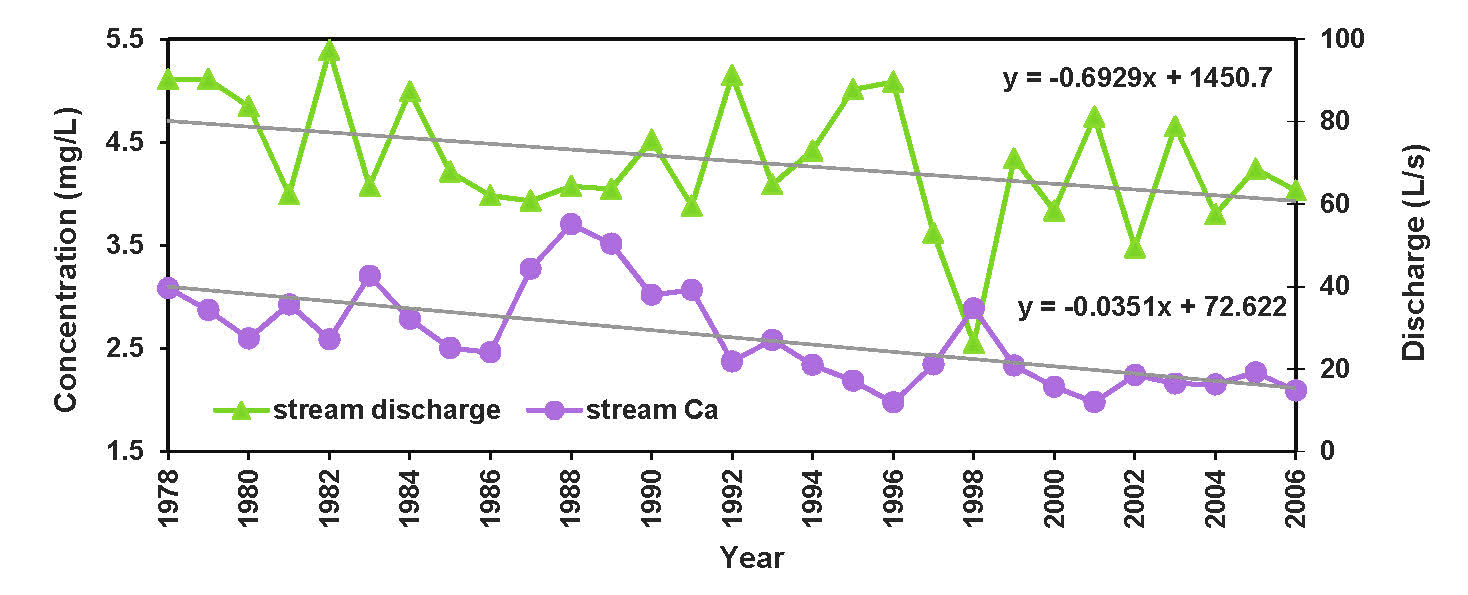
Figure 16: Long-term declines for Red Chalk Lake in stream discharge and stream calcium concentration. Annual values are displayed by marked lines, their linear trends displayed by straight gray lines, with the regression equations shown.
The decreases in both discharge and concentration played a role in the calcium decline at Red Chalk Lake, with the concentration’s role being greater (56% versus 44%). The decrease in stream discharge is caused by reduced precipitation and warmer air temperature that are controlled by climatic variation. The calcium decline issue is important because the decreased calcium supply has caused negative impacts on zooplankton communities and further decline could lead to more detrimental effects on aquatic ecosystems.
Streams and groundwater
Much like the Great Lakes, the water quality in Ontario’s rivers and streams has been affected by differing land uses across the province associated with the development of urban, agricultural, industrial and recreational areas.
The ministry has been operating a stream monitoring program since 1964. Under this program, the ministry, in partnership with conservation authorities, provincial parks and municipalities, has been monitoring water quality in hundreds of Ontario’s rivers and streams, with up to fifty years of data for many parts of the province. They monitor a standard suite of water quality parameters at each sampling location, including chloride, nutrients, suspended solids, trace metals and other general chemistry parameters. The more than 400 monitored stream locations provide consistent spatial coverage in populated areas, or other areas where land use activities may be affecting water quality.
Reporting on the state of Ontario’s streams
The ministry’s long-term data has been frequently used by the ministry and its partners to track and report on the state of water quality in Ontario’s rivers and streams and to show the effects of land-use activities on water quality. Below are three examples of state of environment reporting on Ontario’s streams that provide us with an idea of how Ontario’s streams are doing with respect to the quality of their waters.
Conservation authorities’ watershed report cards
Conservation authorities prepare watershed report cards to report on the state of the environment in many of Ontario’s watersheds. Each report card delivers a large amount of technical information in an easily understood format. It summarizes standardized grades for all subwatersheds in a conservation authority watershed. The grading system developed ranges from an A grade (excellent) to an F grade (very poor). Indicator ranges and their associated grade were developed as a collaborative process with conservation authorities and expert input from the ministry and other agencies. For the surface water indicators, Provincial Water Quality Objectives (total phosphorus objective, 0.030 milligrams per litre and E. coli, 100/100 millilitres) were considered while creating the grades. Please refer to Conservation Ontario for more details on their reporting and grading system.
Throughout 2013/2014, three quarters of Ontario’s 36 Conservation Authorities produced a watershed report card. Each report card features indicators for surface water, groundwater, and forest cover. A common set of indicators has not been developed yet for wetlands, yet some conservation authorities provide information on the state of wetlands in their area of jurisdiction. Much of the information used to create the surface and groundwater quality indicators comes from the ministry’s stream, groundwater and benthos monitoring programs. The surface water indicators used include total phosphorus, bacteria (E. coli) and benthic invertebrates.
Below we provide a brief summary of the surface water quality findings reported in the latest Watershed Report Cards by 27 conservation authorities.
What the watershed report cards say about surface water quality in Ontario’s streams
Based on the brief summary of the most recent watershed report cards, the quality of Ontario’s surface water is mixed; while many areas in Ontario enjoy excellent or good water quality, there are many others that have fair or poor water quality and some that have very poor water quality.
The table below shows the percentage of conservation authority subwatersheds in Ontario (246 in total) falling within each category based on the surface water quality indicators: total phosphorus, bacteria and benthic invertebrates.
| Subwatersheds | Grade |
|---|---|
| 4% | A - Excellent |
| 11% | B - Good |
| 17% | C - Fair |
| 28% | D - Poor |
| 3% | F - Very Poor |
| 37% | Insufficient Data |
Of roughly 750 subwatersheds reported on by three quarters of the conservation authorities, the report cards ranked 15% of them as ‘excellent’ or ‘good’ and a further 17% of the watersheds were ranked as ‘fair’. 28 percent of them were ranked as “Poor”, and three % ranked as “Very poor”. Due to the fact enough data and/or monitoring tools weren’t available, over a third of the subwatersheds could not be graded and were ranked as having ‘insufficient data’. This will be improved in future report cards as these gaps are addressed through the collection of additional data.
Generally, the conservation authority watershed report cards indicate that water quality grades are lower in areas that have more human activity, such as agricultural areas and areas with urban development (commercial, industrial and residential). For example, many areas with fair and poor water quality are located in southwestern Ontario, which is densely populated and widely used for agriculture, industry and urban purposes. The lowest grades fall in heavily developed and populated regions, such as urban centres, where the proportion of natural land cover is low and paved surfaces predominate. Impervious surfaces allow phosphorus from fertilizers and other sources to be carried by storm water and eventually enter lakes, rivers and streams. The few areas designated as having very poor water quality are found along the western shores of Lake Ontario, including the Greater Toronto and Hamilton Area. Conversely, areas with higher grades tend to have high natural land cover, low development and human activity. For example, areas having excellent or good water quality are mostly found in parts of rural and Northern Ontario with lower population densities.
The federal Canadian environmental sustainability indicators report
Environment and Climate Change Canada’s Environmental Sustainability Indicators (CESI) program, in collaboration with provincial partners, reports on the state of the environment using indicators for water quality and quantity, air quality, climate change and more. The program was launched in 2004, in response to a recommendation made by the National Round Table on the Environment and Economy (2003), that the federal government establish a core set of indicators to track environmental issues of importance to Canadians. Indicators are updated as new data become available to provide data and information to track Canada’s performance on key environmental sustainability issues. The indicators selected are built on rigorous methodology and high quality, regularly available data from surveys and monitoring networks.
Environment and Climate Change Canada works with the ministry to develop the Freshwater Quality Indicator (WQI) for Ontario. The WQI provides an overall measure of the ability of freshwater bodies to support aquatic life at selected monitoring stations across Ontario. It is a water quality guideline-driven tool used to summarize large amounts of water quality data at a monitoring station into a single index. Water quality at a station is considered excellent when water quality measurements for selected parameters do not exceed their guidelines. Conversely, water quality is rated poor when water quality measurements usually exceed their guideline. Exceedances at these stations may be large.
The latest data on Ontario’s water quality data reported by CESI (May 2015) are for 2008 to 2010 and were obtained from the ministry’s stream monitoring program. The 2008-2010 Ontario WQI was calculated using 24 monitoring stations that are representative of surface water quality across Ontario and the human pressure exerted on it. The Ontario WQI is calculated using seven water quality parameters: ammonia, chloride, chromium, nickel, nitrate, phosphorus and zinc. Guidelines such as the Canadian Council of Ministers of the Environment (CCME) water quality guidelines for the protection of aquatic life were used for Ontario. Additional information on data methods and sources are available on the CESI website.
What CESI says about water quality in Ontario’s streams
For the 2010 to 2012 period, freshwater quality in rivers in populated areas as well as some remote locations across Ontario ranged from marginal to excellent based on the WQI calculations by Environment and Climate Change Canada. Table 3 shows the percentage of monitoring stations that fall into each classification of water quality. Out of 23 monitoring stations, the largest portion has water quality classified as “Good” (43%) or “Fair” (30%). Five (22%) stations have water quality classified as “Marginal” and one (4%) has water quality classified as “Excellent”.
| Percentage of Water Monitoring Stations | Grade |
|---|---|
| 4% | Excellent |
| 43% | Good |
| 30% | Fair |
| 22% | Marginal |
This table shows the percentage of monitoring stations in Ontario (23 in total) falling within each category based on whether and by how much the parameters ammonia, chloride, chromium, nickel, nitrogen, phosphorus and zinc exceed their guidelines for the protection of aquatic life.
Monitoring stations with water quality ranked as Fair or Marginal were generally located in mostly populated areas with intensive land uses for agriculture or mining. Conversely, stations ranked as Excellent or Good were generally located in remote areas with lower population density or areas with less intensive land uses.
It should be noted that the WQI does not capture all potential water quality issues affecting Ontario’s surface waters since it is based on only 23 monitoring stations and a relatively small set of parameters. The monitoring stations are intended to represent freshwater quality in the portion of Ontario where the majority of residents live. Northern Ontario, which is being increasingly developed, is not represented in the WQI. It is also based on only three years of data so it does not include an indication of whether Ontario’s water quality is getting better or worse. The WQI does not show the impact of spills or other transient events unless these are frequent or long-lasting.
What the Ministry’s water quality in Ontario reports say about Ontario’s streams
The Water Quality in Ontario Report complements the previously mentioned state of environment reports and fills an important gap in state-of-environment reporting by providing information on long-term trends. The long-term trends indicate whether conditions are improving or deteriorating with respect to the water quality indicator being measured. The report also highlights key findings from stream studies conducted in agricultural and urban areas to help us understand the effects of land-use activities on the quality of water in Ontario’s streams. The information in the report presents science that shows the effectiveness of management actions to protect and improve water quality in streams and highlights areas where more efforts are needed.
According to the Water Quality in Ontario Reports, water quality in Ontario’s rivers and streams has shown improvement with respect to phosphorus levels due to nutrient reduction actions, although much of this progress was made in the 1980s and early 1990s and many streams still exceed the water quality objective. Improvements in cosmetic pesticide levels are also being found in many Ontario streams as concentrations continue to decrease and levels remain below water quality guidelines for protecting aquatic life. In contrast, chloride levels in the majority of Ontario’s streams have been increasing over the past few decades, but salt management plans are in place to reduce the amount of chloride entering Ontario’s streams. Ontario needs to continue to work to further understand how to reduce salt entering our waterways.
Water quality in rivers and streams that flow into the Great Lakes
The ministry used its stream monitoring data to calculate a water quality index for rivers and streams that flow into the Great Lakes, which appeared in the latest State of the Great Lakes Report and this report. Results showed that the overall water quality status of these streams and rivers was Fair. 39% of sites were categorized as having Good water quality, 48% were Fair and 13% were Poor. Streams flowing into Lakes Superior and Huron and the St. Lawrence River can be described as having Good water quality. Streams flowing into Lakes Erie and Ontario had Fair water quality. Not surprisingly, further analysis showed that watersheds with the least amount of human development had the highest index values receiving a rating of Good.
Achieving further surface water quality improvements will require continued efforts to overcome challenges associated with population growth, climate change and emerging issues that are expected to affect water quality. Below are some of the report’s key findings:
Phosphorus levels, population density and land use
- Since the 1980s, phosphorus levels in many rivers and streams in Ontario have declined, however, phosphorus levels in many rivers and streams continue to be elevated compared to historical levels (Figure 3.13, Water Quality in Ontario 2012 Report).The lowest phosphorus concentrations are in rivers and streams in central and Northern Ontario where population density is low, there is a more natural land cover, and export of phosphorus from the landscape is naturally low (e.g., shallow, nutrient-poor soils).
- The highest levels are found in southern Ontario, where soils are relatively rich and human population density is higher and the land has been developed for different agricultural and urban uses (Figure 3.13 and 3.14, Water Quality in Ontario 2012 Report).
- A ministry study on streams in an agricultural watershed in southwestern Ontario found that nutrient levels have not dropped compared to 40 years ago (section 3.4, Water Quality in Ontario 2012 Report), indicating a need for continued efforts to control sources of phosphorus in these watersheds.
- The ministry recently launched a new seven-year study (the Multi-Watershed Nutrient Study) to assess the interaction between agricultural land use and nutrient loadings in streams draining to the Great Lakes. This study will intensively monitor nutrient loadings in several agricultural watersheds and will include detailed assessments of landscape characteristics, including land use, land management and soil characteristics.
Pesticides in urban streams
- The ministry, in collaboration with Environment and Climate Change Canada and Conservation Ontario, completed a six-year study comparing cosmetic pesticide levels before and after the Cosmetic Pesticides Ban, which was published in 2014. Results show that levels of herbicides in study streams decreased significantly after the ban.
- Longer-term trends from 2003-2012 in three common lawn care pesticides indicate that concentrations are decreasing and that this decrease began before the ban. This may be related to increased levels of public awareness of pesticide issues and voluntary reductions in urban pesticide uses.
Chloride levels, road salt use and species at risk
- Chloride concentrations have been increasing in Ontario’s streams for the past few decades. The application of winter road salts has been suggested as a major source (section 7.2, Water Quality in Ontario 2010 Report). Programs are in place to encourage users of road salt to develop salt management plans and to implement best management practices to reduce salt use.
- Through monitoring, ministry scientists found significant increases in chloride at 96% of 24 long-term stream monitoring sites in habitats that support salt-sensitive, freshwater mussel species at risk.
- The rates of increase in chloride concentrations were highest at urbanized sites and lowest at forested sites.
- Road salt use contributed to the increases in these streams.
- They also found a peak in chloride levels in some streams in the summer, several months after the last application of road salt, suggesting that some of the applied road salt is retained and moves slowly in the environment. This has implications for freshwater mussels and other aquatic species as elevated chloride levels in the summer can overlap with sensitive early life stages. It also suggests that there may be a time lag in the response of the environment to recent reductions in road salt application.
Pathogens and microbiological monitoring in Ontario rivers
- Studies in select river locations in Ontario show that contamination with pathogens and other fecally-derived microorganisms is common. Beach postings due to elevated E. coli levels continue to be issued for recreational waters along many river systems (e.g., Grand River watershed – see Section 6.2, Water Quality in Ontario 2012 Report). The level of contamination is affected by the seasons, general weather conditions and impacts from human-related activities. The ministry, along with academic partners, conducts ongoing and investigative monitoring of pathogen contamination in a variety of water sources in Ontario.
- The ministry recently completed a six-year pathogen monitoring study on the Grand River (Region of Waterloo) in collaboration with FoodNet Canada, a program led by the Public Health Agency of Canada. Numerous reports, publications and presentations have resulted from this partnership to address questions around pathogen occurrence in river water and potential health risk to the population.
Climate change
- In some Ontario streams, we have measured changes in stream flow in the past three decades with a gradual decrease in annual precipitation and runoff (Section 5.2, Water Quality in Ontario 2012 Report), especially from 1970 to the 1990s. The long-term increase in dry conditions could be a threat to aquatic ecosystems in central Ontario.
Pesticides in urban streams
In 2013, the ministry completed a six-year monitoring study of pesticides in 10 streams in major urban centers in Ontario, including the Greater Toronto Area, London, North Bay, Ottawa and Sudbury (Figure 17). The study was a collaborative effort; Conservation authorities assisted with the collection of stream water samples and Environment and Climate Change Canada shared additional pesticides monitoring data resulting in a more comprehensive federal-provincial dataset for several of the study streams.
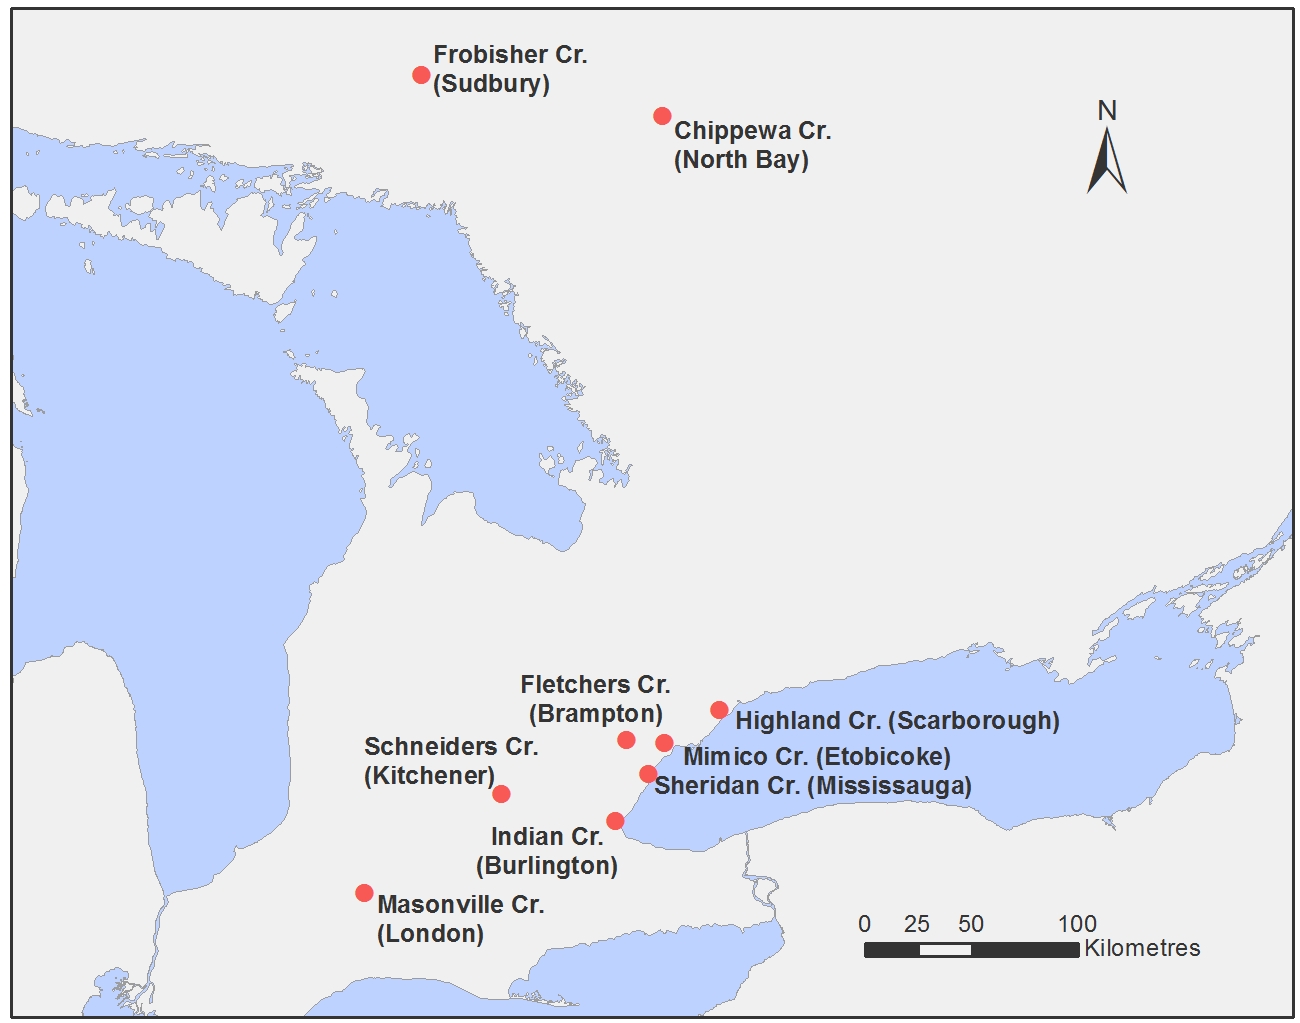
Figure 17: Stream monitoring locations in major urban centres where pesticides were monitored during a six-year ministry study, completed in 2013.
A major objective of the study was to determine if the ban on the sale and use of pesticides for cosmetic (non-essential) purposes, which was implemented in April 2009, was having an influence on pesticide concentrations in streams. The study focused mainly on three herbicides (2,4-D, dicamba, mecoprop) that are amongst the most commonly used pesticides in urban settings
There were three key findings from the study
The study was not designed to measure direct human health implications. The study shows how focused environmental monitoring can be used to measure the environmental outcomes of implemented public policy, and could be useful to other North American jurisdictions considering similar public policy on cosmetic pesticides.
Neonicotinoid insecticides
It is important to our agricultural sector, economy and environment to take action to protect bees and other pollinators. The Ontario government’s strategy to improve pollinator health includes reducing exposure of pollinators to neonicotinoid insecticides. A new set of rules is being phased in between 2015 and 2020 for the sale (by seed vendors) and use (by farmers) of neonicotinoid-treated corn and soybean seeds. In 2015, the ministry initiated a new monitoring study to measure changes in neonicotinoid insecticide concentrations in the environment. Stream water quality, soil quality and benthic invertebrates are being monitored in watersheds with a high proportion of corn and soybean crops. The 2015 study year will be used to benchmark neonicotinoid concentrations in the environment prior to the new rules taking effect, while subsequent years of study (tentatively 2016-2020) will be used to track future changes in neonicotinoid concentrations.
Road salt and freshwater mussels
Road salt (mostly sodium chloride) is used in cold climates to clear ice and snow from roads, parking lots and sidewalks. The addition of road salt to the environment can contaminate drinking water sources and impair the health of plants, animals and aquatic ecosystems
The ministry, as part of the Provincial Water Quality Monitoring Network, has been monitoring concentrations of sodium and chloride in Ontario’s streams for decades. Ministry scientists looked at these long-term monitoring data from a unique perspective in a paper published in the science journal Environmental Pollution
Ministry scientists found significant increases in chloride at 96% of 24 long-term stream monitoring sites in mussel habitats. The rates of increase in chloride concentrations were highest at urbanized sites and lowest at the forested sites. Statistics showed that the application of road salt contributed to the increases. An interesting and unexpected finding was that chloride concentrations at some sites peaked in the summer, several months after the last application of road salt. This suggests that a portion of applied road salt is retained and transported slowly in the environment. This has implications for freshwater mussels and other aquatic species as elevated chloride concentrations in the summer can overlap with sensitive early life stages. It also suggests that there may be a time lag in the response of the environment to recent reductions in road salt application.
The handling, storage and application of road salts are prescribed drinking water threats in Ontario under the Clean Water Act. Where road salt represents a significant threat, the local source protection plan contains policies aimed at reducing road salt impacts, including best management practices.
Programs are in place to encourage users of road salt to develop salt management plans and to implement best management practices to reduce salt use. Examples include Environment and Climate Change Canada’s Code of Practice for the Environmental Management of Roads Salts, which is aimed at provincial transportation ministries and large municipalities and the Smart About Salt Council (affiliated with Landscape Ontario), which has education and certification programs aimed at landowners and private contractors. Ongoing monitoring measures the influence these programs on salt levels in the environment and helps to identify salt vulnerable areas (such as freshwater mussel habitats) where additional protections may be needed.
Drought, groundwater levels and monitoring for climate change
Drought and climate change
The contribution of groundwater to streams and to some lakes and wetlands plays an important role in maintaining water levels during low-flow conditions which occur every summer. This contribution is even more important during times when increased temperatures and lower precipitation cause even lower flows during the summer which can lead to drought conditions. Periods of drought are projected to become more frequent under climate change.
In the event of a drought the Ontario Low Water Response Program assists in the coordination of provincial and local responses. The program was established in 2000 by the province in response to the 1998-1999 drought and uses monitoring information on stream flow and precipitation to ensure that the province and local authorities are prepared for low water levels.
The ministry has been working with the Surface Water Monitoring Centre of the MNRF, Conservation Ontario, and various conservation authorities on the development of a groundwater indicator for the Ontario Low Water Response Program.
Currently, the monitoring information on stream flow and precipitation is used to specify three different levels of drought conditions. A Moderate condition is the first indication of a potential water supply problem. A Severe condition indicates a potentially serious problem. A Critical condition indicates the potential for failure of the water supply to meet the demand, resulting in progressively more significant and widespread socioeconomic and environmental effects.
Also in response to the 1998-1999 drought, the Provincial Groundwater Monitoring Network (PGMN) was established. The PGMN is led by the ministry in partnership with conservation authorities and local municipalities. The PGMN wells monitor groundwater levels and quality throughout the province. Groundwater levels are collected hourly from 474 monitoring wells and water samples are collected and analyzed annually. Now that we have collected more than 10 years of groundwater level data, we can use it to establish the three different levels of drought conditions.
A Groundwater Indicator Team consisting of hydrogeologists from the ministry and the conservation authorities, with administrative and financial support from MNRF, was established in February 2012 to guide the development of the groundwater indicator. The Groundwater Indicator Team selected the percentile method for identifying the three different levels of drought conditions.
The team looked at how other jurisdictions applied the method to groundwater and selected preliminary percentiles for each of the three drought conditions as shown in the table below. For the Moderate condition, the 25th percentile is a groundwater level where 25% of all the other groundwater levels that have been recorded at a particular time are lower. As with other jurisdictions we have calculated the percentiles on a monthly basis.
| Drought condition | Percentile |
|---|---|
| Moderate | 25 |
| Severe | 10 |
| Critical | 5 |
The selected percentiles for the drought conditions are currently preliminary as the team continues to gain some experience with their application before finalizing them. It may be that different conservation authorities would prefer to select their own percentiles to reflect local conditions.
An example of the application of the percentile method to groundwater level data is shown using a PGMN monitoring well known as W-09. This monitoring well is located in southwestern Ontario in Norfolk County. Although this area is largely farmland, the well is in a forested area. This area was significantly impacted by the 1998-1999 drought since the farming in the area is highly dependent on irrigation.
To illustrate the application of the groundwater indicator, it is compared with groundwater level data from a relatively dry year that occurred in 2007, with a relatively wet year in 2008 (Figure 18). In the dry year, the groundwater levels fell below the Moderate condition sometime in May and remained below it for the rest of the year. From July to November of that year the groundwater levels were in the range of the Critical to Severe conditions. In contrast, during the summer and early fall of wet year, 2008, the groundwater levels were well above the Moderate condition. They are almost one metre higher than they were at the same time in 2007.
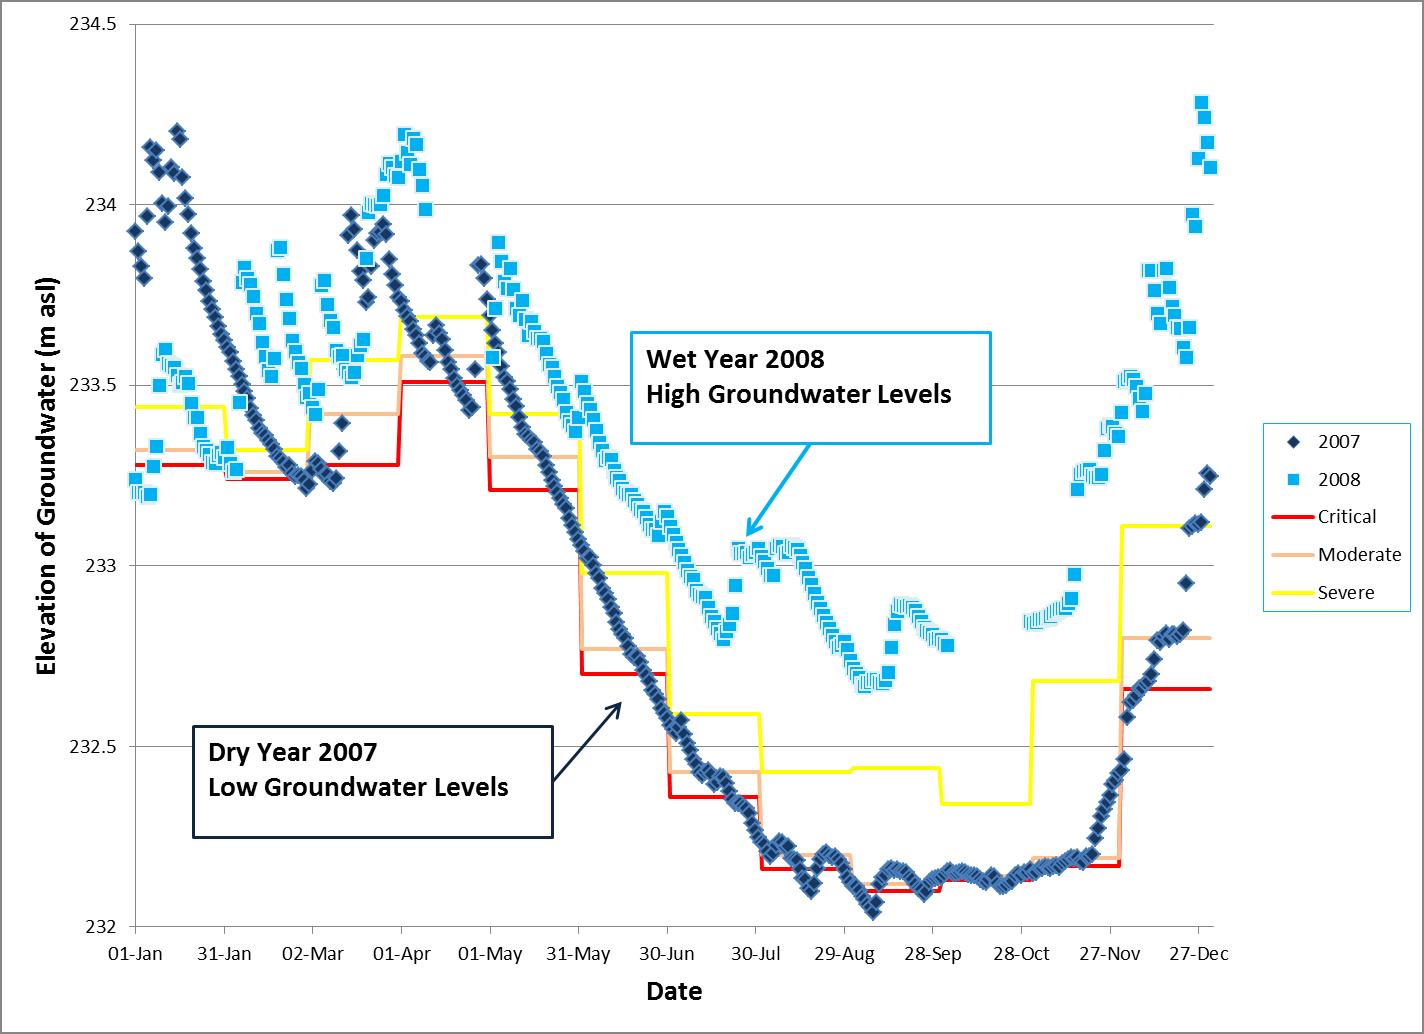
Figure 18: PGMN Well W-09 groundwater levels for drought conditions in dry year, 2007, and high groundwater levels from wet year, 2008.
Testing of the groundwater indicator is occurring with PGMN Well W-09 and four other PGMN wells. The five test wells have been set up with real-time satellite transmission that will provide information on groundwater conditions to ensure the preparedness of Ontarians for future, and possibly more frequent, occurrences of drought.
Groundwater levels and climate change
We know that the climate will change in Ontario with higher temperatures and more precipitation compared to what we have experienced in the past. The global climate models that estimate the climate of the future generally agree that for Ontario there will be a two to five degree increase in temperature by the year 2100. But when and how much rain and snow will fall is a lot less certain since the climate models provide a range of different precipitation patterns. It is necessary to look at the changes in precipitation from as many climate models as possible to get an idea of how variable the future can be.
Groundwater levels are particularly difficult for future projections since they depend on many factors like type of geology, soil at the surface, type of land cover, vegetation and topography. To get an idea of future variability of groundwater levels, the ministry worked with Environment and Climate Change Canada on a groundwater level model that used temperature and precipitation projections from 26 global climate models to the year 2100. Although the model is simple since it does not account for all of the factors that groundwater levels are dependent on, it is useful for determining which global model projections provide the most extreme results. The extreme results can then be used in more sophisticated and complex groundwater models to provide more accurate estimations of changes to groundwater levels.
The groundwater level model also uses past and current measured groundwater levels from a monitoring well to optimize the projected groundwater levels. The groundwater levels from the same PGMN monitoring well that was used to illustrate the groundwater drought indicator was used for this project. PGMN Well W-09, which has a relatively long record of 26 years of measured levels.
The temperature and precipitation projections from the 26 global climate models were obtained from the MNRF. These projections provide the possible future climates that could occur in the area around Well W-09.
The results from the groundwater level model range from a decrease of 50 cm of the annual average groundwater level to an increase of 11 cm. The mean between these extremes is a decrease of 10 cm.
Although the majority of the results show a decreasing groundwater level, all of the results are equally valid and must be considered, so further work to help ministry scientists better prepare for climate change impacts would at least look at the minimum and maximum extremes and the mean.
There are two extremes that need to be considered here. One extreme is the 50 cm decrease in groundwater levels which is due to a hotter and only slightly wetter climate than experienced today. With an average annual temperature of 11.1 ºC (today it is 7.8 ºC) and an annual precipitation amount of 1115 mm (today it is 1010 mm), the future climate is similar to the climate of today in southeastern Kansas. The other extreme of an 11 cm increase is due to climate with an annual average temperature of 10.3 ºC and a larger amount of annual precipitation of 1207 mm. This is similar to the climate of today of southern Indiana.
The monthly precipitation from the three climate models is shown in Figure 19. It does appear that the future climates show more precipitation in winter, spring and fall and less precipitation in the summer. This change in precipitation could mean less moisture and water available in summer for agriculture and aquatic ecosystems such as the Trout fishery.
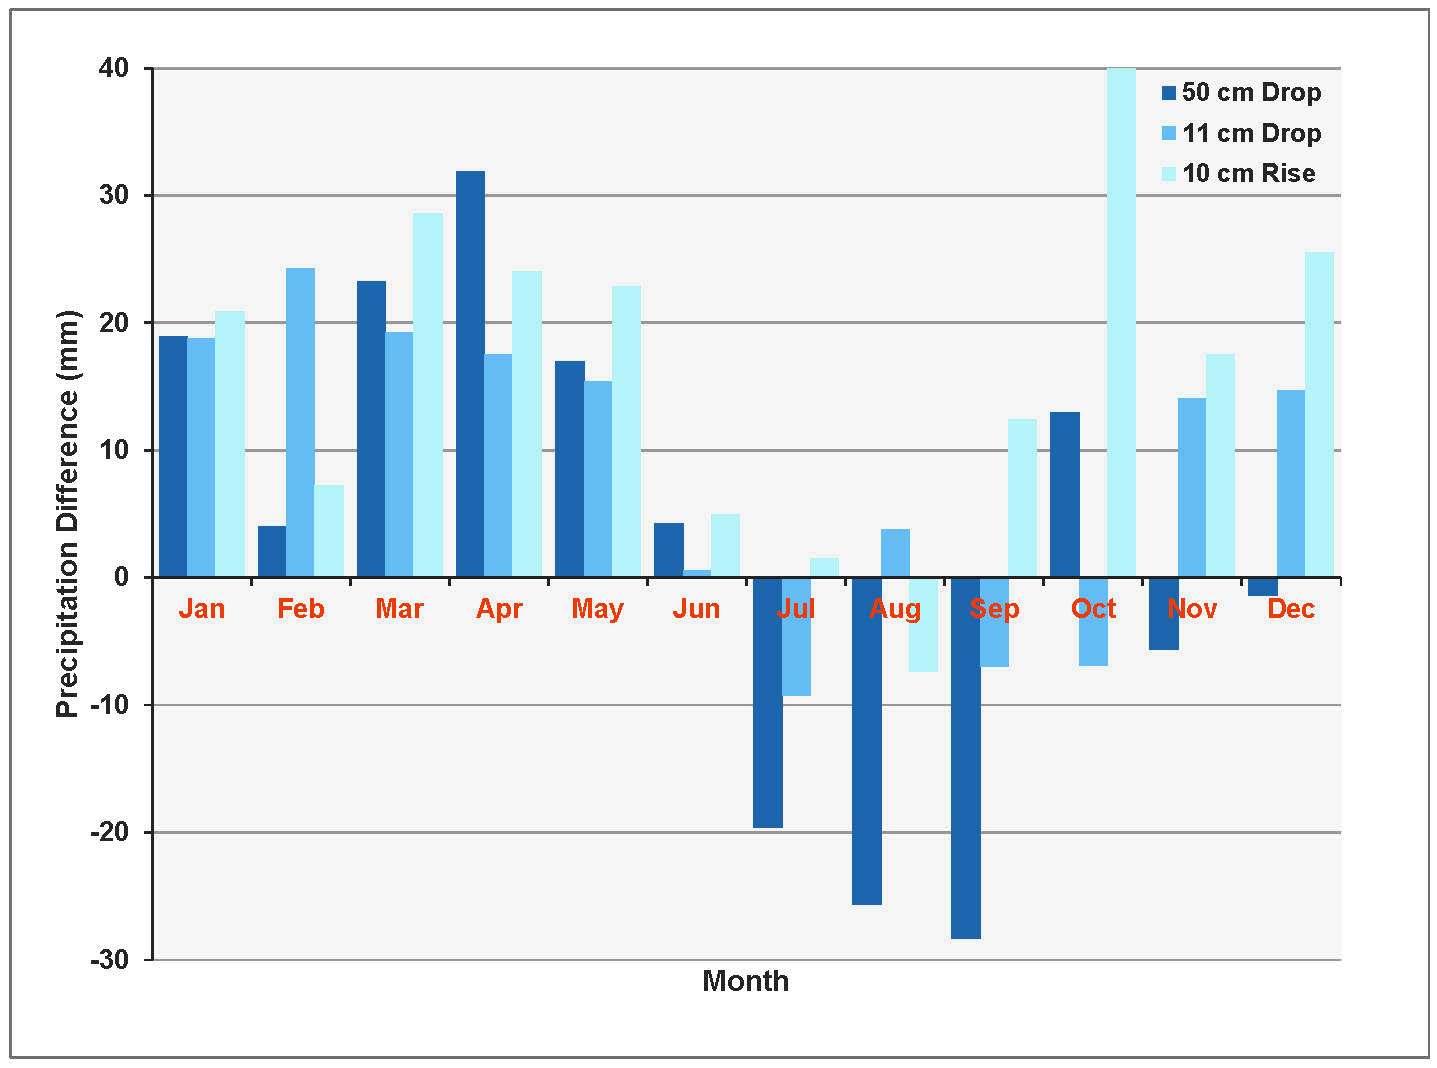
Figure 19: The monthly precipitation projected for the year 2100 compared to the period 1971 to 2000 from three global climate models for the area around PGMN Well W-09. All three show higher precipitation in winter, spring and fall and lower in summer.
To deal with uncertainty of the climate of the future, the ministry must continue to collect data, providing long-term monitoring so that trends can be identified with statistical significance. We can also investigate the potential impacts of lower or higher groundwater levels by using more sophisticated water models that do account for the factors that determine groundwater levels. This will help us to prepare for the consequences of a changing climate.
Monitoring and climate change
Climate and land use changes will affect water quantity and quality in complex ways. Management of water resources requires data and information to adapt to a changing environment. The integration of water monitoring will provide needed information on groundwater-surface water interactions, how stream flow and water quality change, and the data to determine evapotranspiration, to mention a few. How the components of the water balance will change with respect to each other will be an important key to adaptation planning.
The integrated water monitoring site at Parkhill Creek in Ausable Bayfield Conservation Authority is the outcome of a multi-phase, multi-year project funded under the Canada-Ontario Agreement. The project was led by the ministry in collaboration with Conservation Ontario, the MNRF, and Environment and Climate Change Canada. It is a multi-agency project that brings together the people involved in water monitoring in Ontario. The location of the Ausable Bayfield Conservation Authority is shown on the map below.
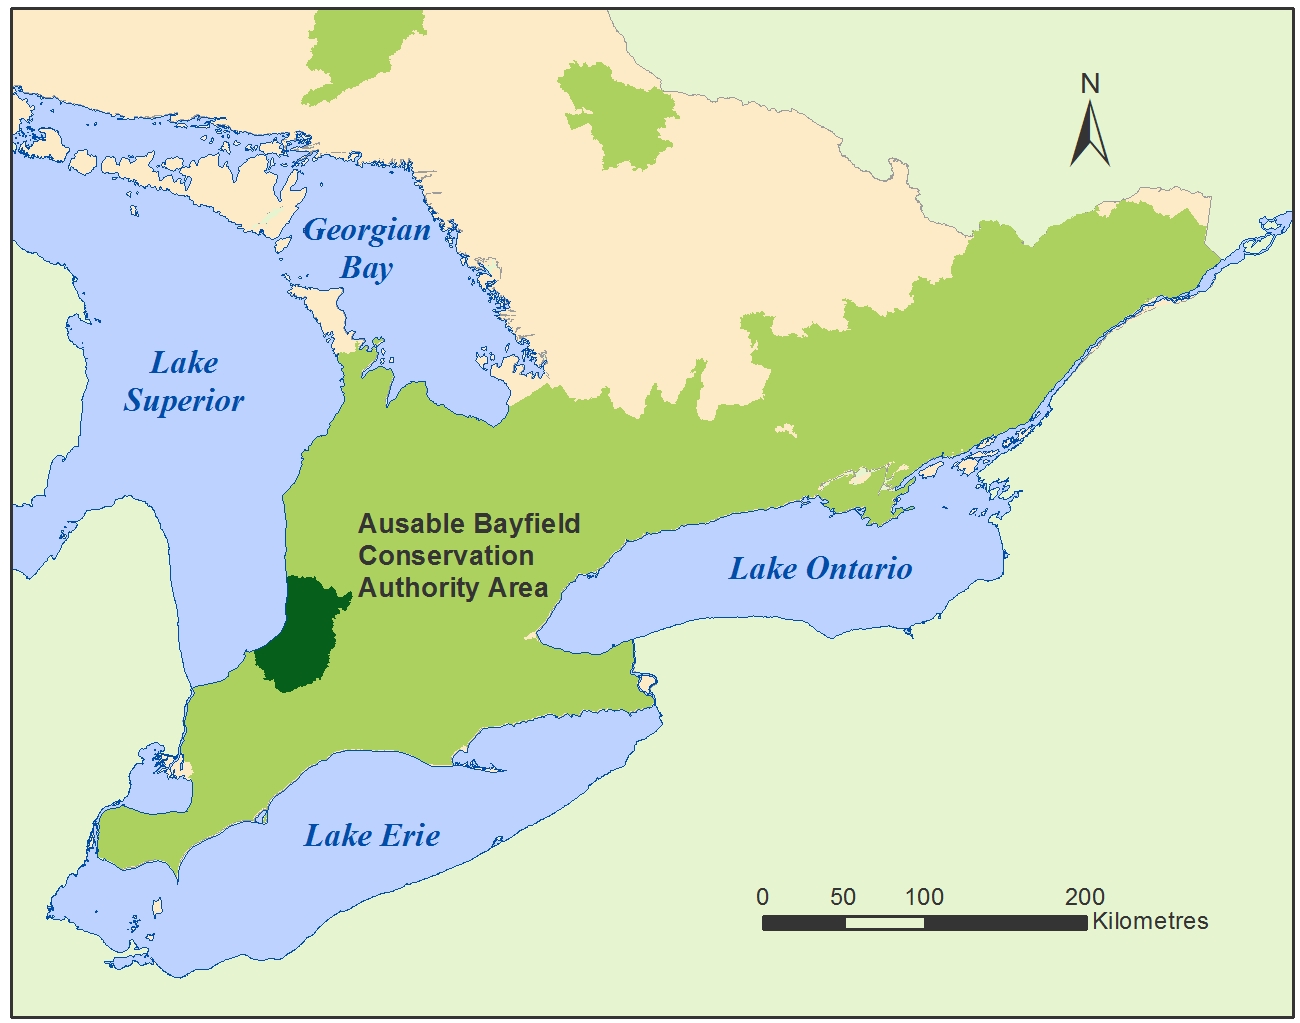
Figure 20: Map showing the location of the Ausable Bayfield Conservation Authority.
The watershed was identified as sensitive to climate change through an assessment that included all watersheds of southern Ontario. In the spring of 2012, the site was prepared and the instruments were installed. The instruments included a climate station, groundwater monitoring wells, soil moisture probes, automated sampler, and continuous water quality sensors. The data from the instruments is sent every hour through a satellite transmitter and is collected and stored by the MNRF.
The ministry is interested in the linkages and relationships between precipitation and the other parts of the hydrologic cycle like soil moisture, groundwater levels and stream flow. Some of these parts, like soil moisture, can change significantly from one place to another, so having the measurements at one location will help to understand these linkages and how they might change in response to climate and land use changes. This will help answer important questions: What will happen to soil moisture and groundwater levels if there are fewer but more intense rain events? Will there be more water flowing in the stream and less in the groundwater system? How will the quality of the water in streams change? What is the influence of climate change compared to changing land uses?
Ministry scientists will be working with the MNRF, Ontario Ministry of Agriculture, Food and Rural Affairs and the University of Guelph to start to answer these kinds of questions by using the data to build an integrated surface-groundwater model that will simulate the different parts of the hydrologic cycle. The goal is to be able to develop a better understanding of the hydrologic cycle at Parkhill Creek and learn how to build resilience and prepare for the future.
Key words and terms
- Algae:
- A group of aquatic organisms that have all or most of the following features: they photosynthesize, they have simple vegetative structures without a vascular system and reproductive bodies that lack a sterile layer of protecting cells.
- Aquifer:
- A layer of soil, sand, gravel or rock that contains groundwater.
- Bioaccumulative:
- A substance with potential to build up (accumulate) in an organism to levels higher than the surrounding environment.
- Biomagnification:
- Result of the process of bioaccumulation and biotransfer by which tissue concentrations of chemicals in organisms at one trophic level exceed tissue concentrations in organisms at the next lower trophic level in a food chain.
- Biota:
- Living organisms in water.
- Bog:
- Ombrotrophic peatland - Peatland in which the surface peat and vegetation only receives water and nutrients from precipitation, dust, sea-spray, and airborne deposition.
- Calcareous soils:
- Calcareous soils are relatively alkaline, in other words they have a high pH.
- Dichloro-diphenyl-trichloroethane (DDT):
- A pesticide used to control insect populations.
- Dissolved organic carbon:
- Microscopic pieces of organic (carbon-containing) matter in water.
- Eutrophication:
- A process where water bodies receive excess nutrients that stimulate excessive plant growth.
- Far North:
- Covers 42% of Ontario’s land mass. It is about 3 times the size of Lake Superior, it stretches from Manitoba in the west to James Bay and Quebec in the east.
- Fen:
- Minerotrophic peatland – Peatland receiving inflow of water and nutrients from the mineral soil. Distinguished from swamp forest by a lack of tree cover or with only sparse (<25%) crown cover. Indistinctly separated from marsh (which is always beside open water, and usually has a mineral substrate)
footnote xxxv . - Groundwater:
- Water that occurs beneath the surface of the Earth in saturated soils and geological formations.
- Inflow:
- Stream inflow entering a lake.
- Lakebed:
- The floor, or bottom, of a lake.
- Load:
- The amount of a substance entering a water body over a given interval.
- Multiple stressors:
- Two or more stressors that have interactive and cumulative impacts on aquatic ecosystems (e.g., acid rain and climate change).
- Nearshore:
- Locations that are close to the shoreline of the Great lakes, within a range of tens of meters to a couple of kilometres offshore.
- Neonicotinoid insecticides:
- Nicotine-based systemic insecticides, which are taken up by plant leaves or roots and transported throughout the plant. They are highly toxic to bees, and are persistent and mobile in the environment.
- Outflow:
- The waterway where water flows out of a lake.
- Parameter:
- A measurable characteristic or feature of water quality.
- Peatlands:
- Peat covered terrain. A minimum depth of peat is required for a site to be classified as a peatland (e.g., 30 or 40 cm).
- Pollutant:
- Any substance that, when released to the environment, degrades the environment such that living organism can be harmed or human uses of natural resources are impaired.
- Polybrominated diphenyl ethers (PBDEs):
- Flame retardants containing bromine added to polymers used in textiles, foam, plastics, electronics.
- Provincial Water Quality Objective:
- Numerical and narrative criteria that are protective of all forms of aquatic life.
- Remedial Action Plan:
- A strategy developed to restore and protect an Area of Concern in the Great Lakes.
- Remediation:
- Taking action to reduce, isolate or remove contamination from the environment.
- Runoff:
- Water from melting snow and rain that moves from the landscape into receiving water bodies.
- Surface water:
- Water on the Earth’s surface including lakes streams, and wetlands.
- Stratified:
- Occurs when a lake has separated into three layers: Epilimnion - top of the lake. Metalimnion (or thermocline) - middle layer that may change depth throughout the day. Hypolimnion - the bottom layer.
- Toxin:
- A poisonous substance produced by living cells or organisms.
- Watershed:
- An area of land from which water drains to a given point; synonymous with drainage area, basin, and catchment.
Footnotes
- footnote[i] Back to paragraph Environment Canada and the U.S. Environmental Protection Agency (2014) State of the Great Lakes 2011. Cat No. En161-3/1-2011E-PDF. EPA 950-R-13-002.
- footnote[1] Back to paragraph A status of “good”, “fair”, “poor” or “undetermined” is assigned to each indicator used in the State of the Lakes Ecosystem report. “Good” indicates that the indicator is meeting ecosystem objectives or is otherwise in acceptable condition. “Fair” indicates that it is exhibiting minimally acceptable conditions, but not meeting established objectives or criteria. “Poor” suggests it is severely negatively impacted and not displaying even minimally acceptable conditions. “Undetermined” suggests that data are not available or are insufficient to assess the status of ecosystem components. The trend for each indicator is defined as “improving”, “deteriorating”, “unchanging” or “undetermined”. “Improving” means the metrics show a change toward more acceptable conditions. “Deteriorating” indicates a change away from acceptable conditions. “Unchanging” indicates no change. “Undetermined” indicates a balance of both improving and deteriorating conditions, or data are not available to report on a trend.. Lake Michigan is the only Great Lake entirely within the U.S. and as such, it is not addressed in this chapter.
- footnote[ii] Back to paragraph International Upper Great Study (IUGLS). 2012. Lake Superior Regulation: Addressing Uncertainty in Upper Great Lakes Water Levels - Summary of Findings and Recommendations
- footnote[iii] Back to paragraph Environment Canada, U.S. Environmental Protection Agency (2014). State of the Great Lakes 2011 (pages 322-329)
- footnote[iv] Back to paragraph Canadian Council of Ministers of the Environment (CCME). Water Quality Index. http://www.ccme.ca/en/resources/canadian_environmental_quality_guidelines/calculators.html
- footnote[v] Back to paragraph Nicholls KH, Hopkins GJ, Standke SJ and Nakamoto, L (2001) Trends in total phosphorus in Canadian near-shore waters of the Laurentian Great Lakes: 1976-1999. J. Great Lakes Res. 27:402-422.
- footnote[vi] Back to paragraph Winter JG, Palmer ME, Howell ET and Young JD (2015) Long term changes in nutrients, chloride, and phytoplankton density in the nearshore waters of Lake Erie. J. Great Lakes Res. 41:145-155.
- footnote[vii] Back to paragraph Winter JG, Howell ET and Nakamoto LK (2011) Trends in nutrients, phytoplankton, and chloride in nearshore waters of Lake Ontario: synchrony and relationships with physical conditions. J. Great Lakes Res. 38:124-132.
- footnote[viii] Back to paragraph Chapra SC, Dove A and Rockwell DC (2009) Great Lakes chloride trends: long-term mass balance and loading analysis. J. Great Lakes Res. 35:272-284.
- footnote[ix] Back to paragraph Winter JG, Howell ET and Nakamoto LK (2011) Trends in nutrients, phytoplankton, and chloride in nearshore waters of Lake Ontario: synchrony and relationships with physical conditions. J. Great Lakes Res. 38:124-132.
- footnote[x] Back to paragraph Rao YR, Howell T, Watson SB and Abernethy S (2013) On hypoxia and fish kills along the north shore of Lake Erie. J. Great Lakes Res. 40 (2014): 187-191.
- footnote[xi] Back to paragraph Shen L, Reiner EJ, MacPherson K, Kolic T, Sverko E, Helm P, Bhavsar S, Brindle I and Marvin C (2010) Analysis of Halogenated Norbornene Flame Retardants in the Laurentian Great Lakes: Dechloranes 602, 603 and 604. Environ. Sci. Technol. 44: 760-766.
- footnote[xii] Back to paragraph Shen L, Reiner EJ, Helm PA, Marvin CH, Hill B, Zhang X, MacPherson KA, Kolic TM, Tomy GT, and Brindle ID (2011) Historic trends of Dechloranes 602, 603, 604, Dechlorane Plus and other norbornene derivatives and their bioaccumulation potential in Lake Ontario. Environ. Sci. Technol. 45, 3333-3340.
- footnote[xiii] Back to paragraph Shen L, Jobst KJ, Reiner EJ, Helm PA and McCrindle R (2014) Identification and Occurrence of Analogues of Dechlorane 604 in Lake Ontario Sediment and their Accumulation in Fish. Environ. Sci. Technol. 48: 11170-11177.
- footnote[xiv] Back to paragraph Neff MR, Robinson J M and Bhavsar S P (2013) Assessment of fish mercury levels in the upper St. Lawrence River, Canada. J. Great Lakes Res. 39:336–343.
- footnote[xv] Back to paragraph Ridal JJ, Hickey MBC, Marty J and Bhavsar SP (2012) Assessing the fish consumption beneficial use impairment in the Bay of Quinte. Aquat. Ecosyst. Health Manag. 15:453–463.
- footnote[xvi] Back to paragraph Robinson JM, Neff MR and Bhavsar SP (2015) Assessment of contaminant levels in fish from the Toronto waterfront area. J. Great Lakes Res. 41: 228-237
- footnote[xvii] Back to paragraph Neff MR, Stefanoff S and Bhavsar SP (2016) Improvements in fish PCB and other contaminant levels in response to remedial actions at Hamilton Harbour, Ontario, Canada. Aquat. Ecosyst. Health Manag. DOI: 10.1080/14634988.2016.1139996
- footnote[xviii] Back to paragraph Karst-Riddoch TL, Jackson DA and Bhavsar SP (2008) Changes in contaminant burdens in Niagara River sport fish following remedial actions to reduce toxic loadings since 1986/87
- footnote[xix] Back to paragraph Richman LA, Hobson G, Williams DJ and Reiner E (2011) The Niagara River Mussel Biomonitoring Program (Elliptio complanata), 1983-2006. J. Great Lakes Res. 37:215-225.
- footnote[xx] Back to paragraph Karst-Riddoch TL, Jackson D and Bhavsar S (2008) Changes in contaminant burdens in Niagara River sport fish following remedial actions to reduce toxic loadings since 1986/87. University of Toronto and Ontario Ministry of the Environment. ISBN 978-1-4249-7674-4.
- footnote[xxi] Back to paragraph Hill B and Klawunn P (2009) Niagara River upstream/downstream monitoring program report: 2001-2002 to 2004-2005. Environment Canada (EC).
- footnote[xxii] Back to paragraph Binding CE, Greenberg TA and Bukata RP (2011) Time series analysis of algal blooms in Lake of the Woods using the MERIS maximum chlorophyll index. Journal of Plankton Research. Volume 33(12): 1847–1852.
- footnote[xxiii] Back to paragraph Rennie MD, Strecker AL and Palmer ME (2011) Bythotrephes invasion elevates trophic position of zooplankton and fish: implications for contaminant biomagnification. Biological Invasions. 13:2621-2634.
- footnote[xxiv] Back to paragraph Yao H., Samul NR, Joehnk KD, Fang X, Bruce LC, Pierson DC, Rusak JA, and James A (2014) Comparing ice and temperature simulations by four dynamiclake models in Harp Lake: past performance and future predictions. Hydrol. Process. 28(16) 4587-4601.
- footnote[xxv] Back to paragraph Palmer ME, Yan ND and Somers KM (2014) Climate change drives coherent trends in physics and oxygen content in North American lakes. Climatic Change. 124:285-299.
- footnote[xxvi] Back to paragraph Palmer ME, Yan ND, Paterson AM and Girard RE (2011) Water quality changes in south-central Ontario lakes and the role of local factors in regulating lake response to regional stressors. Can. J. Fish. Aquat. Sci. 68:1038-1050.
- footnote[xxvii] Back to paragraph Palmer ME and Yan ND (2013) Decadal-scale regional changes in Canadian freshwater zooplankton: the likely consequence of complex interactions among multiple anthropogenic stressors. Freshwater Biology. 58:1366-1378.
- footnote[xxviii] Back to paragraph Rennie MD, Strecker AL and Palmer ME (2011) Bythotrephes invasion elevates trophic position of zooplankton and fish: implications for contaminant biomagnification. Biological Invasions. 13:2621-2634.
- footnote[xxix] Back to paragraph Yao H, James A, McConnell C, Turnbull B, Field T, and Somers K (2016) Relative contributions of stream concentration, stream discharge and shoreline load to base cation trends in Red Chalk and Harp lakes, south-central Ontario, Canada. Hydrol. Process. 30: 858-872.
- footnote[xxx] Back to paragraph Glozier NE, Struger J, Cessna AJ, Gledhill M, Rondeau M, Ernst WR, Sekela MA, Cagampan SJ, Sverko E, Murphy C, et al. (2011) Occurrence of glyphosate and acidic herbicides in select urban rivers and streams in Canada. Environ. Sci. Pollut. Res. 19:821–834.
- footnote[xxxi] Back to paragraph Todd A and Struger J (2014) Changes in acid herbicide concentrations in urban streams after a cosmetic pesticides ban. Challenges 5:138-151. http://www.mdpi.com/2078-1547/5/1/138
- footnote[xxxii] Back to paragraph Phillips PJ, Ator SW and Nystrom EA (2007) Temporal changes in surface-water insecticide concentrations after the phaseout of diazinon and chlorpyrifos. Environ. Sci. Technol. 41: 4246–4251.
- footnote[xxxiii] Back to paragraph Environment Canada and Health Canada (2001). Canadian Environment Protection Act, 1999, Priority Substances List Assessment Report, Road Salts.
- footnote[xxxiv] Back to paragraph Todd A, Kaltenecker G (2012) Warm season chloride concentrations in stream habitats of freshwater mussel species at risk. Environ. Pollut. 171:199-206.
- footnote[xxxv] Back to paragraph Rydin H and Jeglum J (2006) The Biology of Peatlands. ISBN 978-0-19-852872-2, Oxford University Press, Milton Keynes, U.K., pp. 343