Section 1: a primer on the current state of the Workplace Safety and Insurance Board in 2019
Introduction
The Workplace Safety and Insurance Board has been the subject of several independent reviews over the years. These reports have provided a solid foundation from which to build, including detailed descriptions of the WSIB’s genesis and its evolution from 1914 to the present.
Readers interested in learning more about the WSIB’s historical ebbs and flows should consult past reports such as Reshaping Workers’ Compensation in Ontario
This report will not revisit this historical analysis in great detail. There is not much that can be contributed to these excellent resources or to expand stakeholder awareness of the WSIB’s historical evolution. It is also the case that the opportunities and challenges facing the WSIB in the short, medium, and long-term justify dedicated attention particularly in light of growing public expectations of our public institutions.
This section of the report provides a basic primer on the current state of the WSIB’s financial position, insurance model, operations, and its interrelationship with the broader workplace safety ecosystem in Ontario. It will also present comparisons with other jurisdictions and private insurers if and where applicable. The basic goal is to give Ontarians an independent sense of where the WSIB currently stands on the key inputs and factors that affect its capacity to serve workers and employers in the province and, in so doing, lay the foundation for the forward-looking analysis and recommendations set out in the subsequent section.
1.1 Elimination of the Workplace Safety and Insurance Board's unfunded liability
Many readers will know that the WSIB’s financial position was marked by a structural funding gap for decades. The result was an unfunded liability which represented the amount by which the total assets less non-controlling interests is less than total liabilities
Put a simpler way, the WSIB had a consistent shortfall between the resources needed to pay future benefits and the money in the insurance fund. The unfunded liability was a function of various factors, but the main contributor was a sustained failure to adequately account for new claims costs in the WSIB’s pricing. That is to say the WSIB’s premium rates were lower than they ought to have been to fully cover the costs of benefit payments over several years. Simply put: the WSIB was charging roughly 80 cents for $1 worth of benefits.
This gap was in large part a result of politics. Governments of different political stripes frequently enhanced benefits or limited premium increases without adequate consideration of the effects on the WSIB’s insurance fund. As the Auditor General observed in a 2009 report: The Workplace Safety and Insurance Board and the government face the least resistance from stakeholders when they keep premiums low (which satisfies employers) and benefits high (which satisfies workers). Over time, this can result in a large unfunded liability
The funding gap was exacerbated by the 2007-08 financial crisis which harmed the WSIB’s investment returns and worsened its financial position. The unfunded liability almost doubled in size from 2006 to 2008 alone
Another way to think about the unfunded liability is as an expression of the Workplace Safety and Insurance Board’s sufficiency ratiotipping point
whereby the WSIB’s capacity to generate sufficient funds to cover workers’ benefits could be brought into question
Figure 1.1: Workplace Safety and Insurance Board's sufficiency/funding ratio (%), 2000-2019
2000
2001
2002
2003
2004
2005
2006
2007
2008
2009
2010
2011
2012
2013
2014
2015
2016
2017
2018
2019
Source of Data: Ontario Workplace Safety and Insurance Board
The Ontario government responded to the WSIB’s deteriorating financial position with a regulatory directive in 2013 that stipulated a path to greater sufficiency in the insurance fund over the medium-term. Regulation 141/12 required the WSIB to achieve a prescribed sufficiency ratio according to the following timeline:
- 60% funding by the end of 2017
- 80% funding by the end of 2022 and
- 100% funding by the end of 2027
In response to the government’s regulatory directive, the WSIB implemented a Funding Sufficiency Plan to meet the prescribed targets as well as a new Funding Policy to guide its own pricing and funding decisions
One of the main consequences of the funding plan is that a portion of premium rates was dedicated to past claims costs
to pay down the unfunded liability. That is, the WSIB has collected more from employers than was required to cover a combination of the new claims costs and administration and used the additional revenues to reduce the unfunded liability.
The share of premium revenues dedicated to past claims costs has been considerable. One way to think about it is to break down the average premium rate (for every $100 of insurable earnings) to see the relative share dedicated to administration costs, new claims costs and past claims costs. The component dedicated to past claims costs peaked at $1.10 or 42.3% of the average premium rate in 2016 (see Figure 2.1). The inclusion of a component dedicated to past claims costs contributed to the WSIB imposing one of the highest premium rates in the country
Figure 2.1: Breakdown of the average Workplace Safety and Insurance Board premium rate ($), 2009-2019
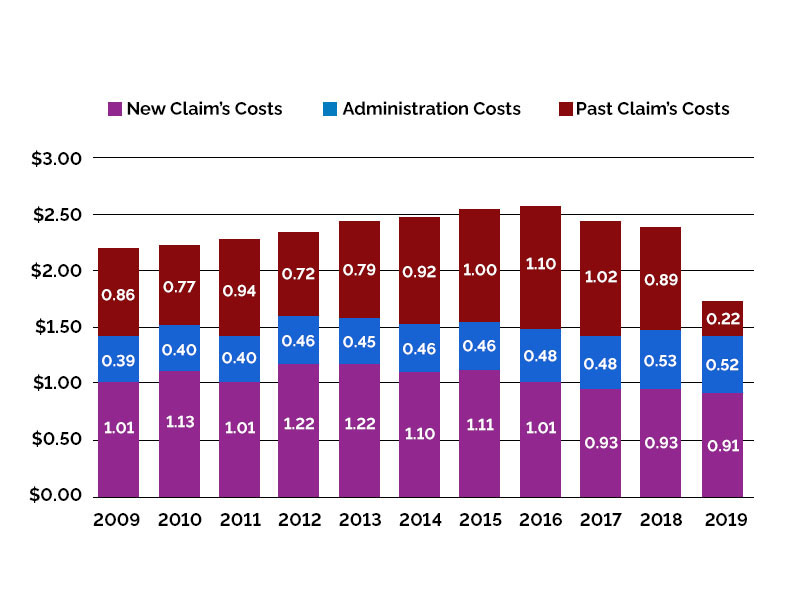
Source of Data: Ontario Workplace Safety and Insurance Board
A combination of factors – including the past claims costs (which was, according to the WSIB, the single greatest contributor
), strong investment returns, improvements in claims duration and fewer lost-time claims – contributed to steady progress on eliminating the unfunded liability faster than anticipated
As a result, it reduced employer premiums by 29.8% in 2019
Figure 3.1: Workplace Safety and Insurance Board's average premium rate, 2009-2020
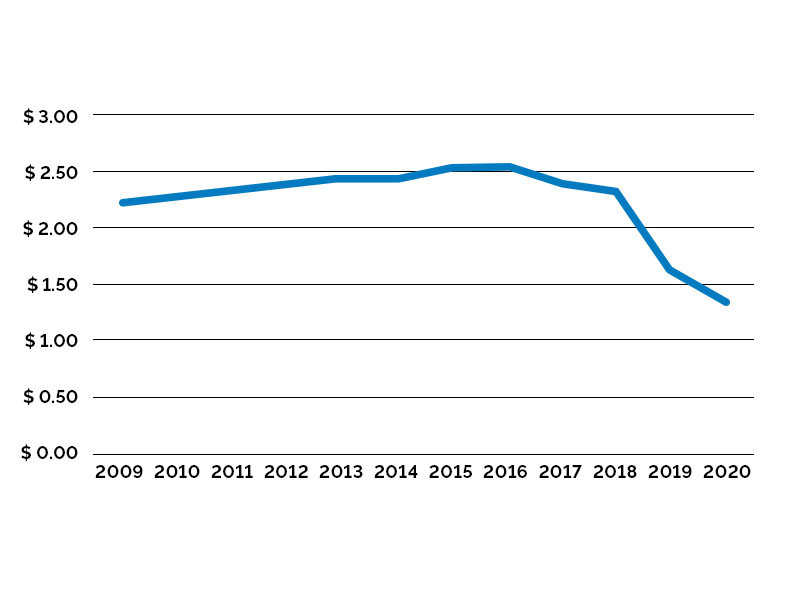
Source of Data: Ontario Workplace Safety and Insurance Board
Regulation 141/12, which prescribed an expectation that the WSIB achieve a 100% sufficiency ratio by 2027, does not provide direction about its funding plan after hitting the 100% target. That the WSIB has achieved a 100% sufficiency ratio several years earlier than directed has created policy uncertainty for employers, workers and the WSIB itself.
As will be discussed in Section 2, there is now an outstanding question about the right sufficiency target for the WSIB going forward to ensure that (1) it has sufficient resources to meet its obligations and withstand potential economic shocks and (2) it is not unduly extracting resources from the economy at the expense of investment and employment.
1.2 Workplace Safety and Insurance Board's funding policy and sufficiency ratio relative to other provinces
The Workplace Safety Insurance Act, 1997 (WSIA) requires that the WSIB maintain an insurance fund that is sufficient to meet its obligations under the act and to make payments for current and future benefits
The sufficiency ratio is thus a measure for assessing the WSIB’s capacity to meet its obligations and in so doing comply with the WSIA. The sufficiency ratio is defined as the WSIB’s total assets (less non-controlling interests) minus its liabilities. These calculations, including the treatment of assets and liabilities, are done in accordance with accepted accounting principles
As discussed earlier, the WSIB’s sufficiency ratio hit its nadir in 2011 when it fell well below 60%. It has since gone up as the unfunded liability was reduced and is now eliminated. At the end of the second quarter in 2019, the WSIB’s sufficiency ratio was 110.2%
The process for the Workplace Safety and Insurance Board's rate setting and adherence to its prescribed sufficiency ratio has been rooted in Regulation 141/12 and the WSIB's own funding policy. Approved in June 2013 and revised in 2015, the funding policy outlines the role of WSIB actors in determining its funding plan and the setting of premium rates. The implementation of the funding policy broadly aligns the WSIB with other major workers’ compensation boards in Canada Stanley, D. (2014).
The current funding policy is guided by five principles: (1) collective liability (2) fair and reasonable allocation of aggregate costs (3) stability of premiums (4) transparent and understandable and (5) financial security
While the Workplace Safety and Insurance Board’s funding plan has taken guidance from the government through Regulation 141/12, it ultimately has sole responsibility for rate-setting decisions as required by the WSIA. This responsibility includes approving the recommended target funding level required to ensure enhanced assurance of maintaining 100% sufficiency ratio…
The Workplace Safety and Insurance Board’s board of directors has final approval of rate-setting decisions following consideration of the chief actuary’s recommendations and the WSIB’s management’s advice and rationale. The board of directors is expected to consider Regulation 141/12, the funding policy, analysis and information from the chief actuary, and any other information deemed relevant to rate-setting decisions
As mentioned, the funding policy and the Workplace Safety and Insurance Board’s board of directors currently require enhanced assurance
in meeting its sufficiency target and not falling below a sufficiency ratio of 100%. Enhanced assurance represents a high degree of confidence in achieving the regulated sufficiency ratio requirements and maintaining full funding once reached, as determined by periodic asset-liability studies
This model, broadly speaking, is not unique to the Workplace Safety and Insurance Board. The concept of a sufficiency or funding ratio is common across workers’ compensation organizations across the country. Yet it can be somewhat difficult to compare their sufficiency ratios and overall experiences due to various contextual differences – including differences in employer coverage, the generosity of benefits and the composition of the economy. As such, each jurisdiction must determine the right funding level for its own circumstances.
Still, there is some scope to compare the current sufficiency ratios across the provinces and the different regimes in place to guide their funding plans. Presently every province has set a sufficiency target of either 100%, higher than 100%, or some range above 100% (see Table 1.1). As will be discussed, some provinces also have policies in place to guide “surplus distribution” when their funding level exceeds the target ratio.
| Province | 2017 Rate (FYE) | Target range |
|---|---|---|
| Newfoundland and Labrador | 131.6% | 100-120% |
| Prince Edward Island | 165.4% | 100-110% |
| Nova Scotia | 89.4% | Full-funding |
| New Brunswick | 102.2% | 110% |
| Quebec | 111.1% | 100% |
| Ontario | 95.8% | null |
| Manitoba | 148.8% | 130% |
| Saskatchewan | 139.9% | 105-120% |
| Alberta | 127.3% | 114-128% |
| British Columbia | 153.1% | 150% |
Source of data: Ontario Workplace Safety and Insurance Board
The key point is that the Workplace Safety and Insurance Board’s Funding Policy, its rate-setting process, and current sufficiency ratio are broadly consistent with other provinces. The main questions going forward relate to (1) avoiding a return to underfunding and (2) managing the risks of overfunding.
1.3 Workplace Safety and Insurance Board’s Rate Framework Modernization
Although the Workplace Safety and Insurance Board’s rate-setting process is unchanged, its broader rate framework is undergoing a significant modernization. The process to reform the rate framework started in earnest in 2014.
The case for reform was set out in the two external reports, Funding Fairness and Pricing Fairness, between 2012 and 2014. The basic argument was that WSIB’s processes for employer classification, premium rate setting and experience rating were complex, opaque and unpredictable.
The outgoing classification system, for instance, did not align with the standard North American Industry Classification System and instead used 155 separate rate groups. There have also been three separate experience-rating programs to incentivize workplace safety in different industries and among different sizes of firms. And the interaction of the two could have caused some firms to contribute too much to the collective liability relative to their workplace safety performance and others time too little based on their risk profiles. The result was a framework that was confusing for stakeholders, unfair for some industries and employers and inefficient for the WSIB to administer.
The rate framework modernization initiative was thus a multi-year exercise to improve the current WSIB process related to employer classification, premium rate setting and experience-rating programs. The goal of the initiative was to:
- establish a standardized and more consistent classification model to classify employers and set their premium rates
- incorporate stability measures to limit exposure and premium rate volatility, and provide for a gradual transition to the new framework
- recognize that individual employers in an industry represent different levels of risk due to investments in occupational health and safety; and
- provide a premium rate-setting approach that is simpler and more transparent
The Workplace Safety and Insurance Board’s board of directors approved the new rate framework in Fall 2016. It was implemented in January 2020.
The new rate framework replaces the current classification system with a new classification model based on the North American Industry Classification System and in so doing reduces the number of rate groups from 155 to 34. The rates for individual firms are set using a two-step approach:
- The first step involves setting an average rate for each industry class based on their risk profile and share of responsibility to maintain the insurance fund
- The second step involves adjustments to the rate for individual businesses depending on how the business’s claim history compares to the rest of the businesses in its rate group
The goal of this two-step approach is to ensure businesses are paying a fair rate that is reflective of both their industry and individual experience. One might think of it as a balance between collective liability and firm-level risk profiles.
The model shares some similarities with several other provinces, including Alberta, British Columbia, Manitoba, New Brunswick, Prince Edward Island, and Saskatchewan. These provinces also set premiums based on an industry class as well as an employer’s individual experience-rating compared to other employers in their industry class
The new rate framework will be implemented over a multi-year transition. This will smooth the impact on the minority of firms who experience rate increases as a result of joining a new rate group
As the next section will discuss, the Workplace Safety and Insurance Board and the government will now need to carefully monitor the transition process to ensure that it is implemented smoothly and does not produce inadvertent consequences such as a greater incidence of claim suppression.
1.4 Workplace Safety and Insurance Board’s coverage relative to other provinces
Related to the rate framework is the breadth of the WSIB's insurance coverage in Ontario’s economy. The question of mandatory coverage is the subject of considerable attention and debate among stakeholders. It is only likely to grow in light of the transition away from industrial employment and the rise of the so-called gig economy
in particular and new, informal employment arrangements in general. It is worth unpacking the current state of the WSIB's insurance coverage and how it compares to other provinces.
Roughly 77% of the province’s work force is subject to a combination of mandatory and opt-in coverage
Schedule 1 employers are subject to collective liability, are part of a collective insurance fund, and pay premiums to the WSIB. In turn, they are relieved of individual responsibility for actual claims costs since the WSIB pays benefits to workers affected by workplace injuries or illness.
Schedule 2 employers are subject to the individual liability scheme and pay the full benefit costs of each claim as an ongoing liability plus the administrative costs to process and manage them. The Schedule 2 model applies to a limited number of industries including: railways, federally-regulated telephone companies, airlines, municipalities, school boards and the provincial government
The vast majority of employers and workers covered by Workplace Safety and Insurance Board fall thus into the Schedule 1 category (see Table 2.1).
| Schedule Type | 2009 | 2010 | 2011 | 2012 | 2013 | 2014 | 2015 | 2016 | 2017 | 2018 |
|---|---|---|---|---|---|---|---|---|---|---|
| Schedule 1 Employers |
249,162 | 250,536 | 251,827 | 255,474 | 287,195 | 299,339 | 307,959 | 311,922 | 316,387 | 318,726 |
| Schedule 2 Employers |
634 | 611 | 606 | 600 | 602 | 600 | 579 | 581 | 581 | 590 |
Source of data: Ontario Workplace Safety and Insurance Board
Overall, the WSIB covers roughly 5.6 million of approximately 7.4 million workers in the province
| Schedule Type | 2009 | 2010 | 2011 | 2012 | 2013 | 2014 | 2015 | 2016 | 2017 | 2018 |
|---|---|---|---|---|---|---|---|---|---|---|
| Schedule 1 Employment |
3,932,241 | 4,009,201 | 4,128,939 | 4,239,440 | 4,361,029 | 4,431,674 | 4,556,888 | 4,621,929 | 4,719,183 | 4,840,081 |
| Schedule 2 Employment |
700,205 | 702,383 | 695,358 | 694,335 | 698,452 | 690,942 | 700,153 | 714,636 | 730,604 | 751,971 |
Source of data: Ontario Workplace Safety and Insurance Board
The remaining employers and workers belong to what are sometimes referred to as non-mandatory covered industries.
But that is not precisely correct. It is more accurate to describe them as uncovered business activities within the 34 covered industries.
We know a bit about these approximately 1.7 million workers. Nearly 60% of them, for instance, are employed in finance and insurance, health care and social assistance, and professional, scientific and technical services
We do know, however, how the Workplace Safety and Insurance Board’s coverage compares to other provinces. Ontario has the third-lowest level of coverage in the country. Its coverage rate is roughly 10% points lower than the national average (see Table 4.1).
| Province or Territory | Workforce covered (percentage) |
|---|---|
| Newfoundland and Labrador | 97.4% |
| Prince Edward Island | 97.7% |
| Nova Scotia | 74.9% |
| New Brunswick | 91.4% |
| Quebec | 92.6% |
| Ontario | 76.5% |
| Manitoba | 78.8% |
| Saskatchewan | 75.8% |
| Alberta | 82.6% |
| British Columbia | 97.2% |
| Yukon | 96.4% |
| Northwest Territories and Nunavut | 97.0% |
Source of data: Ontario Workplace Safety and Insurance Board
Understanding the source of Ontario’s differing coverage levels relative to the other provinces requires a brief historical explanation. Many of the non-mandatory covered industries were not included in mandatory coverage at the WSIB's origins. The rationale is difficult to know at this stage. But it would seem that Sir William Meredith and the government of the day believed that a comprehensive scheme would face too much political resistance
Instead, then, the Workplace Safety and Insurance Board model was created based on what is known as an inclusionary administrative framework
which means that industries must be actively included in regulation in order to be subject to mandatory coverage and a board-level policy must identify each covered business activity. The WSIB's responsibility is to classify employers in accordance with Regulation 175/98 that prescribes the coverage status of industries
Ontario and Nova Scotia are the only two provinces or territories with an inclusionary model. Elsewhere the default is that industries are subject to mandatory coverage unless they are actively excluded through government regulation.
As will be discussed in Section 2, the inclusionary model — including the requirement to actively classify hundreds of specific business activities within each industry — can produce various challenges. The process can lack a principle-based framework and the result is similar occupations can be treated differently due merely to historical circumstances or a lack of responsiveness in legislation or regulation. There are also concerns that certain business activities can fall through the cracks
or new businesses are not dealt with in a timely fashion.
1.5 Current state of claims, types of claims, and claims duration
The Workplace Safety and Insurance Board’s core function is to adjudicate and manage insurance claims from workers and employers. It is worthwhile therefore to spend some time understanding the current state of claims, including the number and types of claims and their duration.
The Workplace Safety and Insurance Board has received an average of nearly 240,000 new claims per year since 2009. More than 80% of them are from Schedule 1 employers (see Table 5.1).
| Schedule type | 2009 | 2010 | 2011 | 2012 | 2013 | 2014 | 2015 | 2016 | 2017 | 2018 |
|---|---|---|---|---|---|---|---|---|---|---|
| Schedule 1 Registered claims |
207,296 | 198,617 | 196,449 | 195,128 | 194,393 | 195,495 | 192,077 | 193,214 | 199,870 | 210,828 |
| Schedule 2 Registered claims |
40,566 | 39,781 | 39,366 | 38,108 | 37,856 | 38,150 | 37,247 | 37,719 | 39,175 | 43,163 |
Source of data: Ontario Workplace Safety and Insurance Board
To put these figures in some perspective, there were 767,146 claims reported across the provinces and territories in 2017. Ontario made up roughly one-third of them (see Table 6.1).
| Province and Territory | Reported claims (#) |
|---|---|
| Canada | 767,146 |
| Newfoundland and Labrador | 12,254; |
| Prince Edward Island | 3,875 |
| Nova Scotia | 24,552 |
| New Brunswick | 22,659 |
| Quebec | 116,685 |
| Ontario | 239,045 |
| Manitoba | 35,931 |
| Saskatchewan | 28,650 |
| Alberta | 125,432 |
| British Columbia | 152,912 |
| Yukon | 1,727 |
| Northwest Territories and Nunavut | 3,424 |
Source of data: Ontario Workplace Safety and Insurance Board
It is notable that the number of WSIB claims is rising since 2015. They have gone up by more than 10% over this period after 7 years of minimal year-over-year change. The cause is difficult to fully discern. There has not been a spike of one particular type of claim.
Claims duration have also increased since 2015. As of Q3 2019, 5.9% of lost-time claims
were still receiving benefits after 12 months which is up from 3.7% in 2015. Additionally, the number of lost-time claims still on benefits at the 24-month and 48-month marks have also increased during this period
This is a useful place to emphasize that not all claims therefore are equal with respect to the time and costs associated with administering them or their possible duration. Remember every workplace injury for a covered employer and its workers must be registered with the WSIB irrespective of the nature of the incident or injury.
Most claims are referred to as no-lost-time
claims. This means that an incident or injury was registered but the affected worker did not miss work as a result. Think of someone requiring a small number of stitches but who can return to work the following day. More than two-thirds of claims are no-lost-time claims. Another 16% of claims involve time loss of less than 5 days. Basically, 85% of claims involve workers who are back to work in less than a week with minimal support. The WSIB considers these cases low risk.
The high-risk
cases are those who miss more than one month of work due an incident or injury. These cases represent about 7% of overall cases. They require a much wider range of supports including health care services and Return-to-Work programming (see Figure 4.1).
Figure 4.1: Annual Workplace Safety and Insurance Board claims based on lost time (%), 2018
No-lost time
1-5 days
6-14 days
15 days - 1 month
1-3 months
more than 3 months
Source: Ontario Workplace Safety and Insurance Board
The Workplace Safety and Insurance Board has approved an average of roughly 78% of annual claims since 2009. There has been a perception among some stakeholders that more claims were rejected as part of the effort to reduce the unfunded liability. But the data indicate that the approval rate has been broadly consistent over this period. Two-thirds of these are no-lost-time claims which have remained a mostly constant share of approved claims since 2009 (see Table 7.1)
| Claims | 2009 | 2010 | 2011 | 2012 | 2013 | 2014 | 2015 | 2016 | 2017 | 2018 |
|---|---|---|---|---|---|---|---|---|---|---|
| Allowed lost-time claims | 64,843 | 60,200 | 56,672 | 55,525 | 54,430 | 53,688 | 51,570 | 57,368 | 59,529 | 64,855 |
| Allowed no-lost-time claims | 131,843 | 123,852 | 123,675 | 124,019 | 125,328 | 125,524 | 122,133 | 121,505 | 126,251 | 129,759 |
| Total | 196,686 | 184,052 | 180,347 | 179,544 | 179,758 | 179,212 | 173,703 | 178,873 | 185,780 | 194,614 |
Source of data: Ontario Workplace Safety and Insurance Board
The Workplace Safety and Insurance Board’s record on meeting targets for processing timelines is reasonably good. It has set a goal of reaching an initial entitlement decision within 10 days of a claim’s registration and the organization reports that it meets this target in 86% of cases
The truth is the Workplace Safety and Insurance Board’s record on more lost-time claims in general complex claims in particular is more mixed. This represents a challenge especially since complex claims such as occupational disease and mental health claims are becoming more common. Mental stress cases, for instance, more than doubled between 2016 and 2018
As a submission from the Christian Labour Association of Canada (CLAC) observed: The single greatest issue in the WSIB system today is delays in processing claims.
This sentiment was expressed by various stakeholders from across the spectrum. It is clear from the review’s consultations that there is no more fundamental issue for the WSIB than to improve its capacity to better discharge its main function which is to adjudicate and administer claims. The next section of the report will address this issue in greater detail.
1.6 Workplace Safety and Insurance Board’s claims and adjudication process
The most common theme or issue in the review’s consultations was concerns about the WSIB's claims and adjudication process. Common frustrations expressed by stakeholders include:
- difficulty navigating the Workplace Safety and Insurance Board due to its complexity
- limited and one-sided communication channels
- outdated technology
- over-emphasis on and strict adherence to policies and procedures and
- long wait times
These concerns were virtually universal. Everyone from the Canadian Federation of Independent Business to the Ontario Federation of Labour agrees. It is reflected in data comparing service performance among workers’ compensation boards across the provinces. One example: Ontarians wait longer to receive payment after injury than anywhere else in the country except for New Brunswick
The Workplace Safety and Insurance Board recognizes that its model for claims and adjudication requires modernization. It is a highly antiquated system that is not only far behind the private sector but lags other provincial agencies as well.
The result is that the processes for claims submission and adjudication are inefficient, costly and, most importantly, difficult for those individuals affected. Just consider that the WSIB received 5.8 million telephone calls and 1.9 million faxes in 2018. That amounts to an average of 21,385 telephone calls and 7,057 faxes per day
These telephone calls and faxes are typically coming from people in their most vulnerable circumstances who have been injured and need help. They may be facing serious financial insecurity or dealing with mental health challenges. Yet basic answers like have you received my claim?
or what is the timeframe for payment?
can only be provided via telephone during working hours.
As the Office of the Worker Adviser noted in their submission to the review:
In reviewing the operations of the Workplace Safety and Insurance Board, it is also important to consider the unique situation of injured workers. By definition, they are injured. Their health, livelihood and sense of self is often at stake in a claim. Most injured workers are in some form of financial, emotional or psychological distress. Furthermore, injured workers rightly view the workplace insurance system as a justice system with all the guarantees that entails. None of them have chosen to become involved in the system.
The Workplace Safety and Insurance Board’s Core Services Modernization Initiative aims to improve these challenges and in so doing better respond to the people and circumstances described above. It represents a primarily technological solution to the ongoing problems with claims and adjudication. The plan is to transform the basic platform for claims and adjudication over the next three years and ultimately to provide a simpler, more responsive, and individualized model for workers and employers. This is a multi-year project that will require a significant investment of resources and attention. It will be the subject of funding approval and ongoing oversight by the WSIB's board of directors.
The Workplace Safety and Insurance Board model is presently a highly-labour intensive one with fewer claims per employee handled than virtually any other workers’ compensation board in the country. This is mainly a function of a failure to leverage technology and in so doing better target resources to the types of cases that are the most complex.
As previously observed, 67% of WSIB claims are no-lost-time claims. Another 16% involve lost time of less than 5 days. Only 7% of claims are described as high-risk claims
which means that they involve lost time of one month or longer
Yet presently the Workplace Safety and Insurance Board’s claims and adjudication models basically treat all claims the same. The goal of the Core Services Modernization Initiative is to automate and provide self-service for low-to-moderate risk cases. Then the organization can dedicate resources — including its most senior staff — to the relatively small number of high-risk claims that ultimately drive costs for the organization and generate public and political attention.
The path that the Workplace Safety and Insurance Board is on broadly makes sense. But technology and process changes may not be enough to fully address stakeholder concerns. There may be a need for organizational and structural reforms as well.
One area that might benefit from such reform is the appeals process. There is currently both an informal reconsideration appeal as well as a formal appeal layer at the WSIB as well as the final level of appeal at the Workplace Safety and Insurance Appeals Tribunal (described in greater detail below). If a party disagrees with a decision, they can ask for the decision to be reconsidered by the WSIB staff at the operating level where the initial decision was made. If the initial decision is affirmed, a party can appeal to the Appeals Services Division, which is the formal level of appeal at the WSIB. Decisions at this level are overseen and decided by an appeals resolution officer and are independent of the reconsideration at the operating level. Roughly 15 to 18% of appeal cases at the division level are by oral hearing.
The number of appeals with the Appeals Services Division increased by 5% last year
These internal processes for reconsideration and appeal at the WSIB are not subject to the same timeline standards as initial entitlement decisions. The process can be slow and complicated, and the review finds that the outcomes are not generally much different than the initial decision. The Appeals Services Division’s rate of allowance for claims is roughly 33% which has been consistent since 2014. This year the division has allowed 20.5% of appeals in full and 12.8% of appeals in part
A frequent comment in the review’s consultations was that justice delayed is justice denied.
Multiple layers of reconsideration and appeal that are both slow and do not generally produce different results for workers and employers may not provide the swift justice that stakeholders are searching for. As the next section will discuss, streamlining the appeals process within the WSIB and expanding resources to the Workplace Safety and Insurance Appeals Tribunal in order to enable it to hear more cases may be a more efficient and ultimately just model.
More generally, the Core Services Modernization initiative will need to be managed carefully and transparently to minimize the risks of cost overruns or service disruption and ultimately secure buy-in from stakeholders. There is presently a degree of theoretical support but practical skepticism on the WSIB's ability to deliver and the benefits that will purportedly derive from the new system. Section 2 will discuss these considerations in greater detail.
1.7 Workplace Safety and Insurance Board’s auditing activities
Related to the claims process is the question of claim suppression and the WSIB's auditing activities. Claim suppression refers to actions undertaken by an employer that hinder the appropriate reporting of a worker’s injury or illness resulting from work
Such actions can come in the form of incentives such as paid short-term leave or a deterrent such as the threat of sanction or dismissal.
Some stakeholders — particularly labour unions — believe that claim suppression is a real problem in the Workplace Safety and Insurance Board model. They attribute the increasing use of experience rating as a heightened incentive for employers to under-report workplace incidents.
Various reports and studies have sought to understand the magnitude of claim suppression in the province. It is difficult to quantify it but there certainly seems to be evidence that it is present in the system. A 2013 report, produced in response to Harry Arthurs’ review, for instance, concluded that claim suppression appears to be a real problem
and it is unlikely that claim suppression is restricted to a small number of anecdotal cases
Assuming that this conclusion is correct, it is a problem for various reasons, but namely because it offends the basic premise of the WSIB's no-fault model. Injured workers should have access to the Workplace Safety and Insurance Board's benefits and services as a matter of principle. That is the whole purpose of the WSIB's model.
In December 2015, Bill 109 amended the Workplace Safety Insurance Act, 1997 to provide new powers to investigate and penalize claim suppression. In particular, it granted the legal authority for a new system of administrative monetary penalties for claim suppression
- $5,000 for each of the first, second and third contraventions
- $7,500 for each of the fourth, fifth and sixth contraventions
- $10,000 for each subsequent contravention. These new penalties, outlined in Regulation 175/98
footnote 50 , were developed in 2016 and took effect in January 2018. The Workplace Safety and Insurance Board has developed a risk-based auditing model to investigate employers who are most likely to engage in claim suppression. The model considers different factors such as a high percentage of no-lost-time claims with high health-care costs or low injury rates compared to their rate group average in order to target its auditing activities.
The Workplace Safety and Insurance Board is in the process of consolidating its revenue-related audits and its claim suppression audits over the next two years into a new one-touch model
whereby auditors are able conduct both types of audits concurrently. It should enable them to expand the number of claim suppression audits.
The overall target for audits in 2019 is 2,500. This is down considerably relative to the WSIB's past record. The organization’s rationale is that the risk-based model is more focused and targeted. But the number of claim suppression audits (what the WSIB refers to as employer accident report audits
) will still be far fewer than the revenue-related audits (what the Workplace Safety and Insurance Board refer to as employer revenue audits
).
As the next section will discuss, there is scope to follow through with the risk-based model which is more efficient than the Workplace Safety and Insurance Board's past auditing practices and still expands its capacity to identify and penalize claim suppression. This will be particularly important as the new rate framework’s experience-rating model is implemented.
1.8 Broader occupational health and safety ecosystem
The Workplace Safety and Insurance Board is only one component of the broader occupational health and safety ecosystem in the province. Other organizations including the Ministry of Labour, Training and Skills Development, a network of health and safety associations, industry associations, labour unions, researchers and civil society groups are also involved in promoting workplace safety and supporting workers and employers in the system.
The Workplace Safety and Insurance Board is a major part of this ecosystem, however, in part through its promotion activities (including the incentives inherent in its experience-rating programs and its newly-developed Health and Safety Excellence Program) and in part because the premiums it collects ultimately fund much of the rest of the organizations and activities that support the Ontario government’s broader occupational health and safety goals. The WSIB effectively functions as both a player in the health and safety ecosystem and its ultimate funder.
One cannot evaluate WSIB, then, without considering the broader ecosystem and vice versa. The two are inextricably linked because of the relationship between health and safety programming and enforcement and the Workplace Safety and Insurance Board's insurance model as well as the role of premium-based, systemic funding.
The ecosystem can be complicated for workers and employers to understand or navigate. The Ministry of Labour, Training and Skills Development refers to each of the players as system partners.
But each of the organizations is autonomous and has its own mandate and stakeholders. Understanding the ecosystem and its component parts is therefore key to determining how the system works together, whether it is adequately financed, and if there are any gaps that require adjustments or reform.
Office of the Worker Adviser and Office of the Employer Adviser
The Office of the Worker Adviser (OWA) and the Office of the Employer Adviser (OEA) are operational agencies within the Ministry of Labour, Training and Skills Development that provide support to workers and employers, respectively, who are navigating the occupational health and safety system.
The Office of Worker Adviser provides representation, advice, and education to non-unionized workers with respect to their WSIB cases
As of 2018, the OWA had an annual budget of $11.39 million and a staff complement of 97
The Office of Worker Adviser and Office of the Employer Adviser have similarly both experienced rising demand for their services. The OWA’s case load in 2018 was 2,535
It is worth noting, for instance, that the Office of Worker Adviser and Office of the Employer Adviser have broad support among stakeholders. The OWA reports a client satisfaction rate of 97%
Workplace Safety and Insurance Appeals Tribunal
The Workplace Safety and Insurance Appeals Tribunal (WSIAT) is an independent agency under the Ministry of Labour, Training and Skills Development that considers appeals to final decisions made by the WSIB. Section 123 (1) of the Workplace Safety Insurance Act, 1997 gives the tribunal jurisdiction to rule on both entitlement questions — that is, whether a worker is entitled to a given compensation — and revenue questions — that is, whether a given employer should be included in a particular schedule or rate group and have a specific premium rate
Ontario is not the only province with such an appeals tribunal. Most provinces in Canada have similar external appeal bodies that act as the final arbitrator on workers’ compensation issues
The Workplace Safety and Insurance Appeals Tribunal’s annual budget is approximately $22 million
Appeals to Workplace Safety and Insurance Appeals Tribunal can be registered by workers or employers and can cover issues ranging from entitlement decisions to premium rates to rate groups. Appeals heard by the WSIAT's must first go through the WSIB’s own appeals processes described above. While WSIAT's is required to apply WSIB policy in its decision-making
Workplace Safety and Insurance Appeals Tribunal hearings are typically held with one vice-chair presiding but also can involve tripartite panels comprised of a vice-chair and a worker and employer representative depending on the case and its circumstances. Roughly 60% of hearings are conducted using the former model and the other 40% involve panels
Presently over 70% of hearings are conducted in-personpaperless hearings
to minimize the burden on workers and employers (particularly those located outside major centres) and to realize efficiencies for the tribunal.
At the end of 2018, the WSIAT had 4,018 active cases which represents a one-third reduction over the previous year. The timeline for a hearing had also been cut from 16.6 months to 10.9 months over this period
One of the contributing factors to the Workplace Safety and Insurance Appeals Tribunal's backlog is the lengthy timeline for a hearing to be held. For those who pursue an appeal to the WSIAT, it takes, on average, 28 months between the filing of an initial claim to the WSIB and ultimately having a WSIAT hearing. This timeline can represent a real challenge for those facing financial insecurity.
Applicants are allowed up to 24 months between first submitting a notice of appeal to the Workplace Safety and Insurance Appeals Tribunal and submitting a confirmation of appeal form which prompts a scheduling of a hearing. This gap provides the applicant a two-year window to gather and provide documentation necessary for a hearing. But it also contributes to long delays in the appeals process. This is unique among appeal tribunals in Canada. The British Columbia Workers’ Compensation Appeal Tribunal, for instance, has far shorter waiting periods for requests of information — as few as 21 days
The review’s consultations heard that a major source of these delays is due to the capacity of those representing workers and employers in the system. Tighter timeframes for appeals (including the submission of supporting documents) would put pressure on lawyers, paralegals, union representatives, and others who act as representatives in these processes. There must therefore be a balance between swift decision-making and fair opportunity for individuals to properly make their case to the tribunal.
It is notable that the Workplace Safety and Insurance Appeals Tribunal's rate of overturning Workplace Safety and Insurance Board decision is high. Evidence provided by the WSIB indicates that the allowance rate for Workplace Safety and Insurance Appeals Tribunal decisions is roughly 55 to 66%: 33 to 38% of appeals are allowed in full and another 20 to 33% are allowed in part
Office of the Chief Prevention Officer
The Office of the Chief Prevention Officer was established inside the Ministry of Labour, Training and Skills Development in 2012 in order to oversee and coordinate prevention-related activities across the province. The office is led by a chief prevention officer whose position is the equivalent of an assistant deputy minister. It is advised by a prevention council representing some of the largest stakeholders in the health and safety system
The prevention office’s mandate for promoting and supporting injury prevention is mostly delivered through transfer payments to six health and safety associations. The next sub-section provides more information about the health and safety associations and their role in prevention.
The Prevention Office’s activities — including its transfer payments to the health and safety associations (described below) — are funded from WSIB premiums. Overall spending on prevention totaled approximately $113 million in 2018-19 (see Figure 5.1). Roughly 80% is directed to the health and safety associations. The remaining amounts cover the operating costs of the Prevention Office and some health and safety research.
Figure 5.1: Ministry of Labour, Training and Skills Development’ expenditures on workplace injury prevention, 2012-13 to 2019-20 ($millions)footnote 72 .
2012-13
2013-14
2015-16
2016-17
2017-18
2018-19
2019-20
Source of Data: Ontario Workplace Safety and Insurance Board
Ontario’s spending on occupational health and safety (including prevention) is consistent with the other provinces and territories. Most of them are clustered around the same level of spending measured as a share of $100 per assessable payroll. The national average is $0.10. Ontario is $0.11 (see Figure 6.1). This clustering across the province is not unique to Canada either. Research by the Institute for Health and Work in 2010 found that most developed jurisdictions spending roughly the same proportion on prevention-related activities
Figure 6.1: Occupational health and safety expenditures per $100 of assessable payroll by province and territory, 2017
Canada
Newfoundland and Labrador
Prince Edward Island
Nova Scotia
Quebec
Ontario
Manitoba
Saskatoon
Alberta
British Columbia
Yukon
Northwest Territories and Nunavut
Source of Data: Ontario Workplace Safety and Insurance Board
It is worth noting that the Ministry of Labour, Training and Skills Development’s own health and safety activities — including enforcement — are also funded from WSIB premiums. The ministry is projected to recover over $100 million from the WSIB for prevention activities and $230 million overall in 2019-20. These activities are outside the scope of this review. But it is important that ministry’s budget is subject to the same internal scrutiny by the Ministry of Finance and the Treasury Board Secretariat as it would be if its full costs were being charged to general revenues.
More generally, there are ongoing questions about the effectiveness of the province’s prevention model. The function has moved from the WSIB to the ministry and back at various points over the years and has been subject to independent reviews along the way. The crucial challenge remains that the various component parts have their own missions and mandates as well as unique stakeholders, and therefore it can be difficult to achieve system-wide coherence. The Prevention Office has sought in recent years to improve coordination but stakeholders in the review’s consultations and written submissions observed that there are ongoing issues in pulling [the different organizations] together.
There are also questions about financial accountability and the use of WSIB premiums to finance the entire prevention system. Relying on premiums as opposed to general revenues can theoretically preclude the typical budgetary trade-off considerations or outcome-based orientation that informs public spending. One stakeholder expressed concerns that the WSIB is treated like a piggy-bank
without an adequate role for evaluation and results. The relationship between prevention spending and workplace outcomes is mostly qualitative as opposed to outcome-based metrics related to Ontario’s record of workplace safety.
This concern is exacerbated by the fact that while the ministry’s health and safety activities (including prevention) span the entire economy, it is only those employers subject to mandatory WSIB coverage who are paying for them. In effect, 77% of employers are paying 100% of the costs. This issue was noted in the 2010 report chaired by Tony Dean and the 2012 report produced by Harry Arthurs and was a frequent observation in the review’s consultations and written submissions including by groups ranging from the Compensation Employees Union to the Ontario Business Coalition
This, of course, is not to say that prevention-related activities are not useful or should not be part of an overall occupational health and safety system. But, as will be discussed in the Section 2, there is a need for greater measurement and transparency to ensure that these activities are producing results and the system is ultimately more accountable.
Health and safety associations and workplace injury prevention in Ontario
As described above, the WSIB plays a considerable role in injury prevention through its newly-developed Health and Safety Excellent Program and financing of the broader ecosystem. But most of the work is currently carried out by six health and safety associations (HSAs) on behalf of the chief prevention officer. These arm’s-length, non-profit organizations play such a critical role in the province’s prevention-related activities that it is worth outlining their models and functions.
There are four HSAs that are focused on specific sectors of Ontario’s economy. These associations provide workplace health and safety training, education, and consulting services to employers in their respective sectors. These HSAs are:
- Infrastructure Health and Safety Association (IHSA) – including construction, electrical, utilities, aggregates, transportation, read-mix concrete, and natural gas
- Public Services Health and Safety Association (PSHSA) – including health and community care, education and culture, provincial and municipal government and public safety
- Workplace Safety North (WSN) – including forestry, mining, pulp and paper and printing
- Workplace Safety and Prevention Services (WSPS) – including agriculture, industrial, manufacturing and services
There are also two, non-sectoral health and safety associations:
- Occupational Health Clinics for Ontario Workers (OHCOW) – focused on studying, treating and identifying occupational disease in the workplace
- Workers Health and Safety Centre (WHSC) – focused on training workers, supervisors and employers in workplace health and safety
Public funding for the six Health and Safety Associations is determined on annual basis by the Office of the Chief Prevention Officer and is delivered in the form of transfer agreements. This annualized process does not provide much scope for multi-year planning (including acquiring training equipment or other capital assets) and requires the HSAs to dedicate considerable resources to managing the funding renewal process. It is an inefficient funding model.
Cumulatively the six health and safety associations are receiving $80 million in provincial funding in 2019-20. This is about $12 million less than the overall average since 2012-13 (see Figure 7.1).
Figure 7.1: Annual provincial funding for the health and safety associations, 2012-13 to 2019-20 ($millions)
2012-13
2013-14
2014-15
2015-16
2016-17
2017-18
2018-19
2019-20
Source of Data: Ontario Workplace Safety and Insurance Board
The Health and Safety Associations are a major source of workplace health and safety training in Ontario. The most recent estimate (based on a sample of certain health and safety certifications) is that they provide 53.2% of all such training across the province through a combination of public and private funding
Figure 8.1: Annual funding from the Ministry of Labour, Training and Skills Development for the Health and Safety Associations, 2018-19 ($millions)
Infrastructure Health and Safety Association
Public Services Health and Safety Association
Workplace Safety North
Workplace Safety and Prevention Services
Occupational Health Clinics for Ontario Workers
Workers Health and Safety Centre
Source of Data: Ontario Workplace Safety and Insurance Board
In addition to their core services, some Health and Safety Associations such as Workplace Safety North and Occupational Health Clinics for Ontario Workers have also assumed responsibilities for other government-mandated initiatives with separate transfer agreements with the Ministry of Labour, Training and Skills Development or other parts of the government. Workplace Safety North’s Mine Rescue program, which provides equipment for employers, training for mine rescues and operates an annual mine rescue competition, is now a regulatory requirement for mining companies operating in the province. Similarly, OHCOW is involved in two government-funded investigations: an investigation of conditions at GE Peterborough due to an emerging disease cluster, and the McIntyre powder project identifying those suffering from the effects of aluminum dust inhalation.
And, as discussed, the HSAs also rely on fee-for-service activities on behalf of private sector clients. The review’s consultations found that the Health and Safety Associations are increasingly relying on this model to offset flat-lined or declining public funding. This provides some evidence of the market-driven demand for their services.
But it is also important to observe that there is an increasingly robust supply of other health and safety consultation and training services available to Ontario-based employers. Previous reports have highlighted the emerging role of alternative providers such as private consultants or industry associations or even labour unions in the marketplace
Overall, private consultants appear to be approximately as large as health and safety associations in terms of the number of front-line staff available to deliver occupational health and safety services and the number of employers to whom service is provided. Survey evidence suggests that private consultants play an important role in the small employer segment of the occupational health and safety services market. This could be an important consideration in formulating a strategy to increase the availability of services to these employers
footnote 77 .
This should not be interpreted as a criticism of the health and safety associations model. The review’s consultations demonstrated that the HSAs have highly-specialized staff and provide highly-specialized services for different sectors. But, as the next section will discuss, they also provide more generalized services where there seems to be an increasingly robust market-based supply and for which a government-provided monopoly (which is a function of the transfer agreements) may be difficult to justify. The challenge for policymakers is to identify which aspects of the HSAs business model is solving for a market failure
and which parts could be served by a more open, competitive market.
Conclusion
Section 1 has largely refrained from analysis or recommendations. It has mostly focused on describing the current issues and trends facing the Workplace Safety and Insurance Board. The goal has been to provide readers with an independent sense of the progress that the WSIB has made over the past 10 years or so, but also to begin to draw attention to the opportunities and challenges that the organization will need to confront in the coming years. Time does not sit still. And neither can the Workplace Safety and Insurance Board.
Footnotes
- footnote[2] Back to paragraph Weiler, P. C. (1980). Reshaping Workers’ Compensation for Ontario.
- footnote[3] Back to paragraph Arthurs H. (2012). Funding Fairness: A Report on Ontario’s Workplace Safety and Insurance System.
- footnote[4] Back to paragraph Stanley, D. (2014). Pricing Fairness: A Deliverable Framework for Fairly Allocating WSIB Insurance Costs.
- footnote[5] Back to paragraph Expert Advisory Panel on Occupational Health and Safety (2010). Expert Advisory Panel on occupational health and safety
- footnote[6] Back to paragraph Workplace Safety and Insurance Board. (2015). Workplace Safety and Insurance Board Funding Policy
- footnote[7] Back to paragraph Office of the Auditor General of Ontario (2009). 2009 Annual Report of the Office of the Auditor General of Ontario: Unfunded Liability of the Workplace Safety and Insurance Board
- footnote[8] Back to paragraph Ibid
- footnote[9] Back to paragraph Ministry of Labour, Training and Skills Development. (2019, September 24). Elimination of the Unfunded Liability Charge to Employers to Provide More Money for Jobs & a Strengthened Economy
- footnote[10] Back to paragraph The WSIB switched from reporting the unfunded liability as a “funding ratio” to “sufficiency ratio” following the implementation of Regulation 141/12 in January 2013. Both sufficiency and funding ratio are measures of the WSIB’s assets to liabilities and are expressed as a percentage. But they involve different accounting practices. Funding ratio is presented according to International Financial Reporting Standards. The sufficiency ratio is presented in accordance with Ontario regulation with its assets and liabilities reflecting investment and pension liabilities calculated on an on-going basis and are presented according to accepted accounting practices. The differences in measurement produce slightly different figures. For instance, in Q2 2017, the funding ratio was 92.4% and the sufficiency ratio was 91.8%. Per regulation, the WSIB focuses on its sufficiency ratio in its reporting. Most provinces still call it “funding ratio” in their reporting. But the methods of WSIB’s sufficiency ratio is comparable with methods of other workers’ compensation boards across the country.
- footnote[11] Back to paragraph Arthurs H. (2012). Funding Fairness: A Report on Ontario’s Workplace Safety and Insurance System
- footnote[12] Back to paragraph Workplace Safety and Insurance Board. (n.d.). Sufficiency Plan and Funding Policy
- footnote[13] Back to paragraph Office of the Auditor General of Ontario (2009). 2009 Annual Report of the Office of the Auditor General of Ontario: Unfunded Liability of the Workplace Safety and Insurance Board
- footnote[14] Back to paragraph Workplace Safety and Insurance Board. (2018). From Tipping Point to Turning Point: How the WSIB eliminated the Unfunded Liability.
- footnote[15] Back to paragraph Ibid
- footnote[16] Back to paragraph Workplace Safety and Insurance Board. (2019). 2018 Annual Sufficiency Report
- footnote[17] Back to paragraph Workplace Safety and Insurance Board. (2018). 2019 Premium Rates Manual: Part 1, Section 1-5.
- footnote[18] Back to paragraph Workplace Safety and Insurance Board. (2019). 2020 Premium Rates
- footnote[19] Back to paragraph Workplace Safety and Insurance Act, 1997 (S.O. 1997, c. 16, Sched A).
- footnote[20] Back to paragraph Ontario Regulation 141/12 made under the Workplace Safety and Insurance Act, 1997. (2012). E-Laws Ontario
- footnote[21] Back to paragraph Workplace Safety and Insurance Board. (2019). Second Quarter 2019 Sufficiency Report. Retrieved from.
- footnote[22] Back to paragraph Pricing Fairness: A Deliverable Framework for Fairly Allocating WSIB Insurance Costs
- footnote[23] Back to paragraph Workplace Safety and Insurance Board. (2015). Workplace Safety and Insurance Board Funding Policy.
- footnote[24] Back to paragraph Ibid
- footnote[25] Back to paragraph Specifically, the Funding Policy lists the following considerations: (1) New claims costs; (2) Administration costs expected to arise during the year; (3) Retirement of any unfunded liability; (4) Impact of gains or losses to the benefit liability; (5) Enhanced assurance of achieving and maintaining the Sufficiency Ratio requirements under Ontario Regulation 141/12, and the WSIB’s established trajectory to achieve full funding, as approved by the Board of Directors; (6) Impact of gains and losses on investments; and (7) Any other factor(s) deemed relevant to the maintenance of financial prudence. (Ibid.)
- footnote[26] Back to paragraph Workplace Safety and Insurance Board. (2015). Workplace Safety and Insurance Board Funding Policy
- footnote[27] Back to paragraph Marchione, D. (2017, May 8). Ontario’s WSIB to Implement New Premium Rate Framework
- footnote[28] Back to paragraph Workplace Safety and Insurance Board. (2019). Advanced Copy: Transition to the Rate Framework Operational Policy
- footnote[29] Back to paragraph Workplace Safety and Insurance Board. (n.d.) Rate Framework: Our new policies
- footnote[30] Back to paragraph Of those firms covered by WSIB insurance, approximately 20,000 (or nearly 6%) have voluntarily chosen to participate in the model (Ontario Workplace Safety and Insurance Board)
- footnote[31] Back to paragraph Workplace Safety and Insurance Board. (2017). Schedules 1 & 2
- footnote[32] Back to paragraph Workplace Safety and Insurance Board. (2019). By the Numbers: 2018 Workplace Safety and Insurance Board Statistical Report
- footnote[33] Back to paragraph Kralj, B. (2019). A Study of the Impacts of Workplace Safety Insurance Act, 1997 Coverage Expansion in Ontario
- footnote[34] Back to paragraph In a letter to Ontario’s lieutenant-governor, which accompanied his 1913 report, Meredith wrote: There is, I admit, no logical reason why, if any, all should not be included, but I greatly doubt whether the state of public opinion is such as to justify such a comprehensive scheme. (Meredith, 1913, p.9). Meredith, W. R. (1913). The Meredith Report.
- footnote[35] Back to paragraph Ontario Regulation 175/98: General under Workplace Safety and Insurance Act, 1997. (2018)
- footnote[36] Back to paragraph Workplace Safety and Insurance Board. (n.d.). Employer Classification Manual
- footnote[37] Back to paragraph Ontario Workplace Safety and Insurance Board
- footnote[38] Back to paragraph Institute for Work and Health. (2011). Trends in no-lost-time claims in Ontario
- footnote[39] Back to paragraph Workplace Safety and Insurance Board. (2019). Workplace Safety and Insurance Board 2018 Annual Report
- footnote[40] Back to paragraph Ontario Workplace Safety and Insurance Board
- footnote[41] Back to paragraph Association of Workers’ Compensation Boards of Canada. (2017). External KSM Definitions
- footnote[42] Back to paragraph Ontario Workplace Safety and Insurance Board
- footnote[43] Back to paragraph Ontario Workplace Safety and Insurance Board
- footnote[44] Back to paragraph Workplace Safety and Insurance Board. (2019). Workplace Safety and Insurance Board 2018 Annual Report
- footnote[45] Back to paragraph Workplace Safety and Insurance Board. (2018). 2017 Annual Report
- footnote[46] Back to paragraph Ontario Workplace Safety and Insurance Board
- footnote[47] Back to paragraph Institute for Work and Health. (2014). Suppression of workplace injury and illness claims: Summary of evidence in Canada
- footnote[48] Back to paragraph Prism Economics and Analysis. (2013, April). Workplace Injury Claim Suppression: Final Report. Toronto, Ontario: Workplace Safety and Insurance Board
- footnote[49] Back to paragraph Bill 109, Employment and Labour Statute Law Amendment Act, 2015, Session 1, 41st Parliament, 2015
- footnote[50] Back to paragraph Ontario Regulation 175/98: General under Workplace Safety and Insurance Act, 1997. (2018).
- footnote[51] Back to paragraph Workplace Safety and Insurance Act, 1997 (S.O. 1997, c. 16, Sched A), Section 176(2)
- footnote[52] Back to paragraph Workplace Safety and Insurance Act, 1997 (S.O. 1997, c. 16, Sched A), Section 176(1)
- footnote[53] Back to paragraph Office of Employer Adviser. (2018). Annual Report 2017-2018
- footnote[54] Back to paragraph Office of the Worker Adviser. (2018). Annual Report April 1, 2017 to March 31, 2018.
- footnote[55] Back to paragraph Office of Employer Adviser. (2018). Annual Report 2017-2018
- footnote[56] Back to paragraph Office of the Worker Adviser. (2018). Annual Report April 1, 2017 to March 31, 2018
- footnote[57] Back to paragraph Ibid
- footnote[58] Back to paragraph Office of Employer Adviser. (2018). Annual Report 2017-2018
- footnote[59] Back to paragraph Office of the Worker Adviser. (2018). Annual Report April 1, 2017 to March 31, 2018
- footnote[60] Back to paragraph Office of Employer Adviser. (2018). Annual Report 2017-2018
- footnote[61] Back to paragraph Workplace Safety and Insurance Act, 1997 (S.O. 1997, c. 16, Sched A)
- footnote[62] Back to paragraph Association of Workers’ Compensation Boards of Canada. (2015). Appeals Process and Procedures
- footnote[63] Back to paragraph It was $30 million in 2019 due to temporary funding to address excess caseload. But its typical budget in the past has been approximately $22 million per year. Workplace Safety and Insurance Appeals Tribunal. (2019). Vision to Reality Workplace Safety and Insurance Appeals Tribunal Annual Report 2018
- footnote[64] Back to paragraph Ibid
- footnote[65] Back to paragraph Workplace Safety and Insurance Board. (2013). Operational Policy Manual: Legislative Authority: Adjudication Principles
- footnote[66] Back to paragraph Workplace Safety and Insurance Appeals Tribunal. (2019). Vision to Reality Workplace Safety and Insurance Appeals Tribunal Annual Report 2018
- footnote[67] Back to paragraph Workplace Safety and Insurance Appeals Tribunal. (2019). Vision to Reality Workplace Safety and Insurance Appeals Tribunal Annual Report 2018
- footnote[68] Back to paragraph Ibid
- footnote[69] Back to paragraph BC Workers’ Compensation Appeal Tribunal. (2018). Appealing a Review Division Decision – Worker’s Guide
- footnote[70] Back to paragraph Ontario Workplace Safety and Insurance Board
- footnote[71] Back to paragraph Ontario Workplace Safety and Insurance Board
- footnote[72] Back to paragraph It should be noted that 2012-13 was a transition year for prevention-related activities. It was the year in which Prevention Office was in the Ministry of Labour and so the funding level does not represent a full year
- footnote[73] Back to paragraph Meeting with the Institute for Health and Work, July 19, 2019
- footnote[74] Back to paragraph Arthurs H. (2012). Funding Fairness: A Report on Ontario’s Workplace Safety and Insurance System p. 107; Expert Advisory Panel on Occupational Health and Safety (2010). Expert Advisory Panel on occupational health and safety: Report and Recommendation to the Ministry of Labour. p. 58
- footnote[75] Back to paragraph Prism Economics and Analysis. (2015). Market Metrics & Service Delivery: Research Report & Recommendations [O’Grady Report]. Toronto: Prevention Office, Ministry of Labour
- footnote[76] Back to paragraph Prism Economics and Analysis. (2015). Market Metrics & Service Delivery: Research Report & Recommendations [O’Grady Report]. Toronto: Prevention Office, Ministry of Labour
- footnote[77] Back to paragraph Prism Economics and Analysis. (2015). Market Metrics & Service Delivery: Research Report & Recommendations [O’Grady Report]. Toronto: Prevention Office, Ministry of Labour