Brook trout index netting manual
Manual of Instructions
Brook Trout Index Netting (BTIN) - 2005
Brian Monroe
Algonquin Fisheries Assessment Unit
Ontario Ministry of Natural Resources
P.O. Box 219
Whitney, ON K0J 2M0
Cette publication spécialisée n’est disponsible qu’en anglais
© 2005, Queen’s Printer for Ontario Printed in Ontario, Canada.
Copies of this publication are available from:
Ontario Ministry of Natural Resources
Fish and Wildlife Branch
P.O. Box 7000
300 Water Street Peterborough, ON K9J 8M5
1.0 Introduction
The main objective of the Brook Trout Index Netting (BTIN) program is to provide an unbiased index of brook trout abundance, as well as to provide biological information on the target species. The program can be conducted with a minimum investment in training and equipment.
The method involves setting small mesh gillnets at randomly selected sites for 30 minutes. The set durations are short to minimize brook trout mortality. There are two different gillnet gangs used, each gang consisting of three panels of a single mesh size tied together (45.6 m total length). The stretched mesh sizes are 51 mm (2.0”) and 64 mm (2.5 ”).
This manual describes the standard methods and provides the technical information necessary for project leaders and field crews to conduct the BTIN field program.
1.1 Background
The BTIN method outlined here is an adaptation of the lake trout Spring Littoral Index Netting (SLIN) method (Hicks, 1999). The SLIN design was an adaptation of earlier index netting surveys conducted by the Algoma Fisheries Assessment Unit.
A basic assumption of most index netting surveys such as BTIN is that the mean catch of fish per unit of sampling effort (CPUE) is proportional to the density of the species in the lake, and that CPUE can therefore be used to track changes in species abundance or compare relative abundances from lake to lake. Between 1999 and 2002, an experiment was conducted to test that assumption. We stocked brook trout in nine small lakes (total of eleven different occasions), then developed a relationship between stocking densities and CPUE. Details of this study, including a graph of the relationship between stocking density and CPUE, are included in a separate document (Monroe et al., 2005).
In addition, as part of the development of the BTIN protocol, over 40 experimental surveys were conducted on lakes containing native brook trout. Comparisons were made between different set durations, depth strata, net orientations, seasons, and mesh sizes.
The standards proposed in this manual are based in part on the results of the above surveys on stocked and native brook trout lakes.
2.0 Survey design and methods
The BTIN method utilizes a stratified random sampling design in which the individual sampling units (sites) are selected without replacement on a daily basis, i.e. no site can be sampled more that once in a day. There are two depth strata used in the design. Spatial stratification is generally not required unless a lake is large with potentially long travel times between sites. The selection of sampling sites is done randomly to minimize the biases in locating sites and setting the gear. Site selection is essentially a mapping exercise that is completed in the office before the field work begins.
2.1 Sampling methods
Survey design and methods for BTIN are summarized in Table 1. Sampling can start in June and go into early September as long as the lake remains thermally stratified. If possible, a temperature/dissolved oxygen profile (in the deepest part of the lake) should be taken sometime during the survey.
All of the sets occur between 08:00 and 17:00 and are 30 minutes in duration. The gear consists of two gangs of gillnets. Each gang has 3 panels of one mesh size (either 51 mm or 64 mm stretched mesh).
Sets are assigned to two depth strata (2-5.9 m and 6-10 m) based on the proportion of the surface areas of each stratum compared to the total surface area of the lake. All sets are perpendicular to shore.
Table 1: Summary of methods for Brook Trout Index Netting.
| Criteria | Target |
|---|---|
| Season | June to early September (during thermal stratification) |
| Time of Day | Between 08:00 and 17:00 |
| Set Duration | 30 minutes |
| Orientation | Perpendicular to shore |
| Gear | 2 gillnet gangs (45.6 m in length and 2.4 m high)
|
| Site Selection | random within depth strata |
| Depth Strata | 2 m – 5.9 and 6 m - 10 m (see section 4.1) |
| Sample Size (minimum) | 10 nets x 3 days = 30 sets |
| Crew Size | 2 people |
2.2 Sample size
In small lakes (less than 100 hectares) sampling should be conducted for 3 to 5 days. The minimum number of sets for a standard BTIN program is 30 (e.g. 10 sets per day x 3 days). Sample size can be increased to improve the precision of the CPUE estimate, or increased for larger lakes to obtain a CPUE more representative of the whole lake. A reasonable target for precision is a relative standard error of 20%, although for low CPUEs this may not be possible within the 3 to 5 day sampling window.
3.0 Gear description and preparation
3.1 Gillnets
Two different gillnet gangs are used. Each gang consists of three 15.2 m (50 ft) panels of a single mesh size tied together (45.6 m total length). The stretched mesh sizes are 51 mm (2.0”) and 64 mm (2.5”). The gillnets are manufactured in Finland and adhere to specifications which were established by the British Columbia Ministry of the Environment. Detailed net specifications and a Canadian supplier can be found in Appendix A.
Gillnets will be shipped to you as individual panels. To assemble the three panel gangs, tie panels of the same mesh size together at the brail loops located at each end of the float and lead lines. We found that taping over the knots with duct tape reduced the number of tangles in the net (the net tended to become caught on the knots or loose ends of rope). Each end of the net should be fitted with an anchor and a lift line. These can be tied to the net as desired. An example is provided in Figure 2 below.
Attach a float to each of the lift lines. Having a lift line and float on each end of the net ensures that the crew will still be able to find the net if one of the floats sinks or becomes detached. You do not want to lose a net! The floats should be as large as common sense dictates. If there is heavy boat traffic on the lake, the floats should be made quite visible, and if deemed necessary a float can be attached to the middle of the net. Alternatively, if there is little to no traffic on the lake the floats only need to be large enough to allow the crew to find the net again.
Once assembled, the nets can be placed into a laundry style basket or other container from which they can be set.
Figure 2. Net set up for Brook Trout Index Netting.
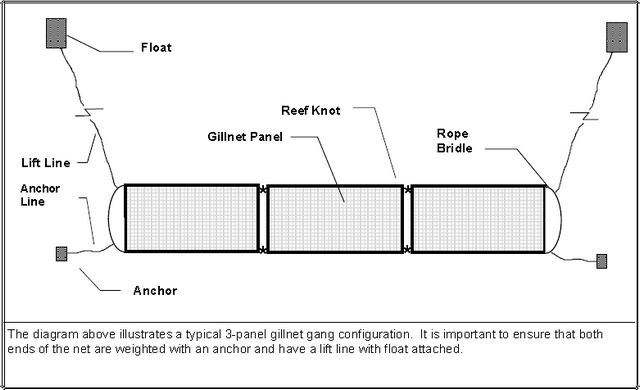
Enlarge figure 2. Net set up for Brook Trout Index Netting.
Anchor The diagram above illustrates a typical 3-panel gillnet gang configuration. It is important to ensure that both ends of the net are weighted with an anchor and have a lift line with float attached.
3.2 Gear list
The following gear should be assembled, checked, serviced and organized in preparation for the field activities.
3.2.1 Nets
- 1 three-panel gang of 51 mm monofilament gillnet
- 1 three-panel gang of 64 mm monofilament gillnet
- 3 panels of each mesh size as backups in case of net damage
3.2.2 Miscellaneous netting equipment
- 100 meters of 3/8” twisted or braided polypropylene rope for anchor and lift lines
- 4 anchors (1 L oil bottles filled with sand or concrete work well)
- 4 floats (antifreeze jugs may work well, but more prominent floats may be needed on lakes with heavy boat traffic)
- 2 spare anchors & 2 spare floats
- buckets or tubs for nets
3.2.3 Fish sampling equipment
- scale envelopes
- otolith vials (to collect otoliths from dead brook trout)
- pocket knife (to collect scales and otoliths)
- forceps (to collect otoliths)
- scissors
- measuring board
- spring style weigh scales or electronic balance
- cotton gloves
- mesh weigh bag (knotless)
- field forms
- hb pencils
3.2.4 Other equipment
- boat, motor and related safety equipment
- cooler
- ice packs, or pump and hose attachment to fill live well
- 12 V battery or power supply to power pump, if used
- depth sounder
- bathymetric map of lake
- GPS Unit
- Sampling Schedule
- Site Map
- Dissolved Oxygen meter
- Hand held thermometer
4.0 Pre-field activities
4.1 Allocation of sampling effort to depth strata
The survey design includes two depth strata, 2 - 5.9 m and 6-10 m. Each depth stratum should be sampled proportional to the surface area of the lake within the stratum. Several computer programs employing digital elevation models (e.g. ArcView, Surfer) can calculate surface areas within a depth stratum. The surface area can also be calculated using hypsographic curves or a grid overlay (see Appendix B). Within each depth stratum, equal numbers of each mesh size should be set over the course of the survey, although within a given day this may not always be possible.
Nets should be set so that the minimum depth (onshore end) is as close as possible to either two or six meters. The depth of the offshore end need not be less than 6 metres in the first stratum, but should not extend much deeper than 10 metres in either stratum. (A good rule of thumb would be that no part of panel 1 or panel 2 can cross the 10 m contour.) In some lakes with a steep bottom slope, nets set in the 6 to 10 metre stratum can extend well below the 10 metre depth. For these lakes, it is better to combine the two depth strata into one, with a starting depth of 2 metres, to keep as much net as possible in the 2 to 10 metre depth range.
The objective of the BTIN program is to obtain a CPUE that is proportional to brook trout density above the 10 m contour. If parts of this zone are sampled disproportionately, the resulting CPUE may be biased, and not representative of fish density in the whole zone. For example, if we sampled only where the fish were concentrated, the CPUE would be inflated, giving a biased estimate of the true overall density.
A hypothetical sampling design for a 4 day netting program (setting 12 nets per day) is shown below.
Calculation of # of nets required per stratum:
Statistics for hypothetical lake
Lake surface area = 50 ha.
Surface area between 2 - 10 m = 32.5 ha Surface area between 2 – 5.9 m = 22.5 ha Surface area between 6 - 10 m = 10.0 ha
Sampling design
Total # of nets to be set = 4 x 12 = 48
% of nets to be set in 2-5.9 m = 22. 5 ha /32. 5ha x 100 = 69%
# of nets to be set in 2-5.9 m = 48 nets x 69% = 33 nets
% of nets to be set in 6-10 m = 10. 0 ha /32. 5 ha x 100 = 31%
# of nets to be set in 6-10 m = 48 nets x 31% = 15 nets
The two mesh sizes must be set an equal number of times within each depth stratum, therefore we must adjust the number of nets set in each stratum to be divisible by two (by rounding up or down). Accordingly, we would set 34 nets in the 2-5.9 m stratum and 14 nets in the 6-10 m stratum.
To facilitate organizing the netting schedule it is useful to make a table as follows.
Table 2. Number of nets to be set within each depth stratum, by day.
| Day | 2- 5.9 m Depth Stratum (34 nets) - 51 mm (17 nets) | 2- 5.9 m Depth Stratum (34 nets) - 64 mm (17 nets) | 6-10 m Depth Stratum (14 nets) - 51 mm (7 nets) | 6-10 m Depth Stratum (14 nets) - 64 mm (7 nets) |
|---|---|---|---|---|
| 1 | 4 | 4 | 2 | 2 |
| 2 | 4 | 4 | 2 | 2 |
| 3 | 5 | 5 | 1 | 1 |
| 4 | 4 | 4 | 2 | 2 |
| Total Nets | 17 | 17 | 7 | 7 |
4.2 Sample site selection
There are two options for designating potential sampling sites. Both require a contour map of the study lake showing at least the 2, 6 and 10 metre contours. In one method, the shoreline of the lake is marked off into 100 metre sections. In the other method, a 100 metre grid is drawn on the map.
All sites should then be categorized by the depth strata they contain. Sites that are too shallow, too deep, or are otherwise unacceptable because of docks, boathouses; heavy boat traffic, etc. are removed from further consideration. The shoreline sectors or grid squares are then numbered sequentially (usually going clockwise around the lake) and each represents a potential sampling site.
Randomly select the sites to be sampled prior to going into the field (a random number table or telephone book works well for this). The following guidelines should be kept in mind when selecting sites:
- sites should be selected so that the same site is not sampled more than once in a day
- on a given day, nets should be set at least 3 sites apart from each other to minimize the chance that one net will interfere with the catch in another net. On smaller lakes where this may not be possible, ensure that no two nets fishing at the same time are less than 3 sites apart.
If you are sampling a large lake (e.g. greater than 500 hectares) and travel time between sites would prohibit sampling the entire lake on any given day, the lake should then be divided into manageable areas of roughly equal size which are then further divided into 100 metre sites. Each day a different area could be sampled.
4.3 Creating a sampling schedule
It should be possible to set 10 or 12 nets per day. In some cases you may find that time will permit more nets to be set (if catches are low or travel time between sites is relatively short). If, due to lengthy travel time to and from the lake or because of large catches you cannot set 10 nets per day, you may have to scale back to 8 sets per day.
The time interval between setting nets is dependent upon the number of fish you think you will catch and the extent to which you sample the fish. In other words, the longer it takes to clear a net and sample the fish, the more time you should allow between sets.
For a lake with moderate catches and a moderate sampling intensity (e.g. 1 - 2 brook trout per net, taking only fork lengths, total lengths, weights, and scale samples) a typical schedule may look something like Table 3 below.
Table 3. Example of a Daily Sampling Schedule.
| Time | Set Net | Lift Net | Time | Set Net | Lift Net |
|---|---|---|---|---|---|
| 9:00 | 1 | 13:00 | 7 | ||
| 9:15 | 2 | 13:15 | 8 | ||
| 9:30 | 1 | 13:30 | 7 | ||
| 9:45 | 2 | 13:45 | 8 | ||
| 10:00 | 3 | 14:00 | 9 | ||
| 10:15 | 4 | 14:15 | 10 | ||
| 10:30 | 3 | 14:30 | 9 | ||
| 10:45 | 4 | 14:45 | 10 | ||
| 11:00 | 5 | 15:00 | 11 | ||
| 11:15 | 6 | 15:15 | 12 | ||
| 11:30 | 5 | 15:30 | 11 | ||
| 11:45 | 6 | 15:45 | 12 | ||
| 12:00 (Lunch) | 16:00 (End of day) |
You will find that various factors (e.g. tangled nets, large numbers of fish, time spent trying to revive a fish, etc.) will interfere with such a schedule and it is provided only as an example. It is not critical that each net be fished for exactly 30 minutes. Fishing a net five to ten minutes either side of 30 minutes is acceptable if there were delays. The mean set duration should work out to 30 minutes on a daily basis. In other words, if you are late lifting a net by 5 minutes because of many fish in the previous net, lift the next one five minutes early to average it out to 30 minutes.
Order of sampling: Once sites are selected, the order in which they are sampled needs to be determined. Select an order which makes the most logistical sense. Since the sites were randomly selected, the order in which they are netted should not bias the results. Remember the distance-between-nets requirement, so that nets fishing at the same time are not too close together. This means that on a small lake, you may end up leapfrogging around the shoreline several times during the day. You should pick your starting sites so that you begin at different areas of the lake each day.
Assigning mesh sizes: After selecting the sites, mesh sizes can be assigned to them. Randomly assign a mesh size to the first site to be netted, then alternate between mesh sizes for the rest of the day. This may require a further adjustment in the order that sites are sampled if two different depth strata are used. Refer to the sampling schedule (Table 2) to determine how many nets and which mesh sizes are set in each depth stratum.
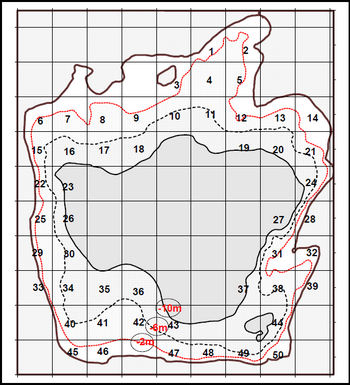
Example: Set up a schedule for Day 3 from Table 2, on a lake with 50 useable grid squares (Figure 1). First, generate a list of about 20 random numbers between 1 and 50, (e.g. 20, 3, 44,18, 20, 7, 10, 31, 40, 13, 18, 22, 12, 3, 13, 47, 1, 9, 16, 33, ...) Remove all duplicate numbers (20,18,3,13). Select the first 2 sites that have a 6 to 10 metre stratum (20, 44). Select the first 10 sites with a 2 to 5.9 metre stratum (3, 7, 10, 31, 40, 13, 22, 12, 47, 1). Now, with the map in front of you, pick a starting site, then pick the next site that is close, but not within 3 sites. Continue in this manner around the lake until all sites have been selected. Assign mesh sizes to each site (alternating between the two mesh sizes). Check that the mesh sizes are correct for each depth stratum. You may have to re-start this process several times to produce a workable schedule. Figure 1 shows an example for a hypothetical lake.
Figure 1. Example of a hypothetical lake and its daily sampling schedule.
| Set # | Set Time | Site | Gear | Start Depth |
|---|---|---|---|---|
| 1 | 09:00 | 12 | 51 mm | 2 |
| 2 | 09:15 | 7 | 64 mm | 2 |
| 3 | 10:00 | 40 | 51 mm | 2 |
| 4 | 10:15 | 44 | 64 mm | 6 |
| 5 | 11:00 | 20 | 51 mm | 6 |
| 6 | 11:15 | 3 | 64 mm | 2 |
| 7 | 12:00 | 22 | 51 mm | 2 |
| 8 | 12:15 | 47 | 64 mm | 2 |
| 9 | 13:00 | 31 | 51 mm | 2 |
| 10 | 13:15 | 10 | 64 mm | 2 |
| 11 | 14:00 | 13 | 51 mm | 2 |
| 12 | 14:15 | 1 | 64 mm | 2 |
4.4 Preparation of field forms
Prior to the first field sampling day, crews will need to prepare enough BTIN Effort Forms, Catch Forms, and Fish Sampling Forms to record their results while in the field. One Effort Form, several Catch Forms, and several Fish Sampling Forms should be prepared for each field day. Blank copies of standard BTIN forms are included in Appendix D. Check the current Fishnet V3 User Guide for definitions of any fields not described in this manual.
If additional fish sampling is required (e.g., extra data for species of interest), then the appropriate paperwork for that task should also be prepared at this time. All paperwork (forms, manual, maps, schedule, information sheets, scale envelopes, etc.) should be placed in plastic bags and sealed in a suitable storage container for protection from wind and water damage.
BTIN forms can be printed (laser printers only) or photocopied on weatherproof or waterproof paper for working in inclement weather. It is recommended that a small set of weatherproof or waterproof forms be available to the field crew for the days when such forms would be required.
5.0 Field procedures
5.1 Setting the net
Although nets may be set anywhere within the site boundaries, try to set near the middle of the site. Occasionally obstructions such as docks, fallen trees, and campsites will force you to set more towards the site boundaries. If you are unable to set a net at a scheduled site we suggest that you try setting at the next adjacent site, either to the left or right (choose one side and be consistent whenever this happens), instead of randomly choosing another site. This minimizes disruption to the netting schedule and should not introduce any bias. If a suitable netting site still cannot be found then randomly select another site.
Steps in setting the net:
- Drive towards shore until the desired minimum depth of two or six metres is reached. On the Effort Form, record Effort Number, Site Number, Mesh Size, UTM Coordinates, and Start Depth, as described below.
- Shift the boat into reverse and instruct the person at the bow to throw out the anchor and float and to begin feeding out the net.
- While backing out slowly from shore, feed the net from the bow making sure to keep the float and lead lines from crossing. If the net has been packed neatly it will go out neatly. At the end of each panel, record the bottom depth in the appropriate place on the form.
- When the net is fully played out, drop the anchor line while holding onto the float line.
- Continue reversing the boat until the net is taut and then release the float line. Record start time and wind direction.
5.2 Information to record at set
Record the following data on the Effort Form for each individual net set:
Effort number
Record the unique (and sequential) number assigned to each individual setting of a net. The first set of the project would be effort # 001, the second would be effort # 002 and so on until the final effort number is recorded (e.g. effort # 048).
Site number
Record the grid reference number or shoreline segment number used to identify the specific geographic location of the netting site.
Mesh size
Enter the mesh size (stretched) used in this set. For the BTIN program, the sizes are 51 mm and 64 mm (2.0” and 2.5” respectively).
UTM coordinates
Record the UTM coordinates and datum (NAD27 or NAD83) at the start of each set.
Gear depth start (m)
Record the depth of the net at the nearshore end of the set in metres to one decimal place.
Depth at end of panel 1 (m)
Record the depth of the net at the offshore end of the first gillnet panel in metres to one decimal place.
Depth at end of panel 2 (m)
Record the depth of the net at the offshore end of the second gillnet panel in metres to one decimal place.
Gear depth end (m)
Record the depth of the net at the offshore end of the set in metres to one decimal place.
Start time
Record the time that the net was set (24 hr clock hh:mm). Start time is recorded as the time when the last panel has been set and the anchor is in place (i.e. step 5 is completed).
Wind direction & speed (optional)
Record the wind direction, expressed in degrees, and the wind speed, expressed in knots, at the time of the set. Use a compass to measure the direction that the wind is coming from. Estimate (or measure with an anemometer) the velocity of the wind.
Record the following data on the Effort Form immediately after making the first set of the day. This information is applicable to all sets on that day and only the weather information needs to be changed if appropriate.
Waterbody
Record the official name of the waterbody in which the net was set.
Date
(yy.mm.dd) Record the date that the net was set and lifted.
Field crew
Record the names or initials of the field crew members who fished the net.
Water temperature
Measure and record the water temperature in degrees Celcius taken 50 cm below the water’s surface.
Air temperature (optional)
Record the air temperature in degrees Celcius as measured with a dry thermometer.
Cloud cover (optional)
Record the estimated fraction of the sky, in eighths, that is covered by cloud – according to the following descriptions:
0 = sky is clear (no clouds)
1 = 1/8 of sky is covered by cloud
2 = 2/8 of sky is covered by cloud
3 = 3/8 of sky is covered by cloud
4 = 4/8 of sky is covered by cloud
5 = 5/8 of sky is covered by cloud
6 = 6/8 of sky is covered by cloud
7 = 7/8 of sky is covered by cloud
8 = sky is totally covered by cloud
9 = sky obscured by fog, snow, etc. (cloud cover cannot be estimated)
Precipitation (optional)
Record the type of precipitation, fog, or mist, using the following codes found on the BTIN Effort Form:
00 = none
10 = mist
40 = fog
61 = light rain
65 = heavy rain
71 = light snow
75 = heavy snow
95 = thunderstorm
5.3 Lifting the net
Prior to lifting the net, a cooler of cool fresh water should be set up to hold captured fish for recovery. A portable 12 V water pump can be hooked up to either a 12V battery or a rechargeable 12 V power supply. A regular garden hose (7 m in length) weighted on one end is connected to the pump and lowered into the water. Filling a large cooler about ¾ full takes less than 5 minutes. Alternatively, fill the cooler with fresh surface water and add several ice packs. Bring enough ice packs for the entire day. If not many fish are caught this water can be used for a few net lifts instead of changing the water every net. Using cool water noticeably reduces short-term brook trout mortality. Keeping the cooler covered and the fish out of direct light is also beneficial.
Record the catch by panel if possible. Although not essential, this information can be useful for interpreting the results of the survey. The panels are numbered from one to three, one being the nearshore panel and three being the offshore panel. In the interests of consistency it is recommended the net be fished from the offshore end first, weather permitting. Consistently fishing the net from the offshore end (panel three) reduces the chance of assigning fish to the wrong panel. However, if safety is an issue, e.g. because of wind or wave direction, then start at the nearshore end.
Steps in lifting the net:
- Prepare the coolers as indicated above.
- Retrieve the marker buoy at the offshore end of the net and place it in the net basket.
- Start to retrieve the net. Note the time and record it on the effort form under “End time”.
- Retrieve the net, carefully removing the fish as you go. Fish taken from the net can either be processed as the net is taken in (if conditions permit, the catch is small enough and the crew experienced enough) or the fish can be placed into the cooler and kept to be processed after the net has been fished. Remember to keep track of which panel each fish is taken from (e.g. use one or two fine-mesh dipnets sitting in the cooler).
5.4 Information to record at lift
Record the following data on the Effort Form for each individual net lift:
End time
End time is recorded as the time when you start to lift the first panel (24 hr clock hh:mm).
Complete the header on the BTIN Catch Form by recording the Waterbody and Date to correspond with the information on the BTIN Effort Form.
Fill in one row of the Catch Form for each species caught in each panel (panel # = Sub-Effort#). It may be easier to complete this step after all fish from the set have been sampled.
5.5 Fish sampling
The level of fish sampling is determined by the local project coordinator and may depend upon the species, and whether the fish are stocked or native. For brook trout it is recommended that a minimum of total length, fork length, weight, and clip-on-capture be recorded. Any tag numbers should of course be recorded as well. A plot of fork length vs. total length can be used to quickly check for data entry or recording errors. It is also suggested that scale samples be taken for age determination (unless the age can be determined from previously applied fin clips or tags). Any dead fish should be kept to have further biological information taken. This could include recording sex and maturity, taking additional aging structures (i.e. otoliths, pectoral rays), and stomach samples.
If enough brook trout are captured, it may be feasible to do a mark-recapture population estimate by fin clipping or tagging released fish.
For species other than brook trout, the intensity of sampling will vary according to the type of information desired by the office but it is recommended that fork lengths be taken as a minimum.
Steps in sampling the fish:
- Designate one person as the fish handler and another person as the data recorder. The fish handler samples the fish and calls out the data; the data recorder writes the data on the BTIN Fish Sampling Form
- Start by completing the header on the BTIN Fish Sampling Form. Record the Waterbody, Date, and Crew to correspond with the information on the BTIN Effort Form.
- Record the Effort Number on the BTIN Fish Sampling Form.
- The fish handler should select a fish, identify the fish species, and call out the species name and panel number (Sub-Effort #) to the data recorder. A list of Fish Species and codes is provided in Appendix C.
- Record a Fish Number for the fish. Fish Numbers must be unique for each fish sampled. One approach is to number every fish sequentially, starting at the first catch of the first day, and continuing to the end of the project.
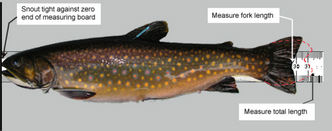
- Place that fish on the measuring board so that the snout is snug against the zero end of the board and the fish is laying flat along the graduated ruler (see Figure 8).
- Measure and record the fork length to the nearest millimetre.
- Measure and record the total length to the nearest millimetre. To measure the total length, compress the upper and lower lobes of the caudal fin rays to obtain the maximum length (see Figure 8).
Weigh the fish using a hand held spring-loaded weigh scale or electronic balance. Hand held spring-loaded scales should be calibrated each day and tared with the damp weigh sock. Weigh fish with the appropriate capacity scale. Do not record weights of fish that are <10% of the scale capacity (100 g for a 1 kg scale) when spring-loaded mechanical scales are used (i.e., do not weight an 80 g fish on the 1 kg scale, use the 100 g scale). Enter the weight of the fish on the BTIN Fish Sampling Form.
Figure 3. Measuring the Fork and Total Lengths
Scale samples should be collected for aging purposes. To collect a scale sample, gently wipe away, with the blade of your knife, any excess mucous and dirt from the area to be sampled. Clean the knife blade carefully by wiping with a cloth or rinsing in water. With the tip of the knife gently pull the scales from the left side of the body and place in a scale envelope. For soft rayed fish (salmonids, coregonids, etc.) remove at least 20 scales from above the lateral line and anterior to the dorsal fin. For spiny rayed fish (yellow perch, etc.) remove at least 10 scales from below the lateral line and posterior to the insertion of the pectoral fin. The following information should be recorded on scale envelopes:
Typical Fields on Scale Sample Envelope: Data to Record: Species Fish Species Code Party No. Effort Number No. Fish Number Date Date Locality Waterbody/ Grid # or Site # Age Structures Aging Structures Collected - If some brook trout are dead when captured, otoliths should be collected and used as the primary structure for age interpretation. They should be placed in otolith containers and placed in the scale envelope that has been labeled above. Record the type of structures that were collected on the BTIN Fish Sampling Form.
- When all the required information has been collected, release the fish by gently tossing it back into the water, or back into the cooler if it has not fully recovered. Be sure it is separated from fish not already sampled. Return to step 4 if there are more fish to sample.
6.0 Post field activities
6.1 Data transcription
If data are recorded in field notebooks the crew should transcribe the data onto forms. This transcription step may be avoided by using field forms printed on waterproof paper. Sample forms which may be modified to suit your particular project are provided in Appendix D.
6.2 Data entry
A data entry template for BTIN projects is provided in Fishnet3 and has been designed to reflect the structure of the field forms provided in this manual.
7.0 General survey guidelines and troubleshooting
While designing or conducting a survey, problems unique to your lake may arise which are not covered in this manual. Most problems can be worked out by logically thinking them through. The following is a list of the basic Dos and Don’ts of the method. Keep these in mind when setting up your sampling design.
- Do use the random site selection process described in this manual. Don’t use prior knowledge of ‘good’ or ‘poor’ fishing/habitat/netting locations as a basis for selecting sites. An unbiased index of abundance depends on random sampling design. The overall objective is to get a CPUE that is representative of the entire lake above the 10 metre contour. That means sampling both the “good” and “poor” areas.
- Do ensure that the mean set duration within each day is 30 minutes. The index is based upon this. Not every net has to be set for exactly 30 minutes; however the average set should be 30 minutes.
- Do distribute netting effort evenly throughout the entire work day. Brook trout activity levels likely vary with time of day. Therefore, so will their encounter rate with the nets. By spreading effort throughout the day, you will get a better average CPUE.
- Do spread netting effort over as many days as practical to average the effect of environmental conditions on CPUE (i.e. if you have two lakes to sample, simply alternate between them). Brook trout activity levels likely vary with environmental conditions such as weather patterns, so distributing the effort over a longer period will tend to even out the effect of weather conditions, and produce a more representative CPUE.
- Do set the same number of sets of each mesh size each day. Each mesh size has different capture efficiencies for different sized fish, so setting more of one size could bias the catch.
- Do try to maintain the minimum distance between nets that are set at the same time. This can be a real challenge in small lakes. It may happen that many of the randomly chosen sites are clustered in one area of the lake, which makes it very difficult to create a schedule that keeps sites the required distance apart. It may be necessary to reject one or two sites near the beginning of the random number list in favour of sites that are farther down the list, in order to keep the nets far enough apart.
8.0 Acknowledgements
The organization of the BTIN manual was based largely on the SLIN manual that was written by Frank Hicks. Trevor Middel wrote the first draft of the BTIN manual, and helped with survey design and field activities. Mike Powell initiated the calibration exercise. Wendy Stott contributed to survey design, data analysis, and field activities. Stephen Belfry from the North Bay MNR office, Andre Dupont from Sault Ste. Marie MNR office, and George Morgan from Cooperative Freshwater Ecology Unit at Laurentian University helped in the calibration exercise. Many other Ministry of Natural Resources staff throughout the province provided data from their brook trout surveys. Others helping with field work and preparation of the manual include Greg Betteridge, Glenn Forward, Audie Skinner, Chuck Brady and many seasonal staff at the Algonquin Fisheries Assessment Unit.
9.0 References
Hicks, F.J. 1999 . Manual of Instructions. Spring Littoral Index Netting (SLIN). Ont. Ministry of Natural Resources - Algonquin Fisheries Assessment Unit.
Monroe, B., M. Powell, W. Stott, G. Betteridge, and G. Forward. 2005. Calibration of the brook trout index netting protocol in stocked brook trout lakes. Ont. Ministry of Natural Resources – Algonquin Fisheries Assessment Unit.
Appendix A (Net specifications and supplier)
Net specifications (per panel)
- Length: 15.2 m (50 ft)
- Height: 2.4 m (8 ft)
- Mesh size: 51 mm, 64 mm ( 2.0”, 2.5”) stretched mesh
- Mesh Type: double knotted monofilament
- Filament dia: 0.20 mm for 51 mm mesh sizes, 0.25 mm for 64 mm mesh size
- Color: light green, (Miracle R-13L)
- Lead Line: braided, 75g/m
- Cork line: braided nylon, corks 15 - 20 cm. Apart
General Details: Nets are hung on a 2:1 basis, thus there is twice as much web as lead/cork line and the ratio of meshes is 1.73:1. Nylon gables (side lines) are approximately 18 kg test.
Supplier:
The nets, referred to as Monofilament Nylon Gillnets, are available from:
Redden Net Co. Ltd.
1638 West 3rd Ave.
Vancouver, B.C. V6J 1K2
Phone:
Fax:
Website: www.redden-net.com/gillnets.cfm
Appendix B (calculation of area of depth strata)
1. Using a hypsographic curve
This method can only be done if you know the surface area of the lake in question at different depth contours. This information is available for most lakes from the aquatic habitat inventory database at OFIS or may be available in your office. Generally it will be of the form shown in the table below. Once you have this information you can draw a curve as shown in Fig. 1 below and interpolate surface areas for the required depths.
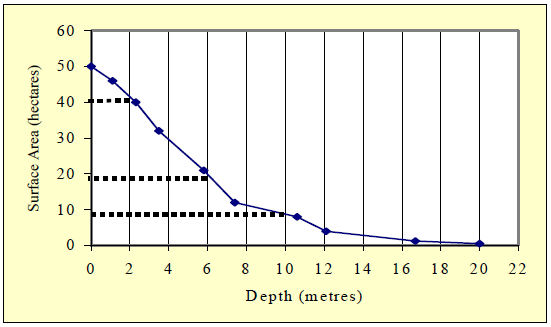
| Depth (m) | Surface Area (ha) |
|---|---|
| 0 | 50 |
| 1.1 | 46 |
| 2.3 | 40 |
| 3.5 | 32 |
| 5.8 | 21 |
| 7.4 | 12 |
| 10.6 | 8 |
| 12.1 | 4 |
| 16.7 | 1.25 |
| 20 | .5 |
Based on this graph we can approximate the following areas for each depth strata:
Surface area of entire lake = 50 ha Surface area of lake ≥ 2 m =~ 40.5 ha Surface area of lake ≥ 6 m =~19.5 ha ∴ surface area of lake between 2-5.9 m = 40.5 – 19.5 = 21 ha Surface area of lake ≥ 10 m =~ 9 ha ∴ surface area of lake between 6-10 m = 19.5 – 9.0 = 10.5 ha As a percentage of the total nettable area within the lake we can break this down as follows:
2- 5.9 m stratum = 21 ha/31.5 ha * 100 = 66.7% ∴67% of nets set in 2-6 m 6-10 m stratum = 10.5 ha/ 31.5 ha * 100 = 33.3% ∴33% of nets set in 6-10 m
2. Grid overlay
Another method you could use, which may be a bit more tedious depending on the size of your lake, is a grid overlay on a bathymetric map. By overlaying the grid and simply counting the squares contained within each depth stratum you should be able to obtain a good estimate of the relative surface area within each stratum.
Appendix C (fish species codes)
Appendix D (BTIN sampling forms)
The following blank copies of the BTIN forms are required to record the results of your BTIN project. To facilitate direct photocopying for field use, the forms are full size and intentionally not labeled with the instruction manual page numbers. Save these forms as master copies for use in future BTIN field programs.
Electronic copies of the BTIN forms are available for re-printing purposes. Photocopied or laser printed versions are often more field worthy than versions made with ink printers. Ink printed versions tend to smear and the ink will run if the forms get wet. The toner used in photocopiers and laser printers tends to hold up very well to water damage.