Budgeting farm machinery costs
Learn how to estimate your annual machinery costs so you can decide if buying equipment makes sense for your farm.
ISSN 1198-712X, Published September 2025
Introduction
Farm machinery costs make up a significant part of the fixed and variable costs of any farm operation. If the capital invested in a machine is to be used efficiently, that machine must be used over enough acres or for enough hours to have costs comparable to or below the same operation being done by a custom operator.
This fact sheet provides a framework for calculating the total annual cost of farm machinery so that you can determine whether it makes economic sense for you to own a machine. The best source of information to budget farm machinery costs is your records. In the absence of farm records, calculation methods can be used to estimate the costs.
The information presented is prepared as a representative guide to estimating machinery costs and is not intended to recognize or predict the costs for any one particular operation. Terms are explained in more detail in machinery cost budgeting terms.
Some values in this fact sheet are in imperial measurements, reflecting common usage in the industry.
Machinery cost basics and calculations
Machinery costs include fixed (ownership) costs and variable (operating) costs. These costs affect the profitability of the business.
Fixed costs
Fixed costs do not change as the machine sees more use. They include depreciation, interest, insurance and housing. Fixed costs per unit of work done drop as the hours or acres of use per year increase.
Depreciation is a measure of the loss of value of a machine over time. Total depreciation is calculated by subtracting the trade-in (or salvage) value of the machine from the purchase price. The trade-in value or salvage value is the estimated value of the machine at the end of its years of service or optimal life. Optimal life is defined as when the equipment value has declined to one-third of its original purchase price. Straight line depreciation divides the total depreciation in equal amounts over the life of the asset. Estimated optimal life, annual hours of use and annual depreciation rates for selected farm equipment are shown in Table 1. Inflation, equipment supply/demand and current farm economy factors can cause wide variation in trade-in values.
| Machine | Annual hours of use | Optimal life (years) | Annual depreciation rate (% of purchase price) | Annual repair rate (% of purchase price) |
|---|---|---|---|---|
| 2-wheel drive (2WD) tractors | 300 | 20 | 3.3 | 2.31 |
| Front-wheel assist (FWA) tractors | 450 | 15 | 4.4 | 2.73 |
| 4-wheel drive (4WD) tractors | 450 | 15 | 4.4 | 2.63 |
| Self-propelled (SP) combines | 250 | 12 | 5.6 | 2.63 |
| Headers, grain | 250 | 15 | 4.4 | 2.79 |
| Headers, corn | 100 | 15 | 4.4 | 2.94 |
| Grain carts | 250 | 20 | 3.3 | 2.10 |
| Plows, discs | 100 | 20 | 3.3 | 3.68 |
| Vertical tillage | 100 | 20 | 3.3 | 3.68 |
| Cultivators, hoes | 200 | 20 | 3.3 | 1.58 |
| Harrows | 75 | 25 | 2.7 | 1.26 |
| Drills | 200 | 15 | 4.4 | 3.15 |
| Row crop planters | 100 | 10 | 6.7 | 4.20 |
| SP high clearance sprayers | 200 | 8 | 8.3 | 3.68 |
| Mower/conditioner | 150 | 15 | 4.4 | 2.63 |
| Balers, round | 100 | 15 | 4.4 | 1.58 |
| Balers, large square | 150 | 15 | 4.4 | 1.79 |
| Balers, small square | 100 | 20 | 3.3 | 1.05 |
| SP forage harvesters | 400 | 10 | 6.7 | 8.40 |
| Manure spreaders | 100 | 10 | 6.7 | 4.62 |
Depreciation example 1 using Table 1
310 HP 4WD tractor:
Purchase price: $615,000
Projected use: 450 hours per year for 5 years
Estimated total depreciation over the 5 years: 4.4% annual depreciation rate (from Table 1, 4WD tractors) × 5 years × $615,000 = $135,300 total depreciation
Trade-in value = $615,000 (purchase price) – $135,300 (total depreciation) = $479,700
Depreciation example 2 using Table 1
12 row – 30-inch row crop planter:
Purchase price: $120,000
Projected use: 100 hours per year for 10 years
Estimated total depreciation in year 10: 6.7% (from Table 1, row crop planters) × 10 years × $120,000 = $80,400 total depreciation
Trade-in value = $120,000 – $80,400 = $39,600
Interest cost is the interest charged by your lender or on the owned capital you have invested in the machine. If the machinery is partially financed by a lender and partially your own capital, use the average of the 2 rates. The owned capital investment interest rate used should reflect conservative rates of return for money that could be obtained in the current market (such as T-Bill rate, GIC rate). If capital is in tight supply, you may want to choose a higher rate that gives you more of a return for the risk you assume in the investment. The interest rate used should be adjusted for inflation since inflation reduces the real cost of investing in farm machinery. If the average interest rate is 7% and inflation is at 2%, the adjusted or “real” interest rate is 5%.
The capital recovery method estimates the annual depreciation and interest costs. It combines depreciation and interest costs in one calculation. To calculate the capital recovery costs, the capital recovery factor is multiplied by total depreciation and adds the result of the trade-in value multiplied by the interest rate. Table 2 provides the capital recovery factors for selected combinations of years and interest rates.
| Year | 2% IR | 3% IR | 4% IR | 5% IR | 6% IR | 7% IR | 8% IR | 9% IR | 10% IR | 11% IR | 12% IR | 13% IR | 14% IR | 15% IR |
|---|---|---|---|---|---|---|---|---|---|---|---|---|---|---|
| 1 | 1.02 | 1.03 | 1.04 | 1.05 | 1.06 | 1.07 | 1.08 | 1.09 | 1.10 | 1.11 | 1.12 | 1.13 | 1.14 | 1.15 |
| 2 | 0.515 | 0.523 | 0.530 | 0.538 | 0.545 | 0.553 | 0.561 | 0.568 | 0.576 | 0.584 | 0.592 | 0.599 | 0.607 | 0.615 |
| 3 | 0.347 | 0.354 | 0.360 | 0.367 | 0.374 | 0.381 | 0.388 | 0.395 | 0.402 | 0.409 | 0.416 | 0.424 | 0.431 | 0.438 |
| 4 | 0.263 | 0.269 | 0.275 | 0.282 | 0.289 | 0.295 | 0.302 | 0.309 | 0.315 | 0.322 | 0.329 | 0.336 | 0.343 | 0.350 |
| 5 | 0.212 | 0.218 | 0.225 | 0.231 | 0.237 | 0.244 | 0.250 | 0.257 | 0.264 | 0.271 | 0.277 | 0.284 | 0.291 | 0.298 |
| 6 | 0.179 | 0.185 | 0.191 | 0.197 | 0.203 | 0.210 | 0.216 | 0.223 | 0.230 | 0.236 | 0.243 | 0.250 | 0.257 | 0.264 |
| 7 | 0.155 | 0.161 | 0.167 | 0.173 | 0.179 | 0.186 | 0.192 | 0.199 | 0.205 | 0.212 | 0.219 | 0.226 | 0.233 | 0.240 |
| 8 | 0.137 | 0.142 | 0.149 | 0.155 | 0.161 | 0.167 | 0.174 | 0.181 | 0.187 | 0.194 | 0.201 | 0.208 | 0.216 | 0.223 |
| 9 | 0.123 | 0.128 | 0.134 | 0.141 | 0.147 | 0.153 | 0.160 | 0.167 | 0.174 | 0.181 | 0.188 | 0.195 | 0.202 | 0.210 |
| 10 | 0.111 | 0.117 | 0.123 | 0.130 | 0.136 | 0.142 | 0.149 | 0.156 | 0.163 | 0.170 | 0.177 | 0.184 | 0.192 | 0.199 |
| 11 | 0.102 | 0.108 | 0.114 | 0.120 | 0.127 | 0.133 | 0.140 | 0.147 | 0.154 | 0.161 | 0.168 | 0.176 | 0.183 | 0.191 |
| 12 | 0.095 | 0.100 | 0.107 | 0.113 | 0.119 | 0.126 | 0.133 | 0.140 | 0.147 | 0.154 | 0.161 | 0.169 | 0.177 | 0.184 |
| 13 | 0.088 | 0.094 | 0.100 | 0.109 | 0.113 | 0.120 | 0.127 | 0.134 | 0.141 | 0.148 | 0.156 | 0.163 | 0.171 | 0.179 |
| 14 | 0.083 | 0.089 | 0.095 | 0.101 | 0.108 | 0.114 | 0.121 | 0.128 | 0.136 | 0.143 | 0.151 | 0.159 | 0.167 | 0.175 |
| 15 | 0.078 | 0.084 | 0.090 | 0.096 | 0.103 | 0.110 | 0.117 | 0.124 | 0.131 | 0.139 | 0.147 | 0.155 | 0.163 | 0.171 |
| 16 | 0.074 | 0.080 | 0.086 | 0.092 | 0.099 | 0.106 | 0.113 | 0.120 | 0.128 | 0.136 | 0.143 | 0.151 | 0.160 | 0.168 |
| 17 | 0.070 | 0.076 | 0.082 | 0.089 | 0.095 | 0.102 | 0.110 | 0.117 | 0.125 | 0.132 | 0.140 | 0.149 | 0.157 | 0.165 |
| 18 | 0.067 | 0.073 | 0.079 | 0.086 | 0.092 | 0.099 | 0.107 | 0.114 | 0.122 | 0.130 | 0.138 | 0.146 | 0.155 | 0.163 |
| 19 | 0.064 | 0.070 | 0.076 | 0.083 | 0.090 | 0.097 | 0.104 | 0.112 | 0.120 | 0.128 | 0.136 | 0.144 | 0.153 | 0.161 |
| 20 | 0.061 | 0.067 | 0.074 | 0.080 | 0.087 | 0.094 | 0.102 | 0.110 | 0.117 | 0.126 | 0.134 | 0.142 | 0.151 | 0.160 |
For example, using the tractor example:
Total depreciation = $135,300
Trade-in value = $479,700
Capital recovery:
= (total depreciation × capital recovery factor) + (trade-in value × interest rate)
= ($135,300 × 0.231 (from Table 2, 5% interest and 5 years)) + ($479,700 × 5%)
= $31,254 + $23,985
= $55,239 per year capital recovery (depreciation and interest costs)
Insurance and housing make up a small part of the ownership costs of a machine. Insurance costs are calculated by adding the purchase price plus the trade-in value of the machine, dividing by 2 to give an average value over the machine’s life, then multiplying by the chosen insurance rate. Housing costs are estimated by multiplying the housing rate per square foot by the square feet of housing required. The current market building rental rate per square foot is a good estimate for the housing rate. Housing requirements of selected farm equipment are shown in Table 3. If the insurance and housing rates are not known, 1% of the purchase price can be used to estimate annual insurance and housing costs.
Continuing with the tractor example:
$615,000 purchase price × 1% = $6,150 per year for insurance and housing
Total Fixed (Ownership) Costs: Capital recovery, insurance and housing are added together to arrive at total fixed costs.
Total fixed costs for the example tractor = $55,239 + $6,150 = $61,389 per year
For 450 hours/year usage, the hourly cost is $61,389/450 = $136/hour.
| Equipment | Sq. ft required |
|---|---|
| 4–18-in. furrow plow | 75 |
| 6–18-in. furrow plow | 132 |
| 8–18-in. furrow plow | 150 |
| 24-ft field cultivator | 200 |
| 30-ft field cultivator | 250 |
| 45-ft field cultivator | 400 |
| 16-ft chisel plow | 225 |
| 20-ft chisel plow | 250 |
| 24-ft tandem disk | 260 |
| 30-ft tandem disk | 280 |
| 6R – 30-in. row crop planter | 170 |
| 12R – 30-in. row crop planter | 300 |
| 16R – 30-in. row crop planter | 300 |
| 6R – 30-in. minimum-till planter | 170 |
| 12R – 30-in. minimum-till planter | 300 |
| 16R – 30-in. minimum till | 300 |
| 25-ft grain drill | 130 |
| 35-ft grain drill | 200 |
| 12-ft presswheel drill | 115 |
| 20-ft presswheel drill | 130 |
| 15-ft no-till drill | 160 |
| 20-ft no-till drill | 200 |
| 50-ft sprayer | 200 |
| 90-ft sprayer | 400 |
| 13-ft mower conditioner | 100 |
| 13-ft rotary mower/conditioner | 100 |
| Square baler | 184 |
| Round baler 1,000 lb | 100 |
| Round baler 1,500 lb | 115 |
| Large size square baler | 250 |
| Round baler 1,000 lb/wrapper | 100 |
| 2-row forage harvester | 140 |
| Self-propelled forage harvester 6-row | 300 |
| Large forage blower | 30 |
| Combine 275 HP corn head 6R – 30 in. | 520 |
| Combine 375 HP corn head 12R – 30 in. | 660 |
| Combine 375 HP grain head 25 ft | 608 |
| Combine 375 HP grain head 35 ft | 608 |
| Tractors less than 80 HP | 105 |
| Tractors 80–149 HP | 155 |
| Tractors 150+ HP | 250 |
Source: American Society of Agricultural and Biological Engineers Standards, 2015.
Variable costs
Variable costs increase as the machine sees more use and include repairs, fuel and lubricants, and labour.
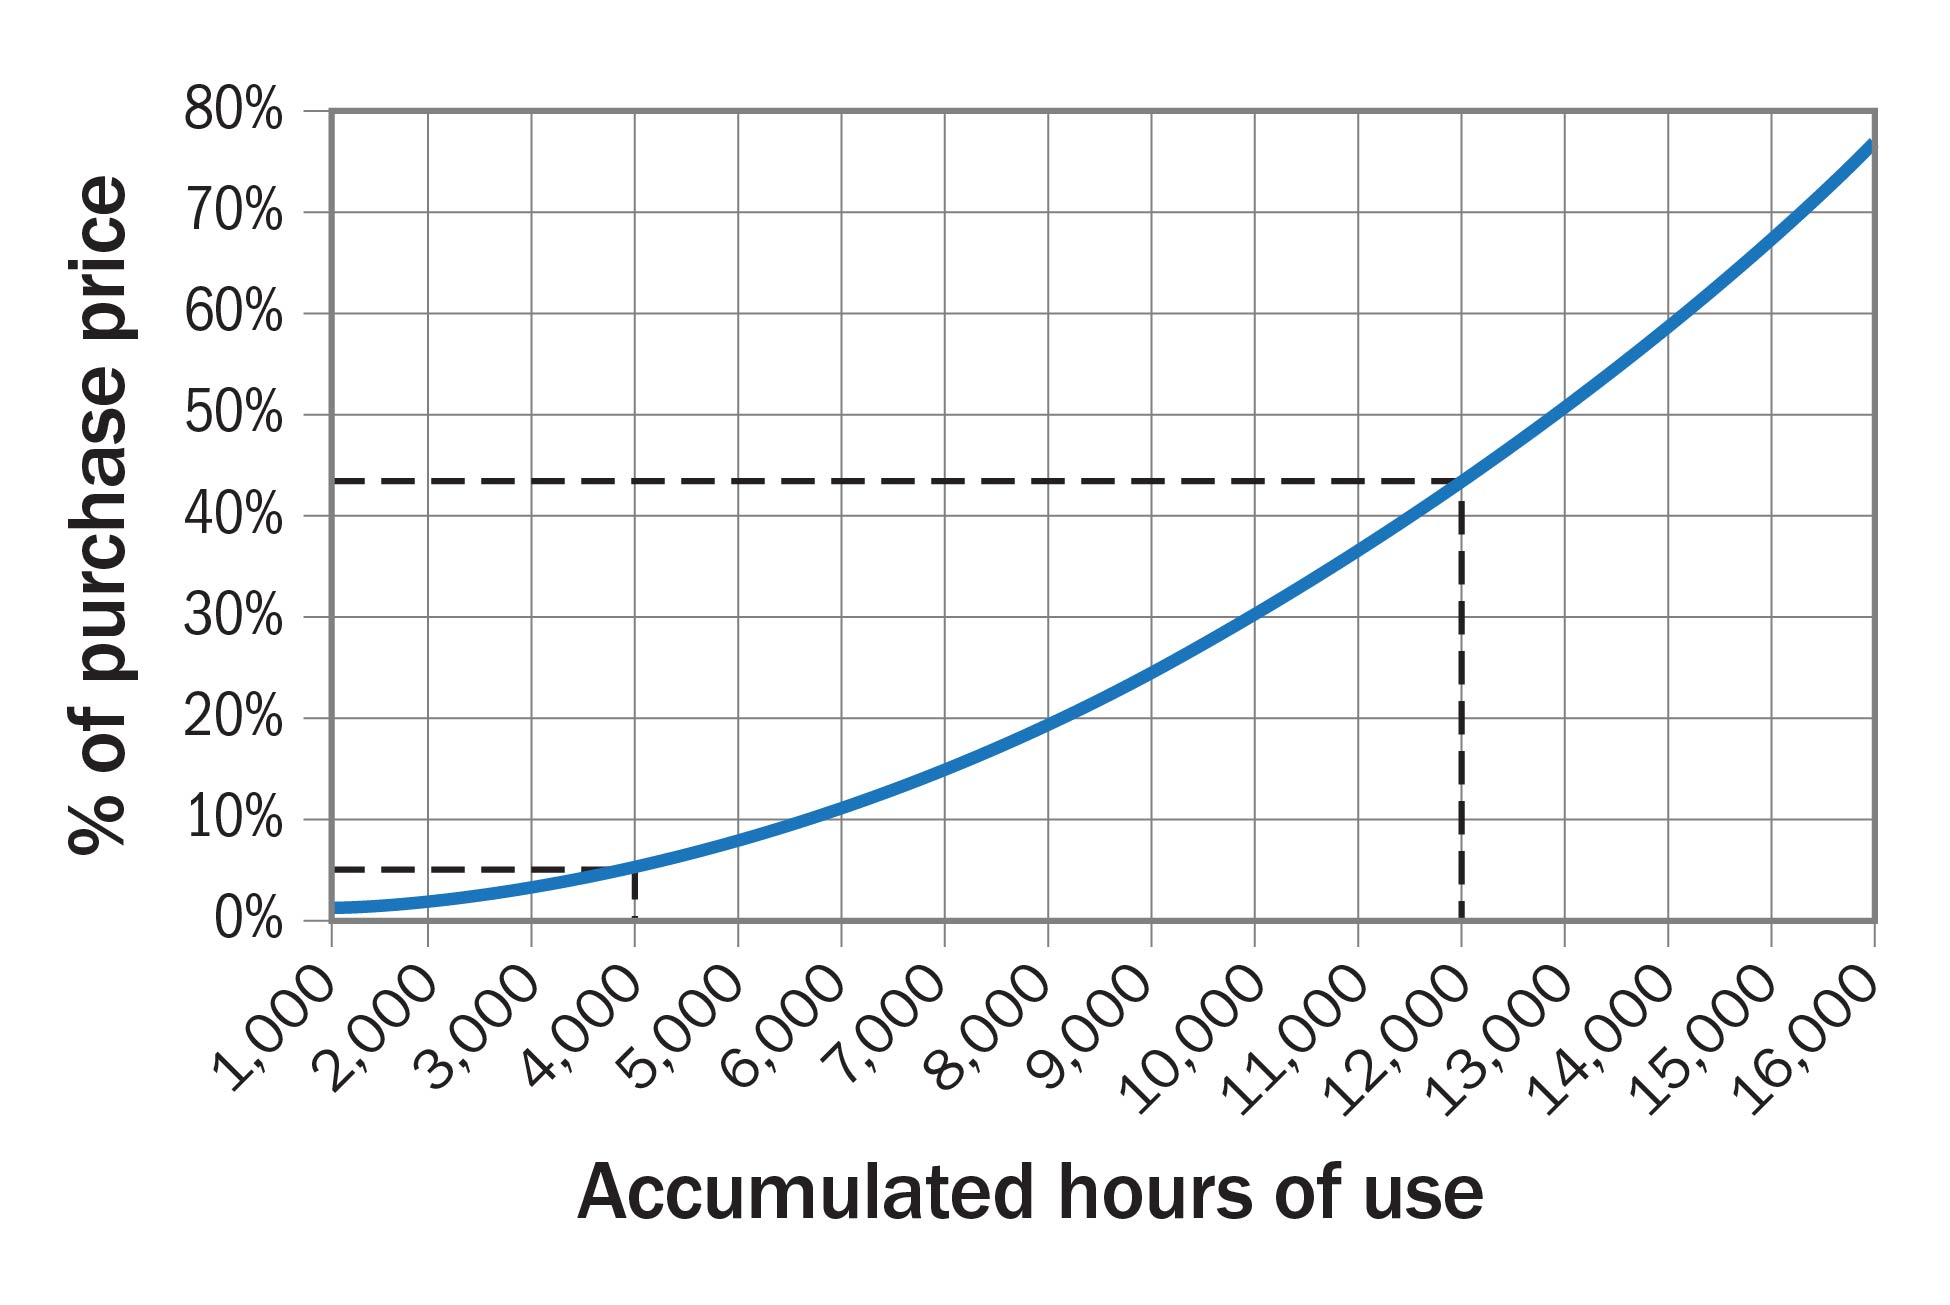
Repair and maintenance costs are relatively low early in the life of a machine, but repair costs rise quickly as a machine sees more hours of use. Figure 1 shows how repair costs accumulate for four-wheel-drive tractors. For example, at 4,000 hours, accumulated repair costs are estimated to be 4.8% of the purchase price while they rise sharply to 43.2% by 12,000 hours. Averaging these repair costs over the machine’s life can provide a reasonable estimate of annual repair costs. Routine maintenance costs, such as oil, lubricants and filters, will also need to be included. Oil and lubrication costs vary with the annual use of the machine and its maintenance schedule. Annual repair and maintenance rates as a percent of purchase price are shown in Table 1. Storing machines inside helps reduce the rate of weathering and wear, and also slows down the visible signs of aging.
Repair cost example using Table 1
Large round baler:
Purchase price: $75,000
Projected use: 100 hours/year over 15 years for total of 1,000 hours
Estimated annual repair costs are 1.58% of purchase price (from Table 1 – large round baler).
Repair costs will be approximately $1,185 per year (1.58% of $75,000) or about $17,775 over the 15‑year optimal life.
The best source of information for fuel use is past records. If these records are unavailable, calculate annual fuel consumption using the following method:
Average Diesel Consumption (L/hour)
= (0.218) × rated PTO HP/hour
Rated PTO horsepower is typically 85%–90% of rated engine horsepower. For Table 4, rated PTO horsepower is assumed to be 88% of engine horsepower.
Average Diesel Consumption (L/hour)
at rated engine HP
= (0.218 × 0.88) × rated engine HP or
= (0.192) × rated engine HP
The diesel fuel litre per hour rate is based on fuel consumption results at 75% load published by the Nebraska Tractor Test Laboratory, University of Nebraska, for tractors tested from 2018 to 2024 and includes a 15% loss of fuel efficiency under field conditions.
Diesel fuel consumption example
310 HP 4WD tractor × 0.192 L/engine HP-hour
= 59.5 L/hour
Diesel units will use less fuel than gasoline units. Multiply the diesel fuel consumption rate by 1.37 to estimate gasoline fuel consumption.
Average gasoline fuel consumption (L/hour)
= (0.192) × rated engine HP-hour × (1.37)
or
= (0.263) × rated engine HP
This table does not account for the variation in rates of work or horsepower requirements caused by differences in soil type, topography, field shape and drainage or equipment operators.
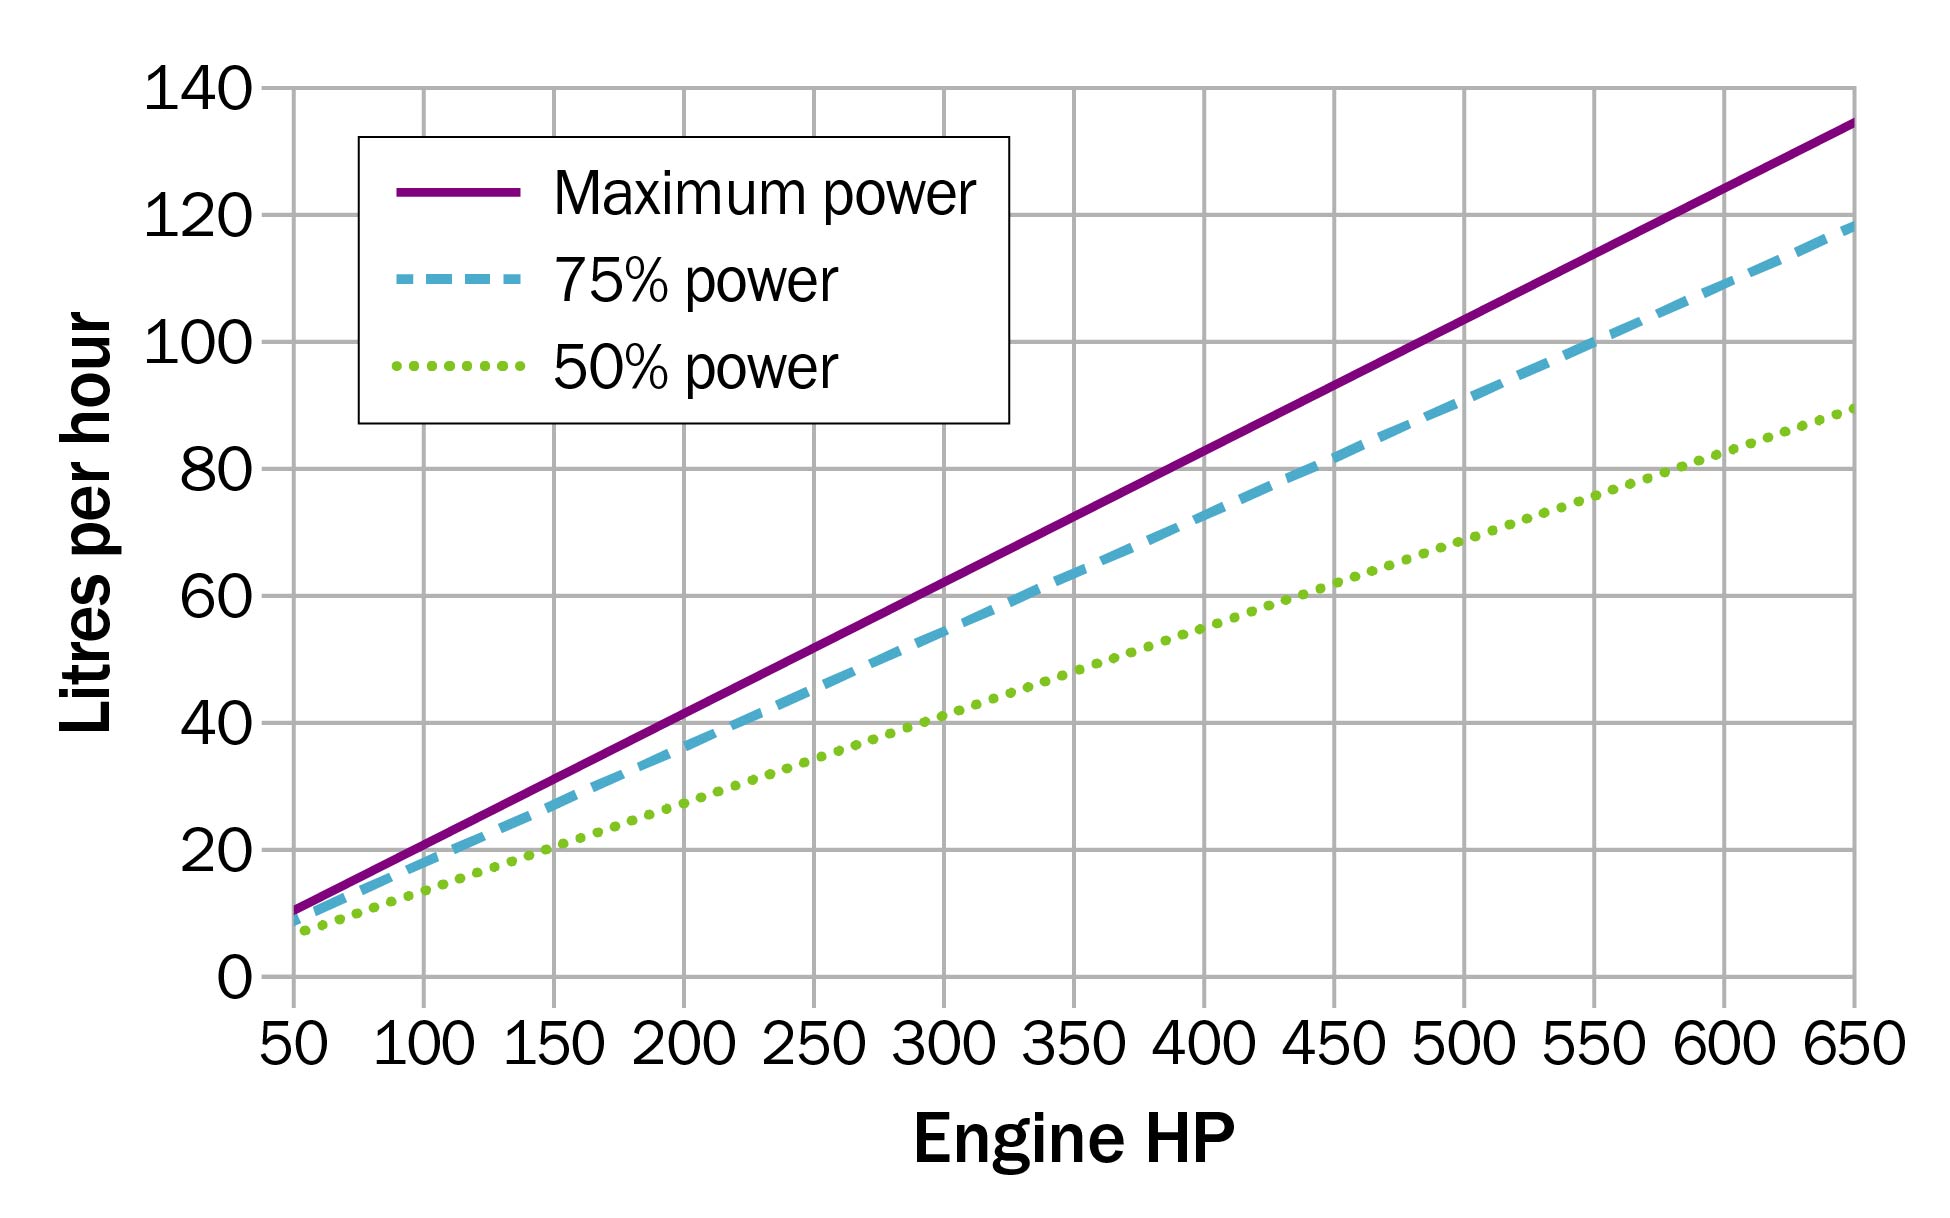
For alternative power loads, fuel usage can be determined by using Figure 2.
Labour costs are a consideration in any budget, but the value used will depend on the situation. Estimate the labour rate for the owner/operator using the opportunity cost for use of time. A constant rate for hired labour is appropriate. The rate should not be less than the typical labour rate for the area. Add labour costs where you feel it is justified.
There is one fundamental rule that must be followed to justify the ownership of any machine: use it. Machinery is expensive and ties up large amounts of capital. If a machine is to be cost-effective, it must see enough hours of use annually to have fixed and variable costs below the cost of the same operation being done via alternatives to purchasing.
| Equipment | Rated engine HP | Acres/hour | Litres/acre | Litres/hour |
|---|---|---|---|---|
| 4–18-in. furrow plow | 85 | 2.8 | 5.8 | 16.3 |
| 6–18-in. furrow plow | 160 | 3.0 | 10.2 | 30.7 |
| 8–18-in. furrow plow | 285 | 5.6 | 9.8 | 54.7 |
| 24-ft field cultivator | 160 | 9.0 | 3.4 | 30.7 |
| 31-ft field cultivator | 255 | 20.6 | 2.4 | 49.0 |
| 44-ft field cultivator | 305 | 29.1 | 2.0 | 58.6 |
| 16-ft chisel plow | 175 | 9.0 | 3.7 | 33.6 |
| 21-ft chisel plow | 275 | 12.6 | 4.2 | 52.8 |
| 24-ft tandem disk | 170 | 15.1 | 2.2 | 32.6 |
| 30-ft tandem disk | 255 | 15.3 | 3.2 | 49.0 |
| 10-ft offset disk | 125 | 6.0 | 4.0 | 24.0 |
| 16-ft offset disk | 175 | 9.6 | 3.5 | 33.6 |
| 21-ft vertical tillage | 215 | 19.6 | 2.1 | 41.3 |
| 30-ft vertical tillage | 305 | 27.2 | 2.2 | 58.6 |
| 43-ft vertical tillage | 420 | 39.2 | 2.1 | 80.6 |
| 12-row strip tillage | 330 | 17.5 | 3.6 | 63.4 |
| 6R – 30-in. row crop planter | 110 | 7.6 | 2.8 | 21.1 |
| 12R – 30-in. row crop planter | 160 | 15.3 | 2.0 | 30.7 |
| 16R – 30-in. row crop planter | 175 | 20.4 | 1.6 | 33.6 |
| 6R – 30-in. minimum-till planter | 85 | 6.4 | 2.6 | 16.3 |
| 12R – 30-in. minimum-till planter | 175 | 15.3 | 2.2 | 33.6 |
| 16R – 30-in. minimum-till planter | 255 | 20.4 | 2.4 | 49.0 |
| 25-ft grain drill | 160 | 11.7 | 2.6 | 30.7 |
| 35-ft grain drill | 255 | 16.3 | 3.0 | 49.0 |
| 12-ft presswheel drill | 85 | 5.1 | 3.2 | 16.3 |
| 20-ft presswheel drill | 160 | 8.5 | 3.6 | 30.7 |
| 15-ft no-till drill | 160 | 7.0 | 4.4 | 30.7 |
| 20-ft no-till drill | 200 | 9.3 | 4.1 | 38.4 |
| 90-ft sprayer, pull type | 110 | 49.6 | 0.4 | 21.1 |
| 90-ft sprayer, self-propelled | 85 | 72.5 | 0.2 | 16.3 |
| 9-ft mower conditioner | 45 | 4.4 | 2.0 | 8.6 |
| 13-ft rotary mower/conditioner | 85 | 9.7 | 1.7 | 16.3 |
| Square baler | 45 | 4.4 | 2.0 | 8.6 |
| Round baler 1,000 lb | 70 | 3.0 | 4.5 | 13.4 |
| Round baler 1,500 lb | 70 | 4.0 | 3.4 | 13.4 |
| Large size square baler | 160 | 16.3 | 1.9 | 30.7 |
| Round baler 1,000 lb/wrapper | 70 | 3.0 | 4.5 | 13.4 |
| 2-row forage harvester | 160 | 1.4 | 21.9 | 30.7 |
| Self-propelled forage harvester, 6-row, 15 ft | 625 | 5.1 | 20.6 | 105.0 |
| Large forage blower | 70 | N/A | N/A | 13.4 |
| Combine 6R – 30 in. corn head | 275 | 5.1 | 10.4 | 52.8 |
| Combine 12R – 30 in. corn head | 375 | 10.2 | 7.1 | 72.0 |
| Combine grain head 25 ft | 375 | 7.4 | 9.7 | 72.0 |
| Combine grain head 35 ft | 375 | 10.4 | 6.9 | 72.0 |
Consider the combine shown in Table 5 at three different levels of annual use. Capital recovery, insurance and housing are included in fixed costs. Fuel, repairs and operator labour are included in the variable costs.
This does not account for the issue of when the custom operator can arrive at your farm. For many, the benefits have to be better than break-even for them to hire a custom operator over ownership due to the control over when the crop is harvested. This same principle applies for any farm operation that requires timely access to machinery. Delays to planting or harvesting can have a significant effect on yield and quality.
The break-even for purchasing versus hiring a custom operator in this case is around 2,800 acres.
| Cost details | 200 hours/year | 300 hours/year | 400 hours/year |
|---|---|---|---|
| Acres per year | 2,040 | 3,060 | 4,080 |
| Fixed costs per year | $91,041 | $91,041 | $91,041 |
| Variable costs per year | $50,026 | $75,039 | $100,053 |
| Total annual costs | $141,067 | $166,080 | $191,094 |
| Annual cost per acre | $80.47 | $61.82 | $52.50 |
| Custom combine per acre | $65.00 | $65.00 | $65.00 |
Used machinery
When calculating the depreciation on used machinery, use the actual price paid for the machine minus its expected trade-in or salvage value, divided by the expected life of the machine on your farm. Increase repair rates to levels appropriate for the age or number of hours on the machine. Expect to have higher-than-normal repair expenses in the first year of ownership of a used machine as you bring it back into top operating shape.
Annual cash costs based on repayment
Cash costs estimate the impact of the purchase and its use on annual cash flow. Tax savings can be considered when applicable. If we take the debt servicing requirements of the combine in Table 5, assuming 50% of the purchase price is covered by a trade-in and/or cash payment and add insurance and housing costs, here is what the annual cash fixed costs of this machine would be:
Annual cash fixed costs example using Table 5
Combine — Purchase price: $910,000
Finance — $455,000 at 7.0%, 7 Years:
= $84,788 per year (principal and interest payments)
Insurance and housing — $910,000 at 1.0%: = $9,100
Total annual cash fixed costs = $93,888
The resulting change when considering annual cash costs is shown in Table 6.
Profitable operations would be able to justify covering fewer acres because of the additional tax savings from the capital cost allowance (CCA) on the machinery. Farm operations should consult with their tax professional to discuss tax management strategies with the purchase of the machinery.
| Cost details | 200 hours/year | 300 hours/year | 400 hours/year |
|---|---|---|---|
| Acres per year | 2,050 | 3,080 | 4,080 |
| Variable costs per year | $50,026 | $75,039 | $100,053 |
| Cash fixed costs | $93,888 | $93,888 | $93,888 |
| Total annual cash costs | $143,914 | $169,927 | $193,941 |
| Annual cash cost per acre | $69.71 | $54.65 | $48.16 |
Alternatives to purchasing machinery
The 3 most common alternatives to purchasing machinery are leasing, hiring custom farmwork or equipment rental.
Leasing farm equipment
Leasing has become a popular option to consider when acquiring farm machinery. The popularity of leasing is in part due to the increasing cost of machinery, the outlay of large amounts of capital and managing cash flow. The decision to lease or purchase depends on a number of factors, cash flow being an important one. Lease payments are usually lower than loan payments, reducing cash flow requirements. If cash flow is tight, leasing may be more attractive. This is especially true if investment elsewhere in the business can return a higher rate than the cost of the lease.
Custom farmwork and machinery rental
Hiring custom farmwork provides an option to farmers to purchase the service instead of owning the equipment and doing the work. Custom farmwork operators are well advised to calculate their own machinery costs to ensure they are covering their costs plus a return for their risk and time.
Machinery rental allows farmers access to equipment for short periods of time when it is needed without the full cost of ownership and operating expenses. The latest custom farmwork and rental rates charged in Ontario summary is available.
Decision-making aids
Machinery tools
The machinery cost calculation worksheet contains a machinery cost calculator, cost charts and fact sheets on machinery budgeting.
Download the machinery cost calculator spreadsheet.
Summary
Farm machinery is a significant investment and farm operators should ensure that they not only can afford to pay for the machinery but can also justify it for the amount they will be using it. The best source of information to budget farm machinery costs is your records.
This fact sheet is intended as general information, not specific advice concerning individual situations. The Government of Ontario assumes no responsibility for persons using this publication as a basis in machinery purchase decisions.
The information presented is prepared as a representative guide to estimating machinery costs and is not intended to recognize or predict the costs for any one particular operation. Individual circumstances and maintenance routines can vary significantly to impact machinery costs.
References
American Society of Agricultural and Biological Engineers Standards. American Society of Agricultural and Biological Engineers. 2025.
Commodity Costs and Returns Estimation Handbook. Agricultural and Applied Economics Association, 2000.
Farm Machinery Custom and Rental Rate Guide 2024–25. Saskatchewan Ministry of Agriculture.
Illinois Machinery Cost Estimates for 2023. University of Illinois, Department of Agricultural and Consumer Economics. 2023.
Minnesota Farm Machinery Economic Cost Estimates for 2019. University of Minnesota, Department of Applied Economics. 2019.
Tractor Fuel Consumption Results, 2018–2024. Nebraska Tractor Test Laboratory Test Reports, University of Nebraska Tractor Test Laboratory. 2018–2024.
Machinery cost budgeting terms
- Accumulated repair costs
- Total cost of repairs that have been incurred over the life of the machine to date.
- Capital cost allowance
- An amount (expressed as a %) allowed to be expensed for tax purposes against the cost of capital assets acquired by a business. Different types of assets attract different percentages.
- Capital recovery method
- The Agricultural and Applied Economics Association recommends the use of the capital recovery method in their Commodity Costs and Returns Estimation Handbook to calculate depreciation and interest. This method calculates interest on investment and depreciation combined. The capital recovery method calculates an annual machinery cost that recovers the value of the machinery within a specified period at a designated rate of interest.
- Depreciation, straight line
- A method in which equal amounts of depreciation expense is budgeted for each time period over the life of the asset.
- Insurance rate
- Percentage of the value charged by commercial insurance companies to insure the machinery investment.
- Lease
- A contract for the use of machinery for an agreed period of time in return for periodic payments. Ownership remains with the lessor. The lessee acquires the right of temporary possession and use.
- Nebraska Tractor Test Data
- Data from tractors tested at the University of Nebraska Tractor Test Laboratory under similar conditions to provide a means of comparison of performance of different tractor makes and models.
- Operating costs
- Variable costs, costs that depend directly on the amount of machine use.
- Opportunity cost
- The potential benefit that is lost by choosing one good or service at the expense of giving up another good or service. For example, if a farmer could earn a salary of $55,000 by working off the farm, $55,000 would be the opportunity cost of choosing to work on the farm.
- Optimal life
- When the equipment value has declined to one-third of its original purchase price. The salvage value at the end of the optimal life is assumed to be 33% of the purchase price, but the years of service varies by equipment type.
- Ownership costs
- Fixed costs, costs that do not depend on the amount of machine use.
- Total annual cost
- The sum of fixed (ownership) and variable (operating) costs.
Machinery cost calculation worksheet
A printable version of the worksheet is available in PDF format to help you calculate your machinery costs. Download the PDF for this printable version.
Author credits
This fact sheet was written and updated by John Molenhuis, business analysis and cost of production specialist, OMAFA, Brighton.
Footnotes
- footnote[1] Back to paragraph Multiply engine HP by 0.88 to arrive at power takeoff HP.
- footnote[2] Back to paragraph Illinois machinery cost estimates for 2023. University of Illinois, Department of Agricultural and Consumer Economics, 2023.
- footnote[3] Back to paragraph Nebraska Tractor Test Laboratory, 2018–2024, Tractor fuel consumption results.
- footnote[4] Back to paragraph Custom Farmwork and Equipment Rental Survey Results, Ministry of Agriculture, Food and Agribusiness (OMAFA), 2024.