Labour market report, May 2022
Employment in Ontario was little changed in May. Get the details in this report.
Quick facts
In May 2022:
- There were 12.5 million people in Ontario aged 15 years or older
- 8.2 million (65.5%) were in the labour force. The labour force increased in May (8,000 or 0.1%) compared to April.
- 7.7 million (61.9%) were employed, little changed from April.
- Ontario's unemployment rate increased slightly to 5.5% in May from 5.4% in April and 447,700 people were unemployed, up 6,100 (1.4%) from April.
Important note:
This report is based on the Labour Force Survey (LFS), a household survey carried out by Statistics Canada. May’s LFS results cover labour market conditions during the week of May 15 to 21.
Employment little changed in May
Employment in Ontario was little changed in May (1,900 or 0.0%), after increasing by 14,300 (0.2%) in April. A total of 7,739,100 people were employed in Ontario in May.
Employment in Canada rose by 39,800 (0.2%) in May, after little change (15,300 or 0.1%) in April. A total of 19,640,000 people were employed in Canada in May.
Chart 1 shows employment in Ontario from January 2005 to May 2022.
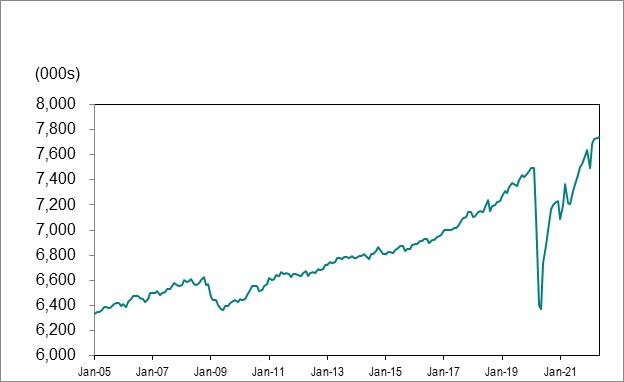
Source: Statistics Canada, Labour Force Survey, Table 14-10-0287-01, (seasonally adjusted data).
Full-time vs. part-time
Full-time job gains (13,300 or 0.2%) were offset by part-time job losses (-11,400 or -0.8%) in Ontario in May.
Employment change by sex and age
Employment increased by 22,200 (0.6%) to 3,688,000 for women in May after increasing by 29,700 (0.8%) in April. Employment decreased by 20,300 (-0.5%) to 4,051,100 for men, after decreasing by 15,400 (-0.4%) in April.
Youth (ages 15-24) employment increased by 14,000 (1.4%) to 1,034,100 in May, after increasing by 2,100 (0.2%) in April. Employment for people aged 25 to 54 increased by 2,800 (0.1%) to 5,011,300, after being unchanged in April. Employment for those aged 55 and older decreased by 14,800 (-0.9%) to 1,693,800, following an increase of 12,600 (0.7%) in April.
Employment change by industry
Ontario’s largest industry groups by employment in May include wholesale and retail trade (1,144,100 or 14.8% of total employment), health care and social assistance (937,100 or 12.1%), professional, scientific and technical services (811,800 or 10.5%), manufacturing (768,300 or 9.9%) and finance, insurance, real estate, rental and leasing (651,300 or 8.4%).
In May, seven of the sixteen major industry groups had employment levels that were above April levels. Wholesale and retail trade (16,300 or 1.4%), educational services (14,400 or 2.5%), accommodation and food services (11,700 or 3.0%), public administration (7,200 or 1.7%) and information, culture and recreation (5,600 or 1.6%) led job gains.
Eight of the sixteen major industry groups had employment levels that were below April levels. There were notable employment losses in construction (-25,100 or -4.2%), manufacturing (-15,500 or -2.0%) and agriculture (-5,000 or -7.3%).
Employment in forestry, fishing, mining, quarry, oil and gas was unchanged from April levels.
Chart 2 shows industries by employment change in Ontario, April 2022 to May 2022.
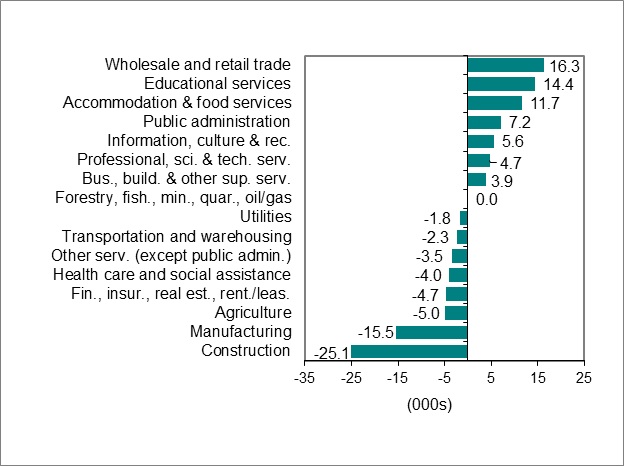
Source: Statistics Canada, Labour Force Survey, Table 14-10-0355-02, (seasonally adjusted data).
Employment change by occupation
Ontario’s largest occupational groups by employment in May include sales and service (1,693,700 or 21.7% of total employment), business, finance and administration (1,342,200 or 17.2%), trades, transport and equipment operators (976,900 or 12.5%), education, law and social, community and government services (897,400 or 11.5%) and natural and applied sciences (827,500 or 10.6%).
Nine of the ten major occupational groups in Ontario had net employment gains in the first five months of 2022, compared to the same period in 2021. Sales and service (145,300 or 9.6%), business, finance and administration (90,900 or 7.2%), natural and applied sciences (87,300 or 12.5%) and management (85,300 or 12.6%) led job gains. Employment losses were recorded in art, culture, recreation and sport (-11,400 or -5.3%).
Chart 3 shows occupations by employment change in Ontario, May 2021 (year-to-date) to May 2022 (year-to-date).
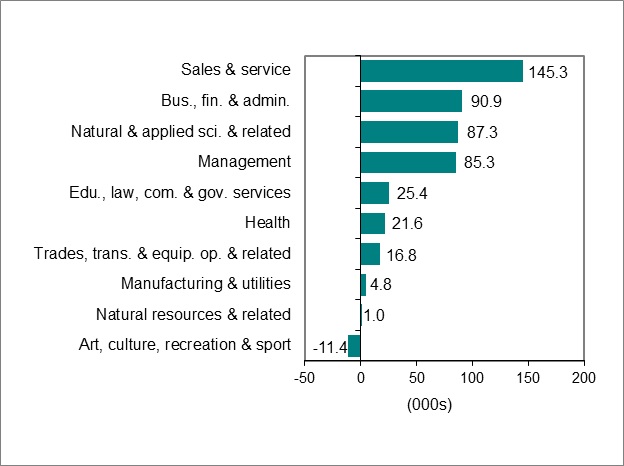
Source: Statistics Canada, Labour Force Survey, Table 14-10-0296-01, (data unadjusted for seasonality).
Employment change in urban centres
In May 2022, employment in 15 of the 16 Ontario Census Metropolitan Areas (CMAs) was at or above its May 2021 level, led by Toronto (284,300 or 8.6%) and followed by Ottawa-Gatineau (36,000 or 4.7%), St. Catharines-Niagara (34,400 or 17.6%) and Oshawa (25,900 or 12.7%). The employment level fell in Brantford (-1,000 or -1.3%).
Chart 4 shows employment change for Ontario Census Metropolitan Areas (CMAs) from May 2021 to May 2022.
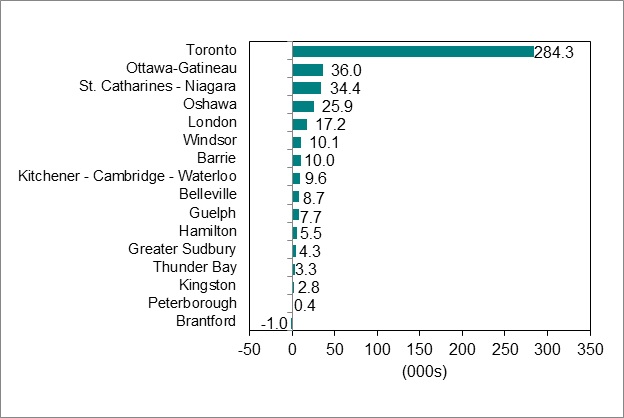
Source: Statistics Canada, Labour Force Survey, Table 14-10-0380-01, (seasonally adjusted data three-month moving average to reduce volatility caused by small sample size).
Unemployment rate increased to 5.5%
Line graph for Chart 5 shows unemployment rates in Canada and Ontario from January 2005 to May 2022.
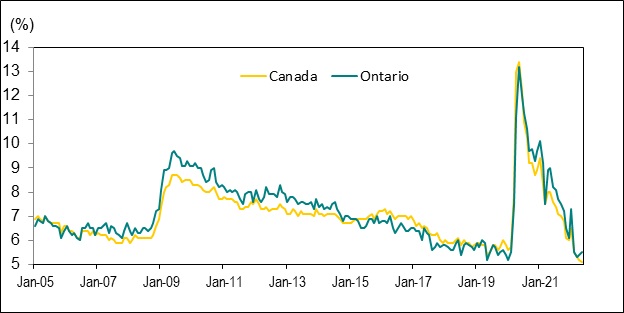
Source: Statistics Canada, Labour Force Survey, Table 14-10-0287-01, (seasonally adjusted data).
Ontario’s unemployment rate was 5.5% in May, slightly above the rate in April (5.4%) but well below the rate from May 2021 (9.0%).
Canada’s unemployment rate reached a new record low of 5.1% in May, slightly below the rate in April (5.2%) and well below the rate from a year ago (8.0%). The provincial unemployment rate has not been lower than the Canadian rate since June 2020, when the Ontario rate was 12.0% compared to the Canadian rate of 12.2%.
Unemployment rate by sex, age and visible minority status
The unemployment rate for women decreased to 5.2% in May from 5.4% in April. The rate for men increased to 5.7% in May from 5.4% in April.
For individuals aged 15 to 24, the unemployment rate rose to 11.4% in May from 11.2% in April. The youth unemployment rate was 11.3% in February 2020 and reached a record high of 29.5% in May 2020.
The unemployment rate for individuals aged 25 to 54 rose to 4.7% in May from 4.5% in April. The unemployment rate for those aged 55 and older decreased to 3.8% in May from 4.4% in April.
In Ontario, the unemployment rate among population groups designated as visible minorities was estimated at 7.2% in May in compared to a 4.8% rate for those who are not visible minorities and did not identify as Indigenous (data are for the population aged 15 years and over and are not adjusted for seasonality).
Unemployment rate by urban centre
In May, the average unemployment rate decreased from April in nine of the 16 Ontario Census Metropolitan Areas (CMAs). The largest decreases were seen in Windsor (6.4% in April to 5.8% in May), Barrie (7.1% to 6.6%) and Ottawa-Gatineau (4.6% to 4.3%).
Seven CMAs had average unemployment rates that increased from April to May. The largest increases were seen in Peterborough (3.9% in April to 5.9% in May), Greater Sudbury (3.5% to 4.4%) and London (4.8% to 5.2%).
Chart 6 shows the average unemployment rate for Ontario Census Metropolitan Areas (CMAs) in May 2022.
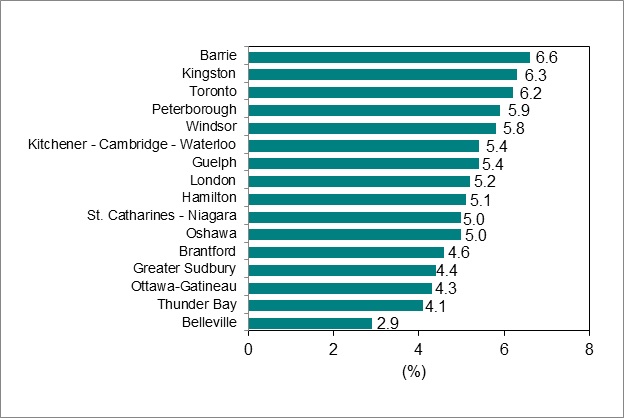
Source: Statistics Canada, Labour Force Survey, Table 14-10-0380-01, (seasonally adjusted data three-month moving average to reduce volatility caused by small sample size).
Long-term unemployment
In May, an average of 96,900 Ontarians or 21.6% of all unemployed people were unemployed for 27 weeks or longer (long-term unemployed). This compared to 90,100 or 20.4% of all unemployed people in April and 211,200 or 29.7% of all unemployed people a year earlier in May 2021. The long-term unemployed share has increased each month from February 2022 after trending downward since September 2021, when it reached 28.5%.
The average time in unemployment was 22.1 weeks in May, unchanged from the average in April and slightly below the average in May 2021 (23.0 weeks).
Chart 7 shows Ontario’s long-term unemployed (27 weeks or more) as a percentage of total unemployment, January 2006 to May 2022.
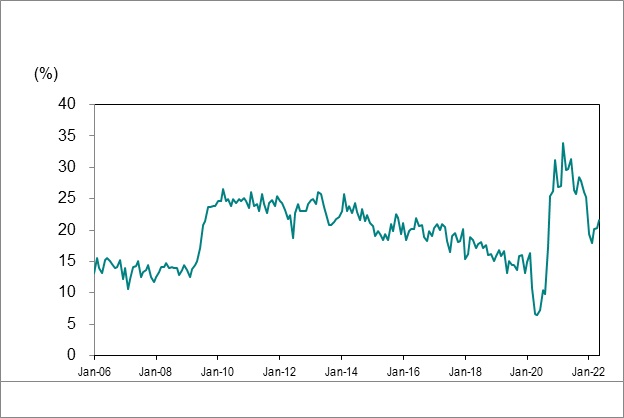
Source: Statistics Canada, Labour Force Survey, Table 14-10-0342-01, (seasonally adjusted data).
Spotlight: Average hourly wages by sex, age and industry
Important note:
The average hourly wage rates reported in this section have not been adjusted to account for the rate of inflation.
Chart 8 shows average hourly wages rates, Ontario and Canada, January 2015 to May 2022.
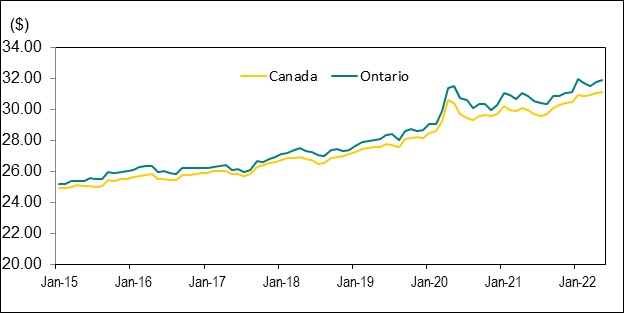
Source: Statistics Canada, Labour Force Survey, Table 14-10-0063-01, (data unadjusted for seasonality).
The average hourly wage rate in Ontario was $31.89 in May, slightly above the average rate across Canada ($31.12). Ontario’s average hourly wage rate in May grew by 3.3% ($1.01) from May 2021, up from 2.3% in April.
Notably, May’s wage growth (3.3%) was lower than the growth seen in the Ontario Consumer Price Index as of April (6.9%). The Consumer Price Index (CPI) is a measure of inflation that represents changes in prices for goods and services as experienced by consumers.
The average hourly wage rate was $30.04 for women in May, rising 3.3% ($0.95) from a year ago. For men, the average hourly wage rate was $33.70, an increase of 3.4% ($1.10) from May 2021.
For individuals aged 15 to 24, the average hourly wage rate was $18.96 in May, an increase of 2.4% ($0.44) from May 2021. The average hourly wage rate for individuals aged 25 to 54 rose to $34.60 in May, up 4.2% ($1.40) from a year ago. The average hourly wage rate for those aged 55 and older increased by 5.0% ($1.59) over the past year, reaching $33.42 in May.
In May, the industries with the largest increase in their average hourly wage rates compared to a year ago were:
- Professional, scientific and technical services: +9.9% ($3.67) to $40.78
- Business, building and other support services: +9.5% ($2.15) to $24.88
- Accommodation and food services: +7.1% ($1.21) to $18.22
The industries with the largest decrease in their average hourly wage rates in May 2022 compared to May 2021 were:
- Information, culture and recreation: -4.1% ($1.38) to $31.89
- Agriculture: -3.6% ($0.74) to $19.89
- Public administration: -3.0% ($1.25) to $40.74
Download data
Source: Statistics Canada, Labour Force Survey
May 2022 Labour Market Report:
- CSV, Chart 1, employment in Ontario from January 2005 to May 2022, 1KB
- CSV, Chart 2, industries with highest and lowest employment change in Ontario, April 2022 to May 2022 , 2KB
- CSV, Chart 3, employment change for occupations in Ontario from May 2021 (year-to-date) to May 2022 (year-to-date), 2KB
- CSV, Chart 4, employment change for Ontario Census Metropolitan Areas (CMAs) from May 2021 to May 2022, 2KB
- CSV, Chart 5, unemployment rates, Ontario and Canada, January 2005 to May 2022, 2KB
- CSV, Chart 6, average unemployment rates for Ontario Census Metropolitan Areas (CMAs), May 2022, 1KB
- CSV, Chart 7, Ontario’s long-term unemployed (27 weeks or more) as a percentage of total unemployment, January 2006 to May 2022, 2KB
- CSV, Chart 8, average hourly wage rates, Ontario and Canada, January 2015 to May 2022, 2KB