Labour market report, April 2022
Employment in Ontario increased by 14,300 in April. Get the details in this report.
Quick facts
In April 2022:
- There were 12.5 million people in Ontario aged 15 years or older
- 8.2 million (65.5%) were in the labour force. The labour force increased in April (26,100 or 0.3%) compared to March.
- 7.7 million (62.0%) were employed, up by 14,300 (0.2%) from March
- Ontario's unemployment rate increased slightly to 5.4% in April from 5.3% in March and 441,600 people were unemployed, up 2.7% (11,800) from March
Important note:
This report is based on the Labour Force Survey (LFS), a household survey carried out by Statistics Canada. April’s LFS results cover labour market conditions during the week of April 10 to 16.
The April LFS reflects the easing of public health measures in Ontario that began on March 1, 2022, including lifting capacity limits and proof of vaccination requirements for all settings.
Employment increased in April
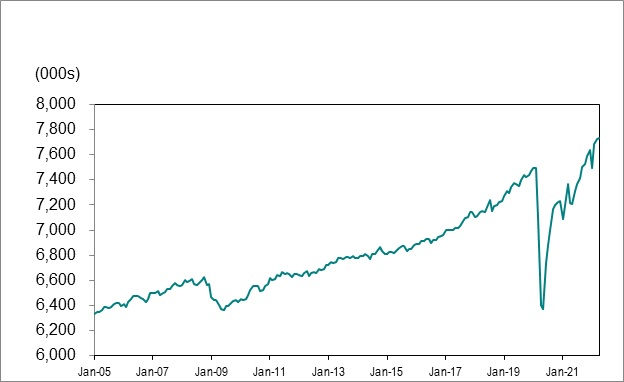
Employment in Ontario increased in April by 14,300 (0.2%), after increasing by 35,100 (0.5%) in March
Ontario employment (7,737,200) was above its pre-pandemic level by 242,600 (3.2%) with April’s increase.
Chart 1 shows employment in Ontario from January 2005 to April 2022.
Source: Statistics Canada, Labour Force Survey, Table 14-10-0287-01, (seasonally adjusted data).
Full-time vs. part-time
Part-time jobs accounted for all of April’s job gains, increasing by 30,000 (2.2%) positions in April. Full-time jobs decreased by 15,700 (-0.2%).
Employment change by sex and age
Employment increased by 29,700 (0.8%) for women and decreased by 15,400 (-0.4%) for men in April. Employment among men was 3.3% (131,500) above its pre-COVID February 2020 level, while employment among women was 3.1% (111,000) above.
Youth (ages 15-24) employment increased by 2,100 (0.2%) in April, after increasing by 4,000 (0.4%) in March. Employment for people aged 25 to 54 was unchanged in April, following an increase of 13,500 (0.3%) in March. Employment for those aged 55 and older increased by 12,600 (0.7%), after increasing by 17,600 (1.0%) in March.
In April, youth employment was on par with its pre-COVID February 2020 level, but has made significant gains since January when it was 9.0% (91,700) below that pre-pandemic level. Employment among those aged 25-54 was 4.5% (216,200) above its February 2020 level. Employment among older workers (those aged 55 and older) rose above its pre-pandemic by 1.6% (26,700), the second consecutive month the level has increased after not doing so since March 2021.
Employment in Canada was little changed in April, rising by just 15,300 (0.1%) after increasing by 72,500 (0.4%) in March.
Employment change by industry
The government’s restrictions and health measures aimed at addressing the impact of COVID-19, as well as the easing of these restrictions and measures, should be considered in the context of employment change by sector.
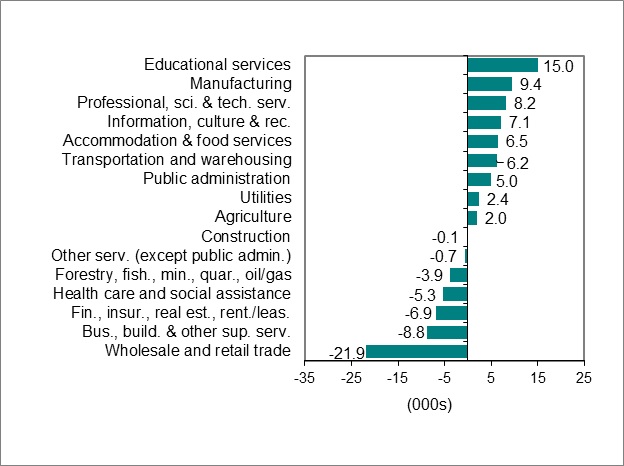
Educational services (15,000 or 2.7%), manufacturing (9,400 or 1.2%), professional, scientific and technical services (8,200 or 1.0%), information, culture, recreation and sport (7,100 or 2.1%) and accommodation and food services (6,500 or 1.7%) led job gains in April. There were notable employment losses in wholesale and retail trade (-21,900 or -1.9%), business, building and other services (-8,800 or -3.0%) and finance, insurance, real estate, rental and leasing (-6,900 or -1.0%).
In April, eleven of the sixteen major industry groups had employment levels that were above pre-COVID February 2020 levels, led by professional, scientific and technical services (136,400 or 20.3%), finance, insurance, real estate, rental and leasing (52,900 or 8.8%), information, culture, recreation and sport (40,800 or 13.6%), construction (34,300 or 6.1%) and public administration (31,100 or 8.0%).
Employment in accommodation and food services (-53,600 or -12.1%) was furthest below its pre-COVID February 2020 level, followed by other services, except public administration (-48,500 or -15.8%) and business, building and other services (-41,000 or -12.5%).
Chart 2 shows industries by employment change in Ontario, March 2022 to April 2022.
Source: Statistics Canada, Labour Force Survey, Table 14-10-0355-02, (seasonally adjusted data).
Unemployment rate increased to 5.4%
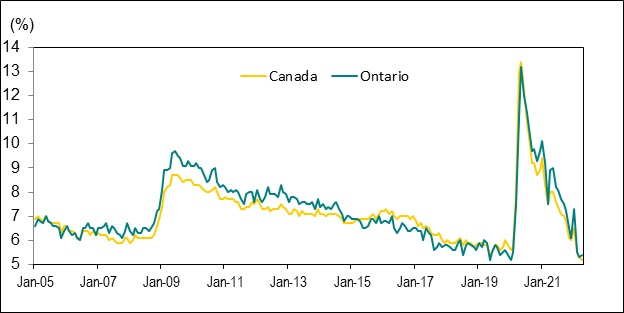
Chart 3 shows unemployment rates, Ontario and Canada, January 2005 to April 2022.
Source: Statistics Canada, Labour Force Survey, Table 14-10-0287-01, (seasonally adjusted data).
Ontario’s unemployment rate was 5.4% in April, slightly above the rate in March (5.3%) but below the February 2020 pre-pandemic rate (5.5%).
Canada’s unemployment rate was 5.2% in April. The provincial unemployment rate has not been lower than the Canadian rate since June 2020 when the Ontario rate was 12.0% compared to the Canadian rate of 12.2%. Canada’s unemployment rate was 5.3% in March and the February 2020 pre-pandemic rate was 5.7%.
Unemployment rate by sex, age and visible minority status
The unemployment rate for women decreased to 5.4% in April, falling below the February 2020 pre-pandemic rate of 5.6%. It was 6.1% in March. The rate for men increased to 5.4% in April, bringing it on par with the February 2020 pre-pandemic rate. It was 4.5% in March.
For individuals aged 15 to 24, the unemployment rate rose to 11.2% in April from 10.4% in March. The youth unemployment rate was 11.3% in February 2020 and reached a record high of 29.5% in May 2020.
The unemployment rate for individuals aged 25 to 54 fell to 4.5% in April, slightly below its February 2020 pre-pandemic rate of 4.6%. The rate for this cohort was 4.7% in March.
The unemployment rate for those aged 55 and older increased to 4.4% in April, up from 3.5% in March and above its February 2020 pre-pandemic rate of 4.1%.
In Ontario, the unemployment rate among population groups designated as visible minorities was estimated at 6.9% in April in comparison to a 5.0% rate for non-visible minorities and those that did not identify as Indigenous (data are for the population aged 15 years and over and are not adjusted for seasonality).
Long-term unemployment
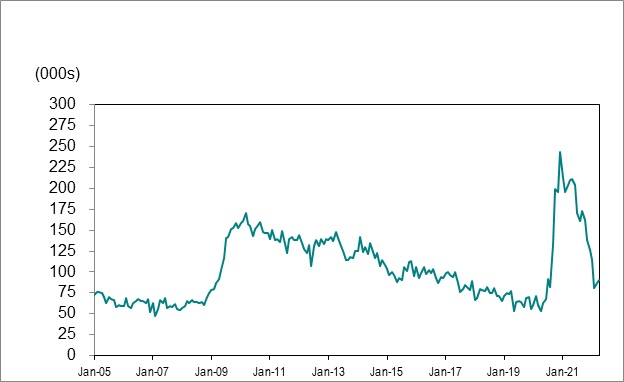
In April, an average of 90,100 Ontarians or 20.4% of all unemployed people were unemployed for 27 weeks or longer (long-term unemployed). This compared to 86,200 or 20.1% of all unemployed people in March and was also higher than the pre-COVID February 2020 level of 71,100. Long-term unemployment increased for the second consecutive month after trending downward since September 2021 when it reached 173,400.
The average time in unemployment was 22.1 weeks in April 2022 compared to 16.0 weeks in February 2020.
Chart 4 shows the number of people unemployed for 27 weeks or more in Ontario, January 2005 to April 2022.
Source: Statistics Canada, Labour Force Survey, Table 14-10-0342-01, (seasonally adjusted data).
Employment and unemployment in urban centres
Employment change in urban centres
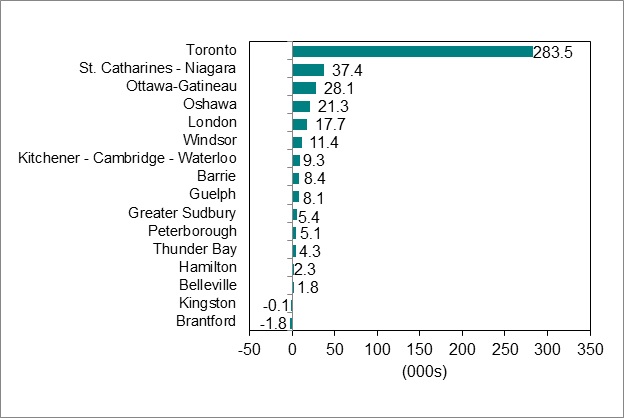
Chart 5 shows employment change for Ontario Census Metropolitan Areas (CMAs) from April 2021 to April 2022.
Source: Statistics Canada, Labour Force Survey, Table 14-10-0380-01, (seasonally adjusted data three-month moving average to reduce volatility caused by small sample size).
In April 2022, employment in fourteen of the sixteen Ontario Census Metropolitan Areas (CMAs) was at or above its April 2021 level, led by Toronto (283,500 or 8.6%) and followed by St. Catharines-Niagara (37,400 or 19.2%) and Ottawa-Gatineau (28,100 or 3.7%). The employment level fell in Brantford (-1,800 or -2.3%).
Employment in most of the 16 Ontario CMAs had reached or surpassed pre-COVID February 2020 levels in April 2022, led by Toronto (124,100 or 3.6%), London (25,600 or 9.5%), Ottawa-Gatineau (23,800 or 3.1%) and St. Catharines-Niagara (23,400 or 11.2%).
Barrie (-9,100 or -7.1%), Belleville (-5,800 or -10.0%) and Kitchener-Cambridge-Waterloo (-5,200 or -1.6%) had employment levels that were notably below pre-COVID February 2020 levels.
Lowest and highest unemployment rates in urban centres
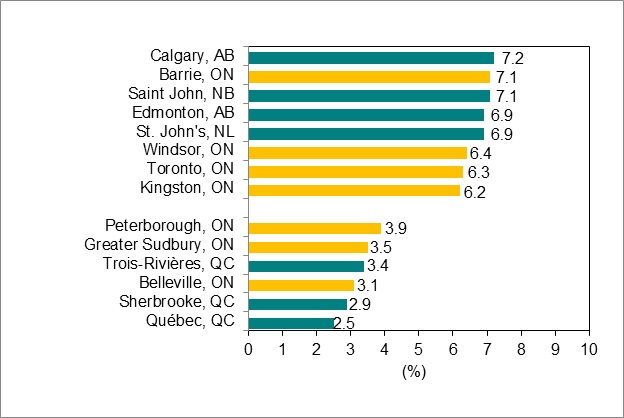
Chart 6 shows Census Metropolitan Areas (CMAs) with highest and lowest unemployment rates in Canada, April 2022.
Source: Statistics Canada, Labour Force Survey, Table 14-10-0380-01, (seasonally adjusted data three-month moving average to reduce volatility caused by small sample size).
Calgary, Alberta recorded the highest unemployment rate in Canada in April (7.2%), followed by Saint John, New Brunswick (7.1%) and Barrie (7.1%).
Québec City recorded the lowest unemployment rate in Canada in April (2.5%), followed by Sherbrooke, Quebec (2.9%) and Belleville (3.1%).
Download data
Source: Statistics Canada, Labour Force Survey
April 2022 Labour Market Report:
- CSV, Chart 1, employment in Ontario from January 2005 to April 2022, 1KB
- CSV, Chart 2, industries with highest and lowest employment change in Ontario, March 2022 to April 2022, 2KB
- CSV, Chart 3, unemployment rates, Ontario and Canada, January 2005 to April 2022, 2KB
- CSV, Chart 4, number of people unemployed for 27 week or more in Ontario, January 2005 to April 2022, 2KB
- CSV, Chart 5, employment change for Ontario Census Metropolitan Areas (CMAs) from March 2021 to April 2022, 2KB
- CSV, Chart 6, Census Metropolitan Areas (CMAs) highest and lowest unemployment rates, April 2022, 2KB