Public Accounts 2017-18: Annual report
The annual report is a high-level summary of the fiscal year’s results. It includes financial statements, analyzes the state of the province’s finances and outlines achievements for the fiscal year.
Foreword
I am pleased to present to you the Province of Ontario’s Public Accounts for the year of 2017-18. The Public Accounts offer the people of Ontario an honest and transparent picture of the province’s financial situation. Unfortunately, these documents also reveal that under the previous government, spending occurred at an unsustainable level.
Your Government for the People believes that it is our collective responsibility to achieve fiscal prudence and efficiency while ensuring programs and services meet the needs of the people we serve. We have, and will continue to, take action and deliver on our promise to restore accountability and trust in the province’s finances.
The road ahead will be a challenging one, but I can assure you that we are committed to driving strategic change, and we are focusing our efforts on the priorities that matter most to you.
Knowing the challenges that we face, we have moved quickly and decisively, securing experts to lead a thorough line-by-line review of past spending across all government programs and services. This assessment will help pinpoint the areas we need to focus on to fix the province’s finances. As part of that, we have launched Planning for Prosperity, an online public consultation where the people of this great province have had the opportunity to share their ideas about government services in an open and transparent way.
Additionally, we have taken unprecedented action to restore the people’s trust. On July 17, 2018, the Independent Financial Commission of Inquiry (Commission) was established. The Commission had a mandate to assess and advise on past accounting practices and the budgetary position of the Province relative to the one presented in the 2018 Budget. The final report of the Commission was delivered to the Attorney General and Minister of Finance on August 30, 2018. The Public Accounts of Ontario 2017–2018 are informed by the Commission’s recommendations. As part of this report, we are accepting the recommendations from those experts and have adjusted the 2017-18 Public Accounts to reflect that advice.
The challenges we have inherited from the previous government are significant. However, Ontario’s Government for the People has, and will continue to, put our province back on the path to fiscal health and economic growth. We are collaborating with ministries and stakeholders across the broader public sector to harness the power of innovation, find efficiencies, and ensure our province remains competitive. We will continue to be open, honest and transparent about the state of Ontario’s finances as we work to ensure that every tax dollar spent achieves the best value for the people of Ontario.
The work will be difficult but the proper management of public finances is a moral imperative. It is our duty and our legacy to achieve structural balance and a more sustainable government, for the people.
Original signed by
The Honourable Peter Bethlenfalvy
President of the Treasury Board
Introduction
The Annual Report is a key element of the Public Accounts of the Province of Ontario and is central to demonstrating the Province’s transparency and accountability in reporting its financial activities and position. Ontario’s Consolidated Financial Statements present the financial results for the 2017-18 fiscal year against the 2017 Budget released in April 2017, and the financial position of the government as at March 31, 2018. As in previous years, the Annual Report also compares the current year’s results to the prior year’s results and provides a five-year trend analysis for a number of key financial ratios.
Producing the Public Accounts of Ontario requires the teamwork and collaboration of many stakeholders across Ontario’s public sector. The Office of the Auditor General plays a critical role in auditing and reporting on the Province’s financial statements, and the Standing Committee on the Public Accounts also plays an important role in providing legislative oversight and guidance. I would like to thank everyone for their contributions.
We welcome your comments on the Public Accounts. Please share your thoughts by email at infoTBS@ontario.ca, or by writing to the Office of the Provincial Controller, Re: Annual Report, Treasury Board Secretariat, Second Floor, Frost Building South, 7 Queen’s Park Crescent, Toronto, Ontario M7A 1Y7.
Original signed by
Nancy Kennedy
Deputy Minister, Treasury Board Secretariat
and Secretary of Treasury Board and
Management Board of Cabinet
Guide to the Public Accounts
The Public Accounts of the Province of Ontario comprise this Annual Report and three supporting volumes.
The Annual Report includes a Financial Statement Discussion and Analysis, the Consolidated Financial Statements of the Province and other supporting schedules and disclosures.
Financial Statement discussion and analysis
The first section of the Annual Report is the Financial Statement Discussion and Analysis section, which:
- Compares the Province’s financial results to both the 2017 Budget and results for the previous year;
- Shows trends in key financial items and indicators of financial condition;
- Sets out key potential risks to financial results and strategies used to manage them;
- Includes descriptions of various assets and liabilities on the statement of financial position; and
- Presents non-financial activities results and discusses important initiatives related to enhancing transparency and accountability.
The Consolidated Financial Statements
The Consolidated Financial Statements show the Province’s financial position at the end of the previous fiscal year, its financial activities during the reporting period and its financial position at the end of the fiscal year. The statements are linked, and figures that appear in one statement may affect another.
The Province’s financial statements are presented on a consolidated basis, meaning that the Province’s statement of financial position and statement of operations reflect the combination of ministry results as well as financial results for entities that are controlled by the government (see Note 1 to the Consolidated Financial Statements for more details). Therefore, reported revenues and expenses of the Province can be affected directly by the activities of ministries as well as the performance of controlled entities such as government business enterprises (GBEs) and broader public sector (BPS) organizations, i.e., hospitals, school boards and colleges. In addition, the Province’s results are also affected by transfer payments made to non-consolidated entities, such as municipalities and universities.
The financial statements comprise:
- The Consolidated Statement of Operations, which provides a summary of the government’s revenue for the period less its expenses, and shows whether the government incurred an operating deficit or surplus for the year. The results for the current year are presented along with the Budget Plan as presented in April 2017, and the financial results for the prior fiscal period. The annual surplus/deficit has an impact on the Province’s financial position.
- The Consolidated Statement of Financial Position, which reports the Province’s assets and liabilities and is also known as the balance sheet. The Province’s total liabilities include debt and other long-term financing. Financial assets include cash, short-term investments, amounts due from others and investment in GBEs. The difference between total liabilities and financial assets is the Province’s net debt, which provides a measure of the future government revenues that will be required to pay for the government’s past transactions. Non-financial assets, mainly tangible capital assets such as highways, bridges and buildings, are subtracted from net debt to arrive at the accumulated deficit. A deficit in the year increases the accumulated deficit.
- The Consolidated Statement of Change in Net Debt, which shows how the Province’s net debt position changed during the year. The main factors impacting net debt are the annual surplus/deficit and additions to tangible capital assets, which increase liabilities.
- The Consolidated Statement of Change in Accumulated Deficit, which is a cumulative total of all the Province’s annual deficits and surpluses to date. It is mainly affected by the annual surplus/deficit in a year.
- The Consolidated Statement of Cash Flow, which shows the sources and uses of cash and cash equivalents over the year. Two major sources of cash are revenues and borrowings. Uses of cash include funding for operating costs, investments in capital assets and debt repayment. The statement is presented in what is referred to as the indirect method, meaning that it starts with the annual surplus or deficit and reconciles that to the cash flow from operations by adding or subtracting non-cash items, such as amortization of tangible capital assets. It also shows cash used to acquire tangible capital assets and investments, as well as cash generated from financing activities.
When reading the Consolidated Financial Statements, it is essential to also read the accompanying notes and schedules, which summarize the Province’s significant accounting policies and give more information on underlying financial activities, market value of investments, contractual obligations and risks.
Other elements of the Annual Report
- In management’s Statement of Responsibility, the government acknowledges its responsibility for the Consolidated Financial Statements and the Financial Statement Discussion and Analysis. The Statement, which appears on page 5, outlines the accounting policies and practices used in preparing the financial statements and acknowledges the government’s responsibility for financial management systems and controls.
- The Auditor General’s Report, which appears on page 49, expresses an opinion under the Auditor General Act as to whether the statements present fairly the annual financial results and financial position of the government in accordance with Canadian Public Sector Accounting Standards.
Supporting volumes
Volume 1 contains ministry statements and detailed schedules of debt and other items. Individual ministry statements compare actual expenses to the amounts appropriated by the Legislative Assembly. Appropriations are made through the Estimates, Supplementary Estimates and annual Supply Act (as modified by Treasury Board Orders), other statutes and special warrants, if any. The ministry statements include amounts appropriated to fund certain provincial organizations, including hospitals, school boards and colleges. The financial results of all provincial organizations included in the government reporting entity in accordance with Public Sector Accounting Standards are consolidated with those of the Province to produce the Consolidated Financial Statements in accordance with the accounting policies as described in Note 1 to the statements.
Volume 2 contains the individual financial statements of significant provincial corporations, boards and commissions that are part of the government’s reporting entity, as well as other miscellaneous financial statements.
Volume 3 contains the details of payments made by ministries to vendors (including sales tax) and transfer payment recipients that exceed certain thresholds, including: payments to suppliers of temporary help services; payments made directly to a supplier by the ministry for employee benefits; travel payments for employees; total payments for grants, subsidies or assistance to persons, businesses, non-commercial institutions and other government bodies; other payments to suppliers of goods and services; and statutory payments.
Statement of responsibility
The Consolidated Financial Statements are prepared by the Government of Ontario in accordance with the accounting principles for governments issued by the Public Sector Accounting Board (PSAB).
The government accepts responsibility for the objectivity and integrity of these Consolidated Financial Statements and the Financial Statement Discussion and Analysis.
The government is also responsible for maintaining systems of financial management and internal control to provide reasonable assurance that transactions recorded in the Consolidated Financial Statements are within statutory authority, assets are properly safeguarded and reliable financial information is available for preparation of these Consolidated Financial Statements.
The Consolidated Financial Statements have been audited by the Auditor General of Ontario in accordance with the Auditor General Act and Canadian Auditing Standards. Her report appears on page 49 of this document.
Original signed by
Greg Orencsak
Deputy Minister
Ministry of Finance
September 12, 2018
Original signed by
Nancy Kennedy
Deputy Minister
Treasury Board Secretariat and Secretary of Treasury Board and Management Board of Cabinet
September 12, 2018
Financial Statement discussion and analysis
Highlights
2017-18 financial highlights ($ Billions) - table 1
| Consolidated Statement of operations for the fiscal year ended March 31 |
2017 Reclassified budget |
2017-18 |
2016-17 |
Change from 2017 reclassified budget |
Change from 2016-17 restated actual |
|---|---|---|---|---|---|
|
Total revenue |
150.0 |
150.6 |
140.7 |
0.6 |
9.9 |
|
Expense |
|||||
|
Programs |
137.2 |
142.4 |
131.4 |
5.2 |
10.9 |
|
Interest on debt |
12.2 |
11.9 |
11.7 |
(0.3) |
0.2 |
|
Total expense |
149.4 |
154.3 |
143.1 |
4.8 |
11.1 |
|
Reserve |
0.6 |
– |
– |
(0.6) |
– |
|
Annual deficit |
– |
(3.7) |
(2.4) |
(3.7) |
(1.2) |
|
Consolidated Statement of financial position |
|||||
|
Financial assets |
93.0 |
81.1 |
11.9 |
||
|
Liabilities |
416.9 |
395.2 |
21.7 |
||
|
Net debt |
(323.8) |
(314.1) |
9.8 |
||
|
Non-financial assets |
114.8 |
108.1 |
6.7 |
||
|
Accumulated deficit |
|
(209.0) |
(205.9) |
|
3.1 |
Note: Numbers may not add due to rounding.
Comparison to the 2017 Budget plan
The Province of Ontario recorded a deficit of $3.7 billion for the 2017-18 fiscal year, a decrease of $3.7 billion from the balanced plan projected in the 2017 Budget (see Table 1). This is mainly due to the 2017 Budget expenses not including valuation allowances for the net pension assets for the Ontario Teachers Pension Plan (OTPP) and the Ontario Public Service Employees Union Pension Plan (OPSEUPP) (an amount of $2.2 billion has been recorded in the actual expenses for the year), expenses related to a 16 per cent reduction in electricity rates for rate payers totalling approximately $1.8 billion and the Budget reserve of $0.6 billion not reflected in the actual results.
Despite the challenges stemming from an uncertain global economic setting, Ontario’s economy grew, with real gross domestic product (GDP) increasing by 2.7 per cent in 2017, above the forecast of 2.3 per cent in the 2017 Budget.
Total revenue for 2017-18 came in at $150.6 billion, which was $0.6 billion higher than the 2017 Budget Plan. This was largely due to higher-than-expected corporations tax revenues, income from GBEs, fees, donations and other revenues from BPS organizations (hospitals, school boards and colleges) and other non-tax revenue, which was partially offset by lower personal income tax revenue and Government of Canada transfers.
Total expense for 2017-18 came in at $154.3 billion, which was $4.8 billion higher than the 2017 Budget. Program spending was $142.4 billion, up $5.2 billion from the plan of $137.2 billion. This increase from plan was due to the 2017 Budget expenses not including valuation allowances for the net pension assets for the OTPP and OPSEUPP (an amount of $2.2 billion has been recorded in the actual expenses for the year) and expenses related to a 16 per cent reduction in electricity rates for rate payers totalling approximately $1.8 billion. Spending in health, postsecondary and training, justice and other programs was higher-than-planned, while education and children and social services was slightly lower-than-planned. Interest on debt expense was $11.9 billion, which was $0.3 billion below the plan of $12.2 billion, mainly as a result of a fiscally neutral reporting change along with marginally lower-than-forecast interest rates and cost effective borrowing and debt management.
Net debt, the difference between total liabilities and financial assets, was $323.8 billion as at March 31, 2018, which was $11.9 billion higher than the 2017 Budget, largely resulting from the change in accounting for the net pension assets of the jointly sponsored pension plans and a change in the accounting for one component of the plan to reduce electricity pricing.
Comparison to the 2016-17 fiscal year
Provincial revenues increased by $9.9 billion, or 7.0 per cent, over the previous year (see Table 1). This increase was due in part to nominal GDP growth of 4.5 per cent in 2017, which contributed to higher taxation revenues. Also contributing to the increase were higher transfers from Government of Canada, fees, donations and other revenues from BPS organizations, income from GBEs and other non-tax revenue.
Year-over-year, total spending rose by $11.1 billion, or 7.8 per cent, going from
$143.1 billion to $154.3 billion. Interest on debt rose by 1.7 per cent, from $11.7 billion to $11.9 billion, reflecting the increase in total debt.
As a result of higher growth in spending than revenue, an annual deficit of $3.7 billion in 2017-18 was reported compared to a restated deficit of $2.4 billion in 2016-17.
Total liabilities increased by $21.7 billion and total financial assets increased by $11.9 billion, which resulted in an increase of $9.8 billion in net debt.
The net book value of capital assets (non-financial assets) such as roads and bridges owned by the Province grew by $6.6 billion during the year, reflecting new capital investments, mainly in the transportation, health and education sectors.
The accumulated deficit increased by $3.1 billion, mainly as a result of the annual deficit for 2017-18 of $3.7 billion.
During the year, cash was generated from issuing long-term debt of $33.4 billion and the sale of Hydro One Limited (Hydro One) shares generating net proceeds of $2.7 billion. Cash generated was used mainly to fund current year expenditures, provide $12.4 billion for investment in capital assets and repay maturing debt of $17.8 billion.
Analysis of 2017-18 results
Details of 2017-18 actual results ($ Billions) - table 2
|
Item |
2017 Reclassified budget |
2017-18 Actual |
2016-17 Restated actual |
Change from 2017 reclassified |
Change from 2016-17 restated |
|---|---|---|---|---|---|
|
Revenue |
|||||
|
Taxation |
100.1 |
99.7 |
94.3 |
(0.4) |
5.4 |
|
Government of Canada |
26.1 |
24.9 |
24.5 |
(1.2) |
0.3 |
|
Fees, donations and other revenues from hospitals, school boards and colleges |
7.9 |
8.3 |
8.0 |
0.3 |
0.4 |
|
Income from government business enterprises |
4.9 |
6.2 |
5.6 |
1.3 |
0.6 |
|
Other non-tax revenue |
11.0 |
11.5 |
8.3 |
0.6 |
3.2 |
|
Total revenue |
150.0 |
150.6 |
140.7 |
0.6 |
9.9 |
|
Expense |
|||||
|
Health sector |
58.0 |
58.9 |
56.0 |
1.0 |
3.0 |
|
Education sector |
27.5 |
27.3 |
26.6 |
(0.2) |
0.7 |
|
Children’s and social services sector |
16.8 |
16.7 |
16.1 |
(0.1) |
0.6 |
|
Postsecondary and training sector |
11.0 |
11.1 |
10.1 |
0.2 |
1.0 |
|
Justice |
4.7 |
4.8 |
4.6 |
0.1 |
0.2 |
|
Other programs |
19.2 |
23.5 |
18.0 |
4.3 |
5.4 |
|
Total program expense |
137.2 |
142.4 |
131.4 |
5.2 |
10.9 |
|
Interest on debt |
12.2 |
11.9 |
11.7 |
(0.3) |
0.2 |
|
Total expense |
149.4 |
154.3 |
143.1 |
4.8 |
11.1 |
|
Reserve |
0.6 |
– |
– |
(0.6) |
– |
|
Annual deficit |
– |
(3.7) |
(2.4) |
(3.7) |
(1.2) |
Note: Numbers may not add due to rounding.
Revenue
Comparison to the 2017 Budget plan
In the 2017 calendar year, Ontario’s real GDP grew by 2.7 per cent, driven by gains in consumer spending and business investment. Growth was above the forecast of 2.3 per cent in the 2017 Budget.
Revenues for 2017-18 were $150.6 billion, 0.4 per cent higher than the 2017 Budget projection. See Chart 1 for a breakdown of revenues by source.
- Taxation revenues were $0.4 billion or 0.4 per cent lower-than-projected in the 2017 Budget mainly due to lower Personal Income Tax (PIT) and Ontario Health Premium (OHP) revenues partly offset by higher Corporations Income Tax (CIT) revenues. PIT revenues were $2.1 billion lower and OHP were $0.1 billion lower due to lower amounts from 2016 tax returns processed that lowered the base upon which growth is calculated. CIT revenues were $1.8 billion higher mainly due to strong tax assessments in respect of 2017 and prior tax years, and stronger growth in corporate profits.
- Transfers from the Government of Canada were lower than the 2017 Budget forecast by $1.2 billion, mainly reflecting lower-than-expected funding for infrastructure projects and other federal payments. This decline is partially offset by new funding for early learning and child care.
- Fees, donations and other revenues from BPS organizations were $0.3 billion higher than the 2017 Budget, mainly due to higher-than-expected non-provincial sources for school boards, and higher international tuition fees and other revenues for colleges.
- Income from GBEs was $1.3 billion higher, reflecting higher-than-projected net income from the Ontario Lottery and Gaming Corporation (OLG), the Liquor Control Board of Ontario (LCBO) and Ontario Power Generation Inc. (OPG). OPG's net income was higher mainly due to gains from one-time real estate transactions (projected gains had been included in sales and rentals revenue in the 2017 Budget), lower expenses, and the financial performance of OPG's nuclear funds.
- Other non-tax revenues were $0.6 billion higher, mainly reflecting higher-than-projected revenue from carbon allowance proceeds, recoveries of prior-year-expenditure and revenues from miscellaneous sources. This increase was partially offset by lower sales and rentals revenue and lower power supply contract recoveries. The latter is fiscally-neutral, as it offsets the lower-than-projected power supply contract costs.
Comparison to prior year and earlier years
Total revenues for 2017-18 increased $9.9 billion, or 7.0 per cent, from the previous year.
- Taxation revenues grew by $5.4 billion, or 5.7 per cent, mostly reflecting growth in PIT, CIT and Harmonized Sales Tax (HST) revenues. PIT revenue grew by $2.2 billion, or 7.3 per cent due to strong growth in 2017 tax assessments or 10.2 per cent, mostly reflecting employment and compensation of employees’ growth in 2017. CIT revenue grew by $0.7 billion due to strong corporation profit growth of 8.7 per cent in 2017-18. HST revenue grew by $1.2 billion supported by nominal personal consumption growth of 5.1 per cent.
- Revenues from the Government of Canada were higher in 2017-18 by $0.3 billion, reflecting higher transfers for major federal funding programs including the Canada Health Transfer, the Canada Social Transfer and new funding for home and community care and mental health and addictions services, as well as early learning and child care. This increase was partially offset by lower transfers for Equalization payments.
- Fees, donations and other revenues from BPS organizations were $0.4 billion higher over the prior year, mainly due to higher net international tuition and contractual revenues of colleges, higher school generated revenues and presentation differences for Government of Canada transfers to School Boards offset by lower education development charges.
- Income from GBEs was higher in 2017-18 by $0.6 billion, due to higher net income from OLG and OPG. OPG's net income increase was largely due to gains from one-time real estate transactions during 2017-18 and lower expenses, partially offset by adjustments to OPG's net income for provincial reporting under International Financial Reporting Standards (IFRS).
- Other non-tax revenue was higher by $3.2 billion in 2017-18, mainly reflecting new revenues from the carbon allowance proceeds resulting from the cap-and-trade program implemented in 2017-18, higher recoveries of prior-year-expenditure, sales and rentals, and revenues from vehicle and driver registration fees. This increase is partially offset by lower revenue related to the electricity sector including lower power supply contract recoveries. Power supply contract recoveries are fiscally-neutral, as they offset power supply contract costs.
Electricity sector revenues
Hydro One secondary offering
In May 2017, the Province completed a secondary offering of Hydro One common shares, selling 120 million common shares (approximately 20.2 per cent of outstanding Hydro One common shares) at $23.25 per share, generating gross proceeds of $2.8 billion. The Province reported a gain of $0.8 billion from the offering.
Sale of Hydro One shares to First Nations
In December 2017, the Province completed a sale of 14,391,012 Hydro One common shares (approximately 2.4 per cent of outstanding Hydro One common shares) at $18 per share to OFN Power Holdings LP, a limited partnership wholly-owned by Ontario First Nations Sovereign Wealth LP, which is in turn owned by 129 First Nations in Ontario. The Province reported a deferred gain of $23 million from the sale. This gain will be recognized as revenue as the loan provided to OFN Power Holdings LP to purchase the shares is repaid.
Upon completion of the transaction, the Province’s holdings of Hydro One common shares totalled 282,412,648 common shares (approximately 47.4 per cent of outstanding Hydro One common shares).
Revenue trend
Chart 2 shows the recent trends in revenue for the Province’s major revenue sources.
Taxation revenue
Between 2013–14 and 2017-18, taxation revenue grew at an annual average rate of 5.7 per cent, higher than the average annual nominal GDP growth of 4.5 per cent over the same period.
Although economic growth and increases in taxation revenue are closely linked, the relationship is affected by several factors. Growth in some revenue sources, such as corporations tax and mining tax, can diverge significantly from economic growth in any given year due to the inherent volatility of business profits as well as the use of tax provisions such as the option to carry losses forward or backward. The impact of housing completions and resales on HST and land transfer tax revenue is proportionately greater than their contribution to GDP. As well, changes in such sources as volume-based gasoline and fuel taxes are more closely aligned to growth in real as opposed to nominal GDP as these revenue sources are less influenced by price changes.
Much of the rising trend in taxation revenues between 2013–14 and 2017-18 reflects a growing economy and revenue generated from tax measures.
Federal government transfers
Government of Canada transfers are based on existing federal–provincial funding arrangements and formulas. These include major federal transfers such as the Canada Health Transfer, Canada Social Transfer and Equalization, as well as transfers for social housing, infrastructure and labour market programs. There are also a number of smaller federal transfers to the Province which are largely program-specific. Some transfers are ongoing while others are time-limited.
Between 2013–14 and 2017-18, Government of Canada transfers grew at an annual average rate of 2.4 per cent.
Fees, donations and other revenues from BPS organizations
Between 2013–14 and 2017-18, fees, donations and other revenues from BPS organizations grew at an annual average rate of 5.3 per cent. The growth is mainly due to an upward trend of international tuition fees and other revenues.
Income from government business enterprises
Revenue of the Province includes the net income of the following GBEs: Hydro One
Between 2013–14 and 2017-18, income from GBEs grew at an annual average rate of 3.6 per cent.
Other non-tax revenues
Other non-tax revenues arise from a number of sources, including vehicle and driver registration fees, sales and rentals of goods and services, other fees, licences and permits, reimbursements of provincial expenditures in delivering certain services, royalties for the use of Crown resources, and electricity sector revenues such as the debt retirement charge and power supply contract recoveries.
Other non-tax revenues grew at an annual average rate of 8.5 per cent between 2013–14 and 2017-18.
Expense
Comparison to the 2017 Budget plan
Total expense in 2017-18 was $154.3 billion, which was $4.8 billion higher than the 2017 Budget. Program spending was $142.4 billion, up $5.2 billion from the plan of $137.2 billion. Spending in health, postsecondary and training programs, justice and other programs was higher-than-planned offset by lower spending in education and children’s and social services programs (see Table 2). Interest on debt expense was $11.9 billion, which was $0.3 billion below the plan of $12.2 billion.
See Chart 3 for details of program expense by sector.
Total program spending was $5.2 billion higher than the Budget, resulting in actual program expense of $142.4 billion. The increase was attributable to:
- Health sector expense that was $989 million above plan is due to additional investments in the hospital and home care sectors — increased spending to meet the demands in Long-Term Care Homes, Ontario Health Insurance Plan, Cancer Care Ontario, Assistive Devices and Supplies Program and Canadian Blood Services.
- Postsecondary and training sector expense was $189 million higher, primarily due to additional funding for the Ontario Student Assistance Program (OSAP) to support a higher-than-forecast number of applications and awards.
- Justice sector expense that was $113 million higher-than-planned, mainly due to settlements under the Proceedings Against the Crown Act, higher-than-expected bad debt provisions related to unpaid fines, increased Workplace Safety Insurance Board premiums including post-traumatic stress disorder costs for first responders, and statutory payments for Ontario Provincial Police undercover operations.
- Other programs expense was $4,268 million higher-than-planned, mainly due to the 2017 Budget expenses not including valuation allowances for the net pension assets for the OTPP and OPSEUPP (an amount of $2.2 billion has been recorded in the actual expenses for the year), expenses related to a 16 per cent reduction in electricity rates for rate payers totalling approximately $1.8 billion, and the recognition of contingent liabilities for land claims and land related settlements such as flooding. The increase was partially offset by reduced transportation transfer payments resulting from revised timelines for municipal transit projects under the Public Transit Infrastructure Fund.
Increase in these sectors and programs were partially offset by:
- Education sector expense was $238 million lower, mainly due to lower-than-forecast school board spending.
- Children’s and social services sector expense that was $131 million lower-than-planned, mainly due to reduced drug costs in the Ontario Drug Benefit program and increased savings in the Ontario Drug Benefit Manufacturers’ Rebate, lower-than-anticipated intake of young adults in Residential Services program, and lower-than-forecasted caseload and cost per case in the Ontario Works Financial Assistance program.
Chart 4 shows spending by type of expense. Government spending related to salaries and benefits includes those expenses for organizations consolidated as part of the government reporting entity including hospitals, school boards and colleges as well as the Ontario Public Service. The expense labelled “Transfers” in Chart 4 includes payments to doctors for physician services but does not include transfers to hospitals, school boards and colleges; these are reflected in the other expense types as reported by the organizations.
Transfers reflect payments to a variety of service providers, including non-consolidated entities in the public sector, to support the delivery of public services. These outside parties include, for example, child care providers, social service agencies and health care professionals. As service providers, a large share of the spending of these third parties typically goes to salaries and benefits.
Comparison to prior year and earlier years
Year-over-year, program spending grew by $10.9 billion or 8.3 per cent in 2017-18.
Higher expense in the health sector reflects increased utilization of health services provided under the Ontario Health Insurance Plan, increased expenditures in the Ontario Public Drug programs, as well as the Assistive Devices and Supplies program and additional funding for the long-term care homes and hospital sector.
Chart 5 shows the recent trends in spending for major program areas.
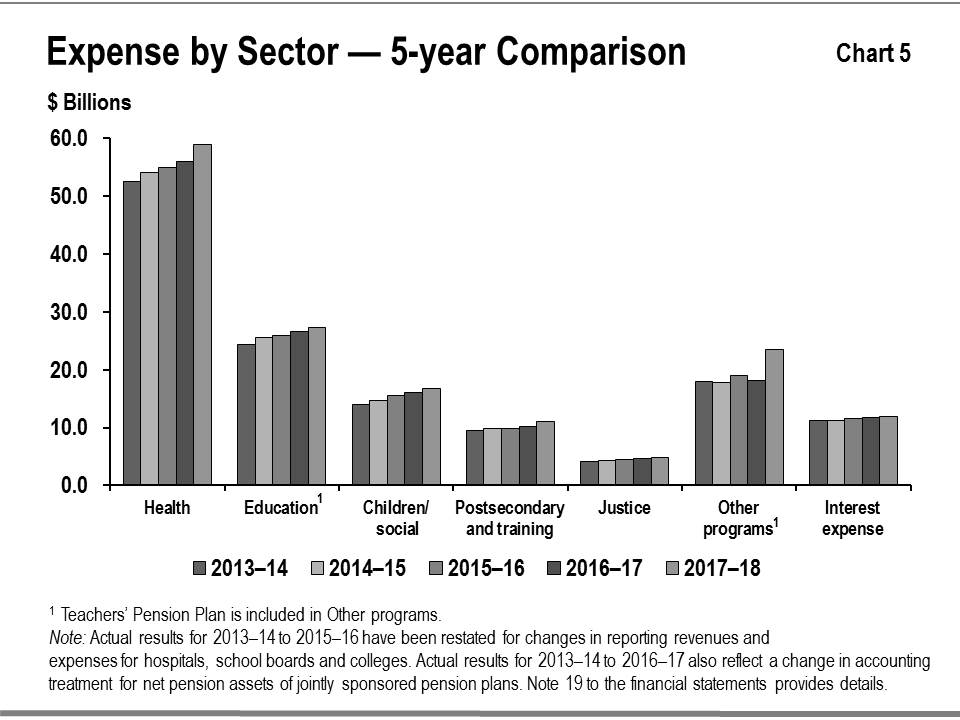
- Health sector expense increased from $52.6 billion in 2013–14 to $58.9 billion in 2017-18, or on average by 2.9 per cent per year. These increases are a result of increased utilization in the Ontario Health Insurance Plan, home care services, hospital services, addressing mental health and addictions, long-term care home sector; as well as specialized services such as cancer treatment and responding to the opioid crisis.
- Education sector expense increased from $24.4 billion in 2013–14 to $27.3 billion in 2017-18, or on average by 2.8 per cent per year. The increase is mainly due to negotiated labour agreements with teachers and education workers, funding for school renewal and expansion projects and the implementation of full-day kindergarten which was made available to all four and five-year olds in September 2014. From 2013–14 to 2017-18, enrollment in full-day kindergarten increased from 184,000 to 262,000 students. The expense increase over this period is also due to child care expansion — between 2013–14 and 2017-18 the number of licensed child care spaces increased from about 318,000 spaces to over 427,000 spaces.
- Children’s and social services sector expense increased from $14.0 billion in 2013–14 to $16.7 billion in 2017-18, or on average by 4.5 per cent per year. The increase primarily reflects social assistance rate increases and investments in developmental services, the Ontario Autism Program and Ontario Child Benefit.
- Postsecondary and training sectorexpense increased from $9.6 billion in 2013–14 to $11.1 billion in 2017-18, or on average by 3.8 per cent per year. The increase is mainly due to growth in student financial assistance programs and continued funding to support postsecondary institutions, including funding to support capital projects. More students from underrepresented groups are accessing OSAP assistance including:
- 252,000 low-income students, a 19 per cent increase since 2016-17;
- 7,800 Indigenous students, a 34 per cent increase since 2016-17;
- 188,000 mature students, a 31 per cent increase since 2016-17; and
- 14,000 sole support parents, a 17 per cent increase since 2016-17.
- Justice sector expense increased from $4.2 billion in 2013–14 to $4.8 billion in 2017-18, or on average by 3.8 per cent per year. The increase is mainly due to transformation in the corrections system, continuing provincial upload of court security costs from municipalities, compensation in the Ontario Provincial Police and correctional services programs, and improved access to legal aid for low-income Ontarians. These investments have helped to improve conditions of confinement in correctional facilities, support the rehabilitation of inmates and their reintegration back into communities, and expand access to legal aid services for about 700,000 low-income Ontarians.
- Other programs expense increased from $18.0 billion in 2013–14 to $23.5 billion in 2017-18. This increase is mainly due to higher pension expense as a result of increased valuation allowance against investment gains on growing net pension assets and investments in transit and highways, including time-limited federal infrastructure funding for municipal transit projects. The increase in 2017-18 was also partially due to the plan implemented to reduce electricity prices, resulting in $3.0 billion in expenses recognized in 2017-18.
Interest on debt
Interest on debt expense was $343 million below plan in 2017-18, mainly as a result of a fiscally neutral reporting change along with marginally lower-than-forecast interest rates and cost effective borrowing and debt management.
Interest expense grew from $11.7 billion in 2016-17 to $11.9 billion in 2017-18 (see Table 2).
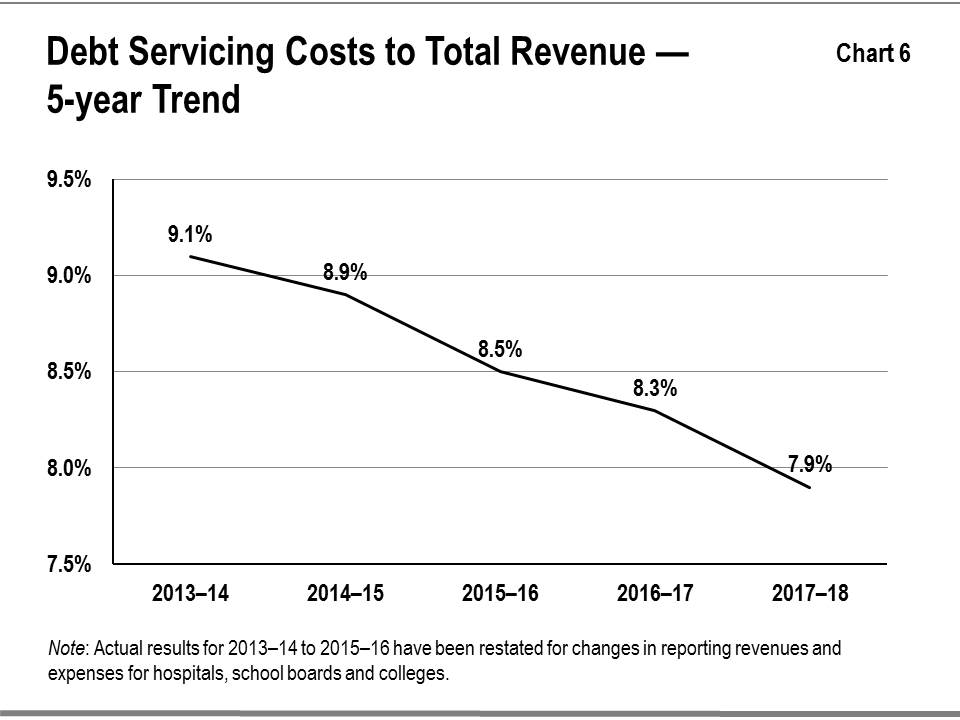
Chart 6 shows that although interest costs have grown in absolute terms, they have steadily fallen as a percentage of the Province’s revenues since 2013–14. This is mainly due to historically low interest rates coupled with cost-effective debt management.
Statement of financial position analysis
Financial assets
Financial assets($ Billions) - table 3
|
Item |
2017-18 |
% of Total |
2016-17 Restated actual |
% of Total |
Variance |
|---|---|---|---|---|---|
|
Cash and cash equivalents |
15.1 |
16.2% |
16.4 |
20.2% |
(1.3) |
|
Investments |
28.8 |
30.9% |
18.0 |
22.2% |
10.8 |
|
Accounts receivable |
13.5 |
14.5% |
11.2 |
13.8% |
2.3 |
|
Loans receivable |
12.4 |
13.3% |
11.9 |
14.6% |
0.5 |
|
Other assets |
1.2 |
1.3% |
1.4 |
1.7% |
(0.2) |
|
Investment in government business enterprises |
22.1 |
23.7% |
22.3 |
27.5% |
(0.2) |
|
Total financial assets |
93.0 |
100.0% |
81.1 |
100.0% |
11.9 |
Note: Numbers may not add due to rounding.
Financial assets consist of items such as: cash and cash equivalents and investments that are available to the Province to meet its expenditure needs; accounts and loans receivable, which are amounts it expects to receive from third parties; and other items including investment in GBEs.
The Province’s financial assets increased by $11.9 billion in 2017-18 over the prior year. These increases were attributable to (see Table 3):
- Investments that were $10.8 billion higher mainly due to the Province building up liquid reserves to address debt maturities in both 2018–19 and 2019–20;
- Accounts receivable that was $2.3 billion higher, mainly due to increase in tax receivables and Government of Canada receivables at year-end; and
- Loans receivable that was $0.5 billion higher, mainly due to higher lending to universities for infrastructure projects and a loan issued to OFN Power Holdings LP to purchase common shares of Hydro One.
These increases were offset by:
- Cash and cash equivalents were $1.3 billion lower as a result of operating, investing, capital and financing activities.
Chart 7 shows the recent trends in financial assets for the Province.
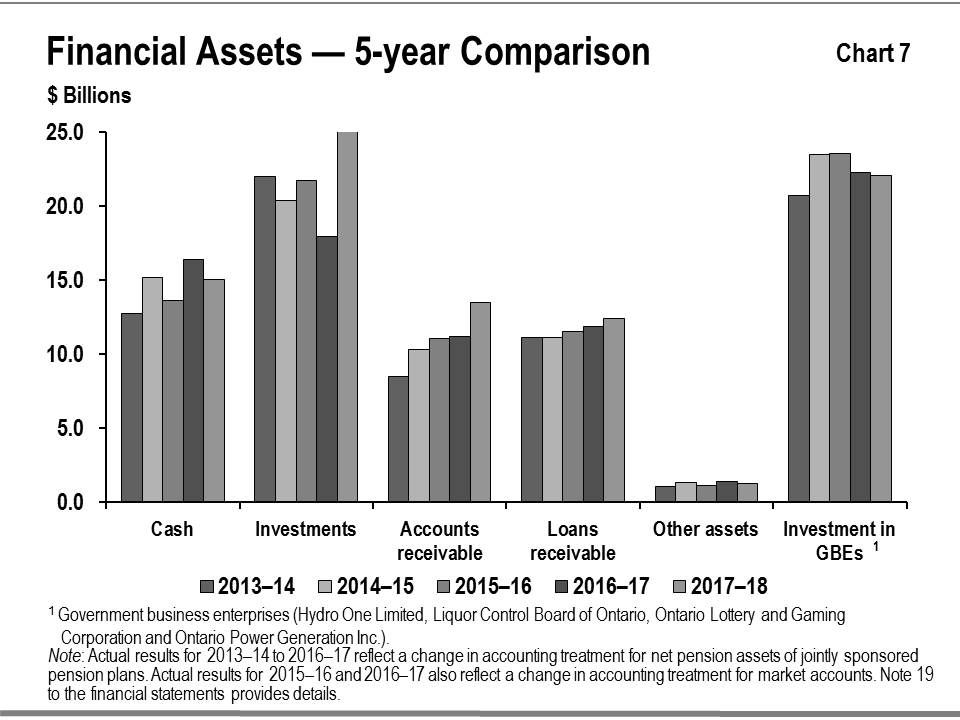
The five-year trend shows a steady gain in investment in GBEs from 2013–14 to 2014–15, reflecting an increase in net assets reported for these entities. The same upward trend did not continue in 2015–16, the decrease in the past few years is mainly due to the Province’s decreased ownership interest in Hydro One and the sale of Hydro One Brampton Networks Inc. in February 2017.
The level of other financial assets including cash, accounts receivable and investments, tends to be more variable since these assets often reflect specific circumstances at year-end such as pre-borrowing for the following period’s needs.
Tangible capital assets
The government is responsible for a large portfolio of non-financial assets which is almost entirely made up of tangible capital assets.
Tangible capital assets owned by the Province and its consolidated entities represent the largest component of the Province’s infrastructure investments. These assets include those it owns directly, such as provincial highways, as well as the assets of hospitals, school boards, colleges and agencies that are consolidated in its financial statements. The assets of GBEs are reflected in the Province’s statement of financial position as an investment in GBEs under financial assets.
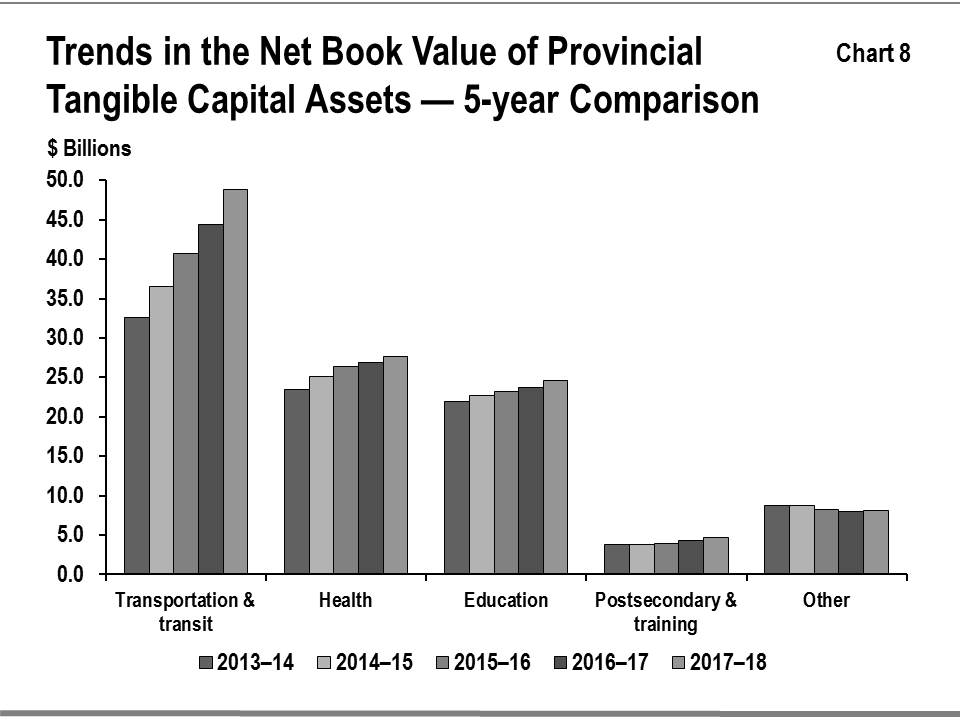
The reported net book value of Ontario’s tangible capital assets was $113.9 billion in 2017-18, increasing by $6.6 billion over the prior year. Buildings, including hospitals, schools and college facilities, make up the single largest share at $56.4 billion. The total also includes assets under construction, some of which are being built using the Alternative Financing and Procurement (AFP) model, in which the private sector finances the assets during construction. The balance sheet includes assets under construction. The impacts of AFPs on balance sheet liabilities are discussed in “Other long-term financing” on page 29.
Growth in the net book value of capital assets has averaged 5.9 per cent annually over the period between 2013–14 and 2017-18. Most of the growth has been in new and renewed buildings and in transportation infrastructure including provincial highways, bridges and the transit network owned by Metrolinx, an agency of the Province.
See Chart 8 for the recent trends in the net book value of provincial tangible capital assets by sector.
Infrastructure expenditures
The Province’s infrastructure spending in 2017-18 was $15.4 billion (see Table 4). This included $12.2 billion invested in assets owned by the Province and its consolidated entities as discussed in “Tangible capital assets” on page 25, $3.2 billion provided for capital investment to non-consolidated partners such as universities and municipalities, and other infrastructure expenditures. The total was lower than the $20.3 billion set out in the 2017 Budget largely because of lower-than-forecast construction activity for the period.
Infrastructure expenditures, 2017-18 ($ Billions) - table 4
|
Sector |
Investment in |
Transfers and other infrastructure expenditures |
Total infrastructure expenditures |
|
|---|---|---|---|---|
|
Transportation and transit |
6.3 |
1.1 |
7.4 |
|
|
Health |
2.4 |
0.2 |
2.6 |
|
|
Education |
2.1 |
0.0 |
2.2 |
|
|
Postsecondary and training |
0.7 |
0.5 |
1.2 |
|
|
Other sectors |
0.5 |
1.4 |
1.9 |
|
|
Totals |
12.2 |
3.2 |
15.4 |
|
Note: Numbers may not add due to rounding.
Liabilities
The Province’s liabilities consist of debt and other financial obligations including accounts payable, unspent funds it received from the federal government and the estimated cost of future payments, including pensions and other employee future benefits liability (see Table 5).
Liabilities ($ Billions) - table 5
|
Item |
2017-18 |
% of Total |
2016-17 |
% of Total |
Variance |
|---|---|---|---|---|---|
|
Accounts payable and accrued liabilities |
23.4 |
5.6% |
20.0 |
5.1% |
3.4 |
|
Debt |
348.7 |
83.6% |
333.1 |
84.3% |
15.6 |
|
Other long-term financing |
14.1 |
3.4% |
13.9 |
3.5% |
0.2 |
|
Deferred revenue and capital contributions |
12.5 |
3.0% |
11.5 |
2.9% |
1.0 |
|
Pensions and other employee future benefits liability |
11.5 |
2.8% |
11.9 |
3.0% |
(0.4) |
|
Other liabilities |
6.7 |
1.6% |
4.8 |
1.2% |
2.0 |
|
Total liabilities |
416.9 |
100.0% |
395.2 |
100.0% |
21.7 |
Note: Numbers may not add due to rounding.
Debt
Debt and other long-term financing make up the largest share of liabilities. Debt increased by $15.6 billion in 2017-18 to $348.7 billion at year-end, primarily to finance the operating deficit and investments in infrastructure.
Table 6 summarizes how the Province used its net new financing in 2017-18.
Use of new financing by the Province, 2017-18 ($ Billions) - table 6
|
Item |
Amount |
|---|---|
|
Operating deficit and other transactions |
(3.8) |
|
Investment in capital assets owned by the Province and its consolidated organizations, |
12.1 |
|
Decrease in the Province’s cash and investments |
7.4 |
|
Sub-total |
15.7 |
|
Increase in other long-term financing |
(0.2) |
|
Net new financing |
15.6 |
Note: Numbers may not add due to rounding.
The government completed an annual borrowing program of $33.9 billion in 2017-18.
Other long-term financing
This category includes debt incurred to finance construction of public assets including those procured through the AFP model. All assets that are owned by the Province and its consolidated entities, and the associated financing liabilities, are reflected on the Province’s balance sheet during construction and as the liabilities are incurred. For information on asset investments, refer to “Tangible capital assets” on page 25.
Other types of liabilities
Other types of liabilities include accounts payable, pensions and other employee future benefits, unspent transfers received from the federal government representing deferred revenues, and other liabilities.
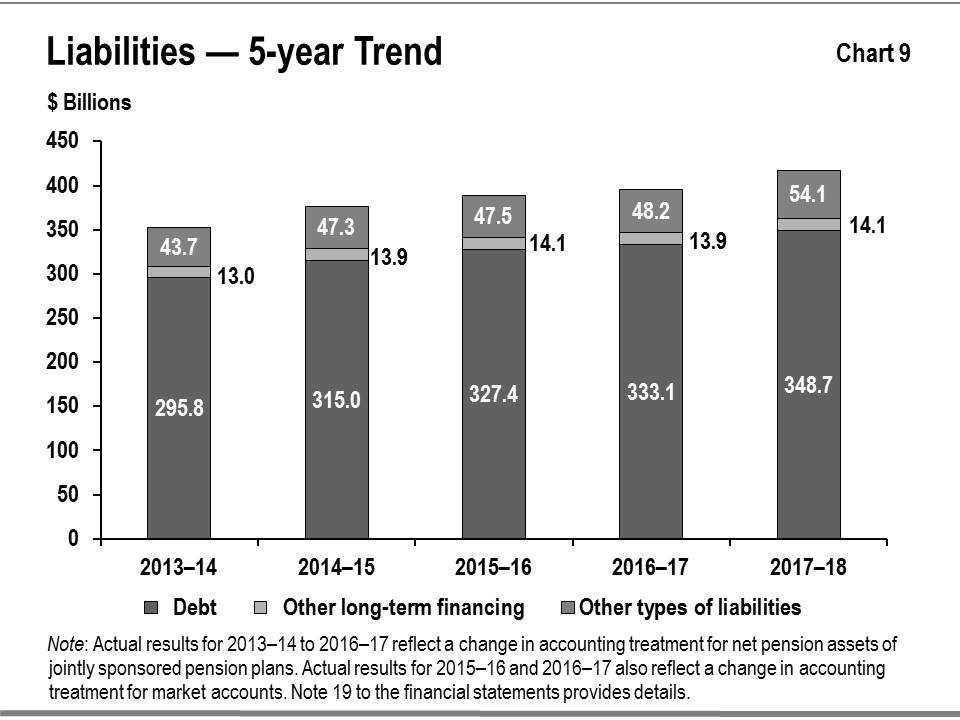
Chart 9 shows the recent trends in liabilities for the Province. This trend over the period between 2013–14 and 2017-18 shows public debt rising, mainly to fund capital investments and the annual deficit. There is an upward trend in other long-term financing with the exception of 2016-17, due to a substantial completion payment that year for the Highway 407 Phase 1 project. Other types of liabilities, including accounts payable and deferred revenue, tend to be more variable since they often reflect specific circumstances at year-end such as accrued liabilities for goods and services.
Risks and risk management
The Province’s financial results and financial reporting are subject to risks and uncertainties over which the government has limited or no control. These include:
- Actual economic and/or revenue growth that differs from forecast;
- Significant changes in financial statement items, especially taxation revenues, arising from actual results that differ from accounting estimates;
- Unforeseen changes in transfer payments from the federal government;
- Demand for entitlement-based public services or a change in other expense, including pension expense, that reflects actual experience that is significantly different than forecast;
- Unusual weather patterns, extreme weather events and natural disasters with major financial impacts;
- Security breaches or other malicious behaviour that could interrupt services, result in loss of information, compromise privacy and/or damage equipment or facilities;
- The outcomes of legal settlements, arbitration and negotiations, and possible defaults on projects and potential defaults affecting loan and funding guarantees;
- Financial market conditions, including access to capital markets, currency exchange rates and interest rates, that differ from expectations; and
- Changes in accounting standards.
Ontario’s revenues rely heavily on the level and pace of economic activity in the province. Ontario manages risks to the revenue forecast by consulting with private sector economists and tracking their economic forecasts to inform the government’s planning assumptions. For prudent fiscal planning, the Ministry of Finance’s real GDP growth projections are slightly below the average private sector forecast.
The Province monitors information flows about revenues on an ongoing basis to assess potential risks to its finances. It also works constantly to enhance information flows for the same purpose. Collaboration with the Canada Revenue Agency, which administers roughly 75 per cent of Ontario’s taxation revenues, is essential to achieving this. As well, Ontario is currently leading a federal, provincial and territorial working group that is exploring ways to enhance corporate income tax revenue forecasting and monitoring.
The possible impacts on tax revenue of actual growth in the economy and other parameters differing from the assumptions used in the Budget is disclosed on pages 233–234 of the 2017 Budget.
There are also risks arising from other sources of revenue, such as federal transfers and income from GBEs. Because these represent a smaller share of total revenue, the risks they present are generally less material to the revenue forecast and, in any event, are difficult or impossible to predict or quantify. Note 1 to the Consolidated Financial Statements provides additional details on measurement uncertainty.
On the expense side, the fiscal plan includes contingency funds to help mitigate risks. In the 2017 Budget these totalled $615 million: $515 million for operating and $100 million for capital. Funds were used to support initiatives such as:
- Recognition of liabilities for land claims that are likely to settle and can be reasonably estimated;
- Support for children entering the Ontario Autism Program;
- Supporting emergency forest firefighting activities;
- Providing OSAP aid to eligible college students whose study period was extended past the normal end date due to the strike; and
- Supporting municipalities and Ontarians impacted by spring 2017 flooding events through the Disaster Recovery Assistance for Ontarians and the Municipal Disaster Recovery Assistance programs.
Provisions for losses that are likely to occur as a result of contingent liabilities such as ongoing litigation and land claims, and that can be reasonably estimated are expensed and reported as liabilities. Note 1 to the Consolidated Financial Statements provides further details.
Note 3 to the Consolidated Financial Statements explains the Province’s risk management strategies which are intended to ensure that exposure to borrowing-related risk is managed in a prudent and cost-effective manner.
Changes in Canadian generally accepted accounting principles (GAAP) for the public sector issued by the Public Sector Accounting Board, can have an impact on the Province’s budgets, estimates and actual results. Treasury Board Secretariat actively monitors proposed changes and provides input to standard setters to support the development of standards that support sound public policy decision-making, transparency and accountability in reporting.
As required under the Fiscal Transparency and Accountability Act, 2004, a reserve is included in the projected surplus/deficit each year to guard against unforeseen revenue and expense changes that could have a negative impact on the Province’s fiscal performance. The 2017 Budget Plan included a $0.6 billion reserve for 2017-18. Excluding this reserve, the 2017 Budget projected a surplus of $0.6 billion. Because the reserve is a forecast provision and the fiscal results for 2017-18 are now finalized, a reserve is not reflected in the Province’s financial statements. The final deficit for the 2017-18 fiscal year is $3.7 billion, $3.7 billion below the 2017 Budget projection of a balanced plan, which included the reserve.
Accounting discussion
A. Change in accounting for pension assets of jointly sponsored pension plans
The 2017-18 Consolidated Financial Statements reflect a change in accounting for net pension assets of the Province’s jointly sponsored pension plans, as compared to the 2016-17 Consolidated Financial Statements. The change affects the Province’s accounting for both the Ontario Teachers’ Pension Plan (OTPP) and the Ontario Public Service Employees Union Pension Plan (OPSEUPP).
As described in Public Sector Accounting Standards, a net pension asset arises when the government’s total contributions to a plan, including income earned thereon, are greater than the cumulative retirement benefit expense recognized since the start of the plan. Contributions reflect the funding objectives of the plan. The benefit expense reflects the estimated cost of the pensions earned during the year that will be paid out to retirees in the future. Canadian Public Sector Accounting Standards (PSAS) requires the write-down of a net pension asset through recording a valuation allowance when the government is not expected to benefit from the net pension asset.
In July 2018, the government announced the creation of an Independent Financial Commission of Inquiry (Commission) under the Public Inquiries Act, 2009. The mandate of the Commission included a requirement to “perform a retrospective assessment of government accounting practices, including pensions, electricity refinancing and any other matters deemed relevant to inform the finalization of the 2017-18 consolidated financial statements of the Province” (OIC 1005/2018). The Commission reported to the Minister of Finance and the Attorney General on August 30, 2018.
In September 2018, the government accepted the Commission recommendations.
Accordingly, these financial statements reflect the recognition of a full valuation allowance for both of the jointly sponsored plans, thereby eliminating the net pension assets. The 2016-17 balances have been restated on a basis consistent with the 2017-18 financial statements. A summary of the impact of the 2016-17 restatement is shown in Table 7.
Summary of restatement of 2016-17 results ($ Millions) - table 7
|
Item |
2016-17 Reported |
Restatement |
2016-17 Restated |
|
|---|---|---|---|---|
|
Pension and other employee future benefits liability |
10,478 |
1,396 |
11,874 |
|
|
Net pension asset |
11,033 |
(11,033) |
- |
|
|
Net debt |
(301,648) |
(12,429) |
(314,077) |
|
|
Accumulated deficit |
(193,510) |
(12,429) |
(205,939) |
|
|
Education expense |
26,204 |
1,364 |
27,568 |
|
|
General Government and other expense |
4,323 |
80 |
4,403 |
|
|
Annual deficit |
(991) |
(1,444) |
(2,435) |
|
B. Market accounts
For 2016 and 2017, the Independent Electricity System Operator (IESO) recorded the amounts due to the power generators and amounts due from the local distribution companies, among others, in its financial statements, which were collectively referred to as the Market Accounts. In 2017-18, the Province removed these financial assets and obligations from the consolidated financial statements of the Province. This impact on this change to the 2016-17 balances is shown in Table 8. This change has no impact on the net deficit, net debt or accumulated deficit.
Summary of restatement of 2016-17 results ($ Millions) - table 8
|
Item |
2016-17 Reported |
Restatement |
2016-17 Restated |
|---|---|---|---|
|
Other liabilities |
6,404 |
(1,652) |
4,752 |
|
Other assets |
3,036 |
(1,652) |
1,384 |
C. Presentation of hospitals, school boards and colleges
For comparability and consistency purposes, the 2017 Budget has been reclassified for changes in reporting revenues and expenses for hospitals, school boards and colleges. This change increases the total revenues and expenses of the Province, but has no impact on the annual deficit. The change was made starting with the 2016-17 Public Accounts to fully comply with Public Sector Accounting Standards.
A summary of the reclassifications to the approved 2017-18 Budget for comparative purposes is provided in Table 9.
Details of reclassified 2017-18 Budget ($ Billions) - table 9
|
Item |
Original 2017-18 budget |
Reclassified items |
Reclassified 2017-18 budget |
|---|---|---|---|
|
Revenue |
|||
|
Taxation |
100.1 |
– |
100.1 |
|
Government of Canada |
25.7 |
0.4 |
26.1 |
|
Fees, donations and other revenues from hospitals, school coards and colleges |
– |
7.9 |
7.9 |
|
Income from investment in Government Business Enterprises |
4.9 |
– |
4.9 |
|
Other |
11.0 |
– |
11.0 |
|
Total revenue |
141.7 |
8.3 |
150.0 |
|
Expense |
|||
|
Health sector |
53.8 |
4.2 |
58.0 |
|
Education sector |
26.5 |
1.0 |
27.5 |
|
Children’s and social services sector |
16.9 |
– |
16.8 |
|
Postsecondary and training sector |
8.4 |
2.5 |
11.0 |
|
Justice |
4.7 |
– |
4.7 |
|
Other programs |
19.2 |
– |
19.2 |
|
Total program expense |
129.5 |
7.7 |
137.2 |
|
Interest on debt |
11.6 |
0.6 |
12.2 |
|
Total expense |
141.1 |
8.3 |
149.4 |
|
Reserve |
0.6 |
– |
0.6 |
|
Annual surplus/(deficit) |
– |
– |
– |
Note: Numbers may not add due to rounding.
Subsequent events
Subsequent to March 31, 2018, the government cancelled programs which will result in estimated savings in future years including approximately $400 million in 2018–19 as compared to the 2018 Budget published in March 2018. The cancelled programs include the following:
Social assistance and Basic Income Pilot wind-down
On July 31, 2018, the Province announced that they will withdraw all funding decisions related to Social Assistance investments announced in the spring 2018 Budget, and scheduled 2018–19 regulations that were to take effect September 1, 2018 under the Ontario Works Act, 1997, andthe Ontario Disability Support Program Act, 1997. As part of this reform, the Province will be winding down Ontario’s Basic Income three-year research project.
OHIP+
On June 30, 2018, the Province announced OHIP+ reform, which will no longer provide free prescriptions to those with private health coverage, at a date to be determined. The financial impact of this cancellation compared to the 2018 Budget published in March 2018 is still being assessed.
In addition, the government cancelled programs which will result in additional estimated net costs of $1.1 billion for 2018–19, compared to the 2018 Budget released in March 2018. The cancelled programs include the following:
Cap and Trade System wind-down
On July 3, 2018, Ontario Reg. 386/18 came into effect, ending the Cap and Trade Program established under the Climate Change Mitigation and Low-carbon Economy Act, 2016, resulting in the cancellation of the remaining auctions in fiscal 2018–19.
Renewable energy contracts
In July 2018, pursuant to a Directive from the Minister of Energy, Northern Development and Mines, the Independent Electricity System Operator (IESO) commenced the wind down of 758 renewable energy contracts. In addition, in July 2018, the White Pines Wind Project Termination Act, 2018, received Royal Assent, terminating the contract for the White Pines Wind Project.
Key financial ratios
The use of key measures of financial position helps readers of the Annual Report assess the financial position of the Province. Through the levels and trends of these measures, readers are able to gauge the impacts of economic and other events on the Province’s finances. The ratio and the level of each, over the past five years are outlined in Table 10.
Key financial ratios - table 10
as at the end of the fiscal period
|
Item |
2013–14 |
2014–15 |
2015–16 |
2016–17 |
2017–18 |
||
|---|---|---|---|---|---|---|---|
|
Sustainability |
Net debt-to-GDP (%) |
39.7% |
40.6% |
40.2% |
39.5% |
39.0% |
|
|
Sustainability |
Net debt to total revenue (%) |
224.6% |
233.5% |
225.0% |
223.2% |
215.0% |
|
|
Sustainability |
Net debt per capita ($) |
$ 20,246 |
$ 21,425 |
$ 22,017 |
$ 22,237 |
$ 22,529 |
|
|
Flexibility |
Debt charges to total revenue (%) |
9.1% |
8.9% |
8.5% |
8.3% |
7.9% |
|
|
Flexibility |
Own-source revenue to GDP (%) |
14.4% |
14.4% |
14.8% |
14.6% |
15.1% |
|
|
Vulnerability |
Federal transfers to total revenue (%) |
18.4% |
17.4% |
17.0% |
17.4% |
16.5% |
|
|
Vulnerability |
Foreign currency debt to total debt (%) |
22.9% |
20.9% |
18.8% |
16.7% |
17.3% |
|
|
Vulnerability |
Unhedged foreign currency debt (%) |
0.5% |
0.3% |
0.3% |
0.2% |
0.2% |
|
Notes:
1) Actual results for 2013–14 to 2015–16 used for calculation have been restated to reflect the presentation change for hospitals, school boards and colleges, to classify third-party revenue with government revenue.
2) Actual results for 2013–14 to 2016-17 also reflects a change in accounting treatment for net pension assets of jointly sponsored pension plans.
3) Net debt was restated to reflect prepaid expenses and inventory supplies being reclassified as non-financial assets, as opposed to financial assets in prior years.
Measures of sustainability
Net debt provides a measure of the future government revenues that will be required to pay for the government’s past transactions. Net debt as a percentage of the Province’s GDP shows the financial demands on the economy resulting from the government’s spending and taxation policies. A lower ratio of net debt-to-GDP indicates higher sustainability.
The Province’s net debt-to-GDP ratio was 39.0 per cent at the end of fiscal year 2017-18. The Province has restated its results for the change in the Province’s accounting treatment for net pension assets of jointly sponsored pension plans. This adjustment impacts net debt and related ratios. Restated, net-debt-to-GDP has remained within a narrow range over the 2013–14 to 2016-17 period, between 39.5 per cent and 40.6 per cent, and dropping this year to 39.0 per cent.
The ratio of net debt to total revenue is another measure of sustainability, since net debt reflects the future revenue that is required to pay for past transactions and events. A lower net debt to revenue ratio indicates higher sustainability. From its peak in 2014–15 at 233.5 per cent, the ratio has declined by 2017-18 to 215.0 per cent, primarily due to revenue rising faster than net debt.
Measures of flexibility
The ratio of interest on debt to total revenue shows the share of provincial revenue that is being used to pay borrowing costs and thus is not available for programs. A lower ratio indicates that a government has more flexibility to direct its revenues to programs. The ratio has fallen for Ontario over the past five years, from a high of 9.1 per cent in 2013–14 to the current level of 7.9 per cent. Lower interest rates, as well as the Province’s strategy of extending the term of its borrowing program and locking in historically low interest rates for a longer period has also contributed to lower interest costs. This strategy has extended the weighted average term to maturity of provincially issued debt from approximately eight years in 2009–10 to 12 years in 2017-18.
Own-source revenue as a share of the provincial GDP shows the extent to which the government is leveraging funds from the provincial economy collected through taxation, user fees and other revenue sources it controls. Too high a taxation burden makes a jurisdiction uncompetitive, so increases in the ratio can reduce future revenue flexibility. Ontario’s ratio was stable between 2013–14 and 2017-18.
Measures of vulnerability
Transfers from the federal government as a percentage of total revenue are an indicator of the degree to which the Province relies on the federal government for revenue. A very high ratio shows that a provincial government is very reliant on federal transfers, a source of revenue over which it has limited or no control, and is therefore vulnerable to shifts in federal policy on transfers. Ontario’s highest share of revenue from federal transfers in the past five years was 18.4 per cent in 2013–14. The lowest was 16.5 per cent in 2017-18. The gradual decline over this period largely reflects lower Equalization entitlements as well as a lower rate of growth in the Canada Health Transfer in 2017-18.
Foreign currency debt to total debt is a measure of vulnerability to changes in foreign currency exchange rates. Accessing borrowing opportunities in foreign currencies allows Ontario to diversify its investor base and take advantage of lower borrowing costs. It also ensures that the Province will continue to have access to capital in the event that domestic market conditions become more challenging. Ontario manages foreign currency risk by hedging its exposure to Canadian dollars through the use of financial instruments. Effective hedging has allowed the Province to consistently limit its exposure to foreign currency fluctuations to 0.5 per cent of debt issued for provincial purposes in 2013–14, declining to 0.2 per cent in 2017-18.
Fiscal management
Commission findings
The Independent Financial Commission of Inquiry was established on July 17, 2018. The Commission had a mandate to assess and advise on past accounting practices and the budgetary position of the Province relative to the one presented in the 2018 Budget. The final report of the Commission was delivered to the Attorney General and Minister of Finance on August 30, 2018. The Public Accounts of Ontario 2017–2018 are informed by the Commission’s recommendations.
Multi-year business planning
The government is taking action to strategically drive change and embed a focus on fiscal responsibility. Through sound financial business planning, the government is exploring innovative ways to deliver sustainable programs and services that matter to the people of Ontario. As part of this effort, the government has competitively procured an external consultant to conduct a line-by-line review of government’s historical spending over the past 15 years. The results of the line-by-line review will be used to make government more efficient and effective, and ensure all government spending is delivering promised results for the people of Ontario. Going forward, the government will carefully review provincial programs to deliver the best possible results at the lowest cost. Evidence-based decision-making supports the use of limited public resources to improve outcomes and ensure the long-term sustainability of provincial programs and services that will meet the needs of Ontarians.
Managing compensation
The 2018 Budget stated that the government’s approach to managing compensation will recognize the need to maintain a stable, flexible and high‐performing public‐sector workforce that supports the government’s transformational priorities, and at the same time ensures that public services remain sustainable.
Provincial public-sector wage increases continue to track below those in the private and municipal public sectors.
Average annual negotiated wage increase in Ontario per cent increase - table 11
|
Sectors |
January 1, 2017 to December 31, 2017 |
|---|---|
|
Private sector |
2.1 |
|
Public sector (Federal) |
1.4 |
|
Public sector (Municipal) |
2.0 |
|
Public sector (Provincial) |
1.9 |
|
Sources: Ontario Treasury Board Secretariat and Ontario Ministry of Labour. |
|
Managing interest on debt
The interest on debt expense of $11.9 billion reported for 2017-18 was an improvement of $0.3 billion over the 2017 Budget. Through a combination of lower-than-forecast deficits and borrowing requirements, lower-than-forecast interest rates and cost-effective debt management, interest on debt has consistently come in below plan in each year since the 2010 Budget.
Non-financial activities
This section discusses key non-financial results of major sectors. The purpose is to provide readers of the Annual Report with highlights of government spending and activities in these sectors.
Health care
The government acts as a steward of the health care sector, providing overall direction and leadership for the system, including planning and resource management. However, it is less involved in the direct delivery of health care.
Results reported in 2017-18 included:
- Restructuring of the health care system to make Local Health Integration Networks (LHIN) responsible for managing and coordinating services provided by the former Community Care Access Centres (e.g., nursing, personal support and therapy services; placements to long-term care homes, adult day programs or supportive housing).
- Expanded the Ontario Drug Benefit program to include OHIP+, under which all provincially-insured children and youth under the age of 25 receive prescription drug coverage for eligible medications.
- Addition of 2,000 beds and spaces, which includes 1,200 in hospitals, to improve access to care for patients and families and reduce wait times in hospitals, at home and in the community.
- Critical repairs and upgrades made to 131 hospitals across the province including upgrades or replacements to roofs, windows, heating and air condition systems, fire alarms and back-up generators.
- Launched a new online tool to help people find wait times information for surgeries and procedures at hospitals across the province and expanded digital tools available for patients (e.g., Ontario.ca/health, eReferral system in Waterloo-Wellington region, OHIP+ Online Prescription Search Tool).
- Provided home and community care health services to approximately 670,000 clients and their families.
- Provided treatment support to an additional 100,000 people with anxiety and depression by increasing access to publicly funded structured psychotherapy in primary care settings, mental health and addictions community agencies.
Education
Ontario’s publicly funded early years and education system is focused on supporting the province’s children and students.
Results reported in 2017-18 included:
- For the 2017-18 school year, approximately two million students were enrolled in elementary and secondary education through Ontario’s publicly funded education system. This is similar to 2016-17 enrollment.
- Over 262,000 junior and senior kindergarten students enrolled in full-day kindergarten in approximately 3,500 schools across the province. This is slightly higher than the 261,462 students enrolled in full-day kindergarten in 2016-17.
- Access to broadband internet for more than 70,500 students in 181 schools across the province.
- 427,032 licensed child care spaces for children ages 0 to 12, up from 406,395 spaces in 2016-17. Approximately 83 per cent of elementary schools offer before and after school programs for children aged 4 to 12.
Postsecondary and training
Postsecondary and training helps prepare people with the knowledge and skills required for the modern workforce. Ontario’s economic prosperity and competitive advantage are increasingly dependent on a highly skilled, diverse and adaptive workforce.
Results reported in 2017-18 included:
- A 68 per cent postsecondary attainment rate, consistent with the attainment rate reported in 2016-17.
- Over 400,000 students qualified for awards under OSAP, a 16 per cent increase since 2016-17.
- Supported training for over 71,000 apprentices, up from 68,510 apprentices in 2016-17.
- Employment, training and labour market programs and services were provided to more than one million Ontarians through Employment Ontario.
Children’s and social
The government supports a large and diverse population that comprises people most likely to experience, or be at risk of experiencing, social and economic exclusion and ensures every child and young person in Ontario has access to supports to make positive choices, achieve their potential and seamlessly transition to adulthood.
Results reported in 2017-18 included:
- Provided direct funding to an additional 1,000 adults with developmental disabilities through the Passport program, building upon the 21,000 new individuals and families who received direct funding (13,000 adults through Passport and 8,000 children and their families through the Special Services at Home program).
- Completed the rollout of the $50 million Local Poverty Reduction Fund. Since its launch in 2015, the Fund has supported 119 projects across 48 communities to evaluate new and innovative ways to reduce poverty.
- Increased food access for children and youth in 63 First Nations across 120 program sites since 2016, through investments to the First Nations Student Nutrition Program.
- Continued violence prevention and resilience programs for 37,500 youth through the Enhanced Youth Action Plan that was fully implemented in 2016-17.
- Construction of three new ErinoakKids Centre for Treatment and Development facilities in Mississauga, Oakville and Brampton to consolidate 10 existing spaces into three modern buildings.
Justice
The justice sector supports access to justice, ensures legality in government and administers the justice, public safety, policing and correctional systems to ensure that Ontario’s diverse communities are supported and protected.
Results reported in 2017-18 included:
- Appointed 13 more judges to the Ontario Court of Justice, hired 32 assistant Crown attorneys, provided funding for Legal Aid Ontario to hire 14 of 16 duty counsel, and hired 25 of 26 new court staff positions to support reducing time-to-trial through more pre-trial case management and to improve the bail system.
- Provincewide expansion and enhancement of the province’s Bail Verification and Supervision Program to serve more vulnerable and low-risk accused pending trial.
- Established a new bail bed program to provide accommodation and community-based 24-hour supervision for high-needs individuals who may otherwise be held in custody pending resolution of their criminal matters. The program is operating in four locations with 62 beds available in total.
- Invested in 23 local crime prevention, community safety and well-being initiatives to support collaboration between police services and community partners. Some examples of the initiatives included the use of a mobile application by police officers to communicate with local hospitals and share information when assisting a person experiencing a mental health crisis, and engaging local residents in leadership training to develop and deliver long-term social and recreational activities. From 2010 to 2017, Ontario has allocated more than $18.6 million in funding through the Proceeds of Crime Front-Line Policing Grant in support of 210 community safety projects across the province.
- Updated the Provincial Nuclear Emergency Response Plan (PNERP) Master Plan to increase alignment with national and international standards, enhance emergency planning, and to incorporate lessons learned from recent international emergencies and best practices from leading experts.
Condition of provincial tangible capital assets
Infrastructure investments should be made using an evidence based approach including a focus on asset management which will ensure the delivery of high quality public services while managing the cost of these services.
- Each ministry that owns or operates infrastructure is required to prepare and update an asset management plan that outlines how it will properly maintain its assets as part of the budgeting process.
- The Province compiled its first asset inventory in 2016 as a key step in managing provincial assets more effectively. The asset inventory is the foundation for informing infrastructure planning, and in particular for advising on appropriate funding allocations between infrastructure expansion and renewal needs. The inventory currently contains information such as the location, age, condition and value of over 10,000 tangible capital assets including buildings and the entirety of the province’s bridges and road network. This covers the majority of the infrastructure assets owned or consolidated (i.e., certain broader public sector organizations) by the Province. The asset inventory is updated annually and the plan is to include additional asset classes and more information that is comparable across sectors along with establishing a baseline to measure change over time.
- The Province uses the inventory to track, monitor and report on the physical condition of assets. For example, the inventory contains indicators such as Facility Condition Indexes (FCIs), Bridge Condition Indexes (BCIs) and Pavement Condition Indexes (PCIs), which help to inform the state of infrastructure asset and where repair and renewal needs are greatest.
- Moving forward, the Province is looking to improve infrastructure asset data management to include other relevant data such as demographics, population projections, service demand, service capacity, and utilization into the infrastructure planning process. This integrated data will provide a base to support evidence-based infrastructure planning decisions that help ensure that infrastructure investments provide value for money and are made at the right time and the right place.
Transparency and accountability
Ontario continues to take steps to enhance government transparency and fiscal accountability in financial reporting.
Recent developments in public sector accounting standards
The Province’s financial reports are prepared in accordance with the accounting principles for governments issued by the Public Sector Accounting Board (PSAB) of the Chartered Professional Accountants of Canada (CPA Canada).
PSAB's project on the concepts underlying financial performance remains a work in progress. Ontario, along with other senior Canadian governments, continues to monitor the work of the project’s task force and to provide input to support high-quality Canadian public sector accounting standards.
As described in Note 1 to the Consolidated Financial Statements, future changes in both public sector and private sector accounting standards may affect how assets, liabilities, revenues and expenses are reported in the Province’s consolidated financial reports. Other current projects that are being closely monitored by Ontario include PSAB's review of its employment benefits standard which includes accounting for pensions as well as accounting for financial instruments, foreign currency translation, asset retirement obligations, revenue reporting and public-private partnerships.
The C.D. Howe Institute fiscal accountability report
Each year the C.D. Howe Institute, an independent research organization supporting economically sound public policies, produces a report on its assessment of the fiscal planning and reporting practices of senior Canadian governments.
The Institute observes that financial reports are a vital tool for understanding governments’ financial plans and activities. In this regard, consistency and comparability of planned and actual results in the Budget, estimates, and summary financial statements of the Province are essential to allow users to compare performance against the Budget Plan and to understand longer-term trends.
The most recent report assesses the quality of financial information released by senior Canadian governments and their success or failure in achieving their budgetary goals over the past 15 years.
The 2018 Report rates Ontario lower as compared to previous years largely due to a qualified audit opinion in 2015–16 and 2016-17.
Footnotes
- footnote[1] Back to paragraph Amounts reported as “Plan” in the 2017 Budget have been reclassified for changes in reporting revenues and expenses for hospitals, school boards and colleges. Note 19 to the financial statements provides details.
- footnote[2] Back to paragraph Actual results for 2016-17 reflects changes in accounting treatment for net pension assets of jointly sponsored pension plans and market accounts. Note 19 to the financial statements provides details.
- footnote[3] Back to paragraph Amounts reported as “Plan” in 2017 Budget, reclassified for changes in reporting revenues and expenses for hospitals, school boards and colleges. Note 19 to the financial statements provides details.
- footnote[4] Back to paragraph Actual results for 2016-17 reflect a change in accounting treatment for net pension assets of jointly sponsored pension plans. Note 19 to the financial statements provides details.
- footnote[5] Back to paragraph Teachers’ Pension Plan impact is included in Other programs. In the Consolidated Financial Statements, this item appears under the Education sector. Schedule 4 to the financial statements provides details.
- footnote[6] Back to paragraph Provincial revenue from Hydro One Limited’s net income is proportional to the Province’s ownership share.
- footnote[7] Back to paragraph Actual results for 2016-17 reflects changes in accounting treatment for net pension assets of jointly sponsored pension plans and market accounts. Note 19 to the financial statements provides details.
- footnote[8] Back to paragraph Includes adjustments for the net book value of assets disposed during the year, as well as changes in valuation.
- footnote[9] Back to paragraph Mainly transfers for capital purposes to municipalities and universities and expenditure for capital repairs.
- footnote[10] Back to paragraph Includes government administration, natural resources, social, culture and tourism sectors.
- footnote[11] Back to paragraph Includes third-party investments in consolidated entities such as hospitals, colleges and schools
- footnote[12] Back to paragraph Actual results for 2016-17 reflects changes in accounting treatment for net pension assets of jointly sponsored pension plans and market accounts. Note 19 to the financial statements provides details.
- footnote[13] Back to paragraph The Province’s operating deficit of $3.7 billion and a net $7.5 billion in changes to assets and liabilities that provided cash for operating purposes. See the Consolidated Statement of Cash Flow.
- footnote[14] Back to paragraph New investments of $12.4 billion less proceeds of $0.3 billion from the sale of tangible capital assets.
- footnote[15] Back to paragraph Including net increase in financing of capital projects through AFP. See Note 4 to the Consolidated Financial Statements.
- footnote[16] Back to paragraph The comparative figures have been reclassified to conform to 2017 presentation.
- footnote[17] Back to paragraph Teachers’ Pension Plan impact is included in Other programs. In the Consolidated Financial Statements, this item appears under the Education sector. Schedule 4 to the financial statements provides details.