2024 Provincial Apiarist report
2024 Season highlights
The Ministry of Agriculture, Food and Agribusiness’ (OMAFA) Apiary Program conducted regular and targeted inspections in 2024.
25,004 honey bee colonies were shipped outside of Ontario for the pollination of blueberry and cranberry crops in eastern Canada.
Ontario beekeepers reported an overall overwinter honey bee mortality of 50% for the winter of 2023–2024. This was higher than the 36% reported in the previous year.
Notable statistics about the 2024 Ontario beekeeping industry include:
- number of registered beekeepers: 4,095
- number of registered commercial beekeepers (operating 50 or more colonies): 249
- number of registered non-commercial or hobbyist beekeepers (operating 49 or fewer colonies): 3,846
- number of registered colonies: 111,263
- preliminary average honey yield/colony: 23.85 kg (52.59 lb) per colony
- preliminary total estimated honey crop: 2.7 million kg (5.85 million lb)
- overwinter honey bee losses reported by commercial beekeepers: 50%
- selling permits issued: 125
- queen and nuc permits issued: 119
- import permits issued: 38
Pest and disease levels
During the 2024 beekeeping season, OMAFA inspected a total of 590 bee yards. OMAFA apiary inspectors assessed the presence of common apiary pests and diseases through the brood nest inspection of 4,885 colonies. Inspectors checked for varroa mites in 1,498 of the colonies receiving brood nest inspections and checked for small hive beetle in an additional 7,081 colonies through top bar inspections.
The prevalence of the following diseases among inspected colonies were:
- American foulbrood: 0.35%
- European foulbrood: 0.16%
- sacbrood virus: 0.04%
The data represents the colonies inspected in 2024 and is not necessarily reflective of the beekeeping industry across the province.
American foulbrood (Paenibacillus larvae)
American foulbrood (AFB), a bacterial disease of honey bees, was detected in 17 honey bee colonies or 0.35% of the colonies inspected in Ontario. These colonies represented 11 bee yards positive for AFB or 1.86% of the yards inspected. The 2024 data represents a minor increase in AFB from 2023 when AFB was observed in 0.34% of colonies.
Starting in the 2024 beekeeping season, samples of suspected brood diseases found during apiary inspections are collected and submitted for laboratory confirmation by molecular analysis at the University of Guelph’s Animal Health Lab. Although visual signs and symptoms of a brood disease are still important to detect disease within a colony, laboratory confirmation is now routinely required since strains of European foulbrood are displaying characteristics of AFB. The use of molecular confirmation of brood diseases was initially piloted by the Apiary Program during the 2023 beekeeping season.
Sample analysis continues to confirm that the strains of AFB circulating in Ontario remain susceptible to oxytetracycline.
European foulbrood (Melissococcus plutonius)
European foulbrood (EFB), a bacterial disease of honey bees, was detected in 8 honey bee colonies or 0.16% of the colonies inspected in Ontario. These colonies represented 4 bee yards positive for EFB or 0.68% of the yards inspected. The 2024 data represents a major decrease in EFB from 2023 when EFB was observed in 1.38% of colonies. In May 2023, OMAFA apiary inspectors found the presence of EFB in 2 large commercial beekeeping and pollination operations located in the Niagara Region and Haldimand County.
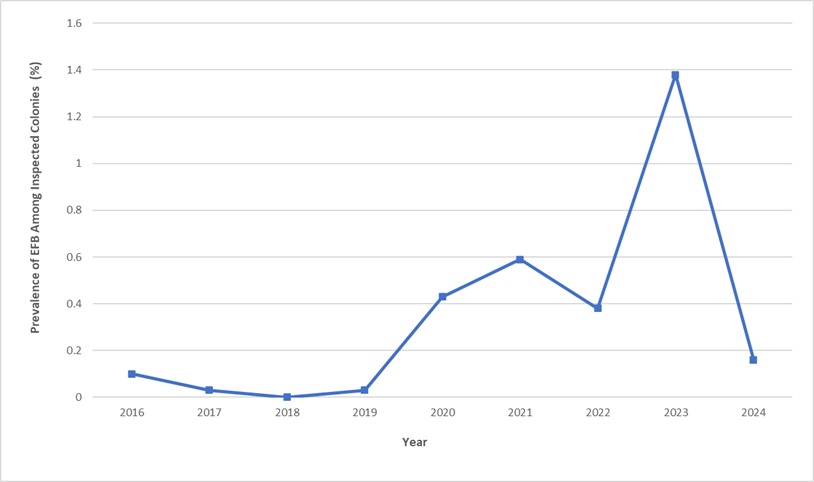
Although there was a decrease in EFB in 2024 compared to the levels found in 2023, overall, there appears to be a sustained trend of increase in EFB over recent years in Ontario (Figure 1). This trend has also been observed and reported on from other apiary programs in North America.
The more recent cases of EFB have been reported to be harder to treat and manage. In some provinces, colonies with serious EFB infections have been reported to be incapable of recovering. The possible reasons for this situation are outside the scope of this report and are being investigated by researchers.
Accessible description of Figure 1
Small hive beetle (Aethina tumida)
Small hive beetle (SHB) is an insect pest of honey bees. A total of 9 new bee yards, including both commercial and small-scale operations, tested positive for SHB in Ontario. This represents an increase in new detections in 2024 compared to 2023 (n=4). Differences in detections of SHB in beekeeping operations may be due to variation in:
- weather patterns
- colony conditions
- beekeeper management practices
The positive findings of SHB may also be overrepresented in inspection results due to the high rate of inspection of colonies in the Niagara region to allow for the movement of colonies for out of province pollination. Colonies in the Niagara region make up a large proportion of apiary inspections.
The presence of SHB larvae, which is the main cause of SHB damage to colonies, is documented during apiary inspections. Reports continue to show that there have been very few instances of SHB damaging colonies in the province and the impact of this pest in Ontario has been low.
OMAFA has an online map showing the number of SHB-positive bee yards confirmed in each township. This map provides current data to other jurisdictions that import Ontario honey bees and informs beekeepers about where SHB has been detected in Ontario, which helps them to manage the risk to their beekeeping activities.
Varroa mites (Varroa destructor)
Ministry apiary inspectors sample for varroa mites, a common and very serious pest of honey bees, during regular apiary inspections. Varroa mites were typically documented at low levels of infestation early in the beekeeping season for both commercial and small-scale beekeepers, but increased to higher levels later in the season. Across the province, 1,498 colonies (935 commercial, 563 small-scale) were inspected for varroa mites using a standard alcohol wash (a sample of approximately 300 bees collected from the brood nest, washed in alcohol and the varroa mites filtered and quantified).
Since varroa mites are widely distributed (they are virtually in every single honey bee colony in Ontario) and well-established across the province, the prevalence of these mites is not as informative as the degree of infestation.
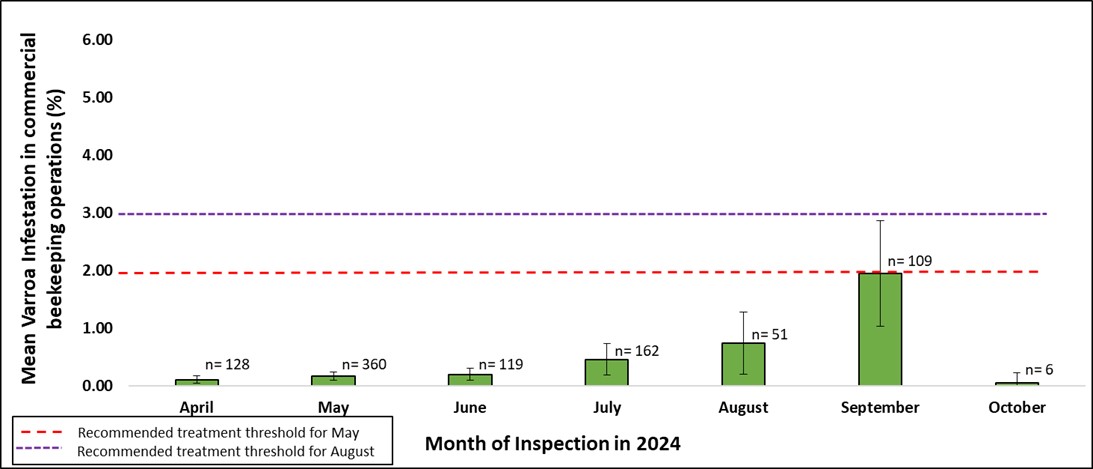
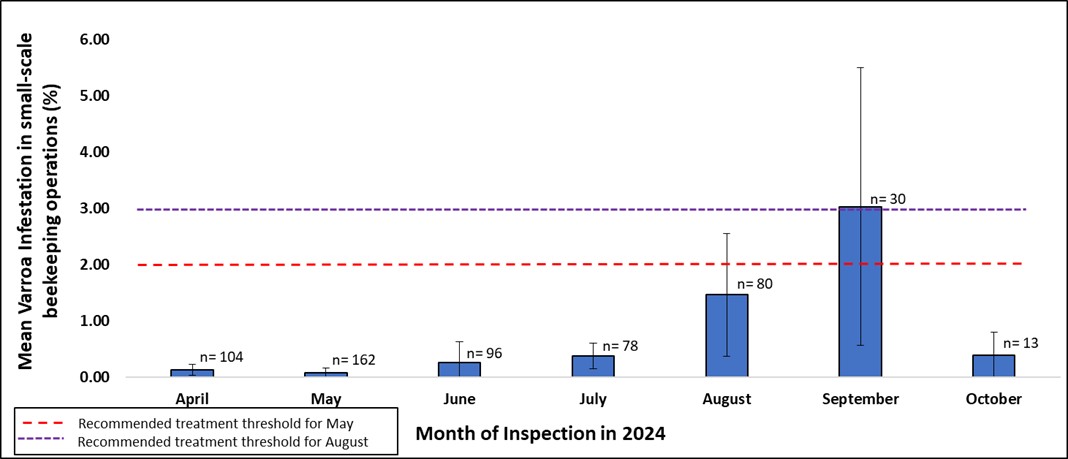
Guzman et al. (2010) established treatment thresholds for varroa mite infestations. Colonies should be treated for varroa mites in:
- May if the infestation is greater than 2%
- August if the infestation is greater than 3%
Accessible description of Figure 2
Accessible description of Figure 3
Among commercial operations, the mean varroa mite infestation remained below treatment thresholds throughout the entire season. Mean varroa mite infestations ranged from a low of 0.06% in October to a high of 1.95% in September (Figure 2). The sample size for October was very small (n=6), so this may not be representative of the commercial honey bee colonies in Ontario.
The degree of varroa mite infestation among small-scale operations was lower at the beginning of the season and higher at the end of the season, peaking similar to commercial beekeepers but with many more instances of high levels of varroa mites found in individual operations, as represented by the higher standard error bars. Varroa mite infestations ranged from a low of 0.09% in May to a high of 3.03% in September (Figure 3).
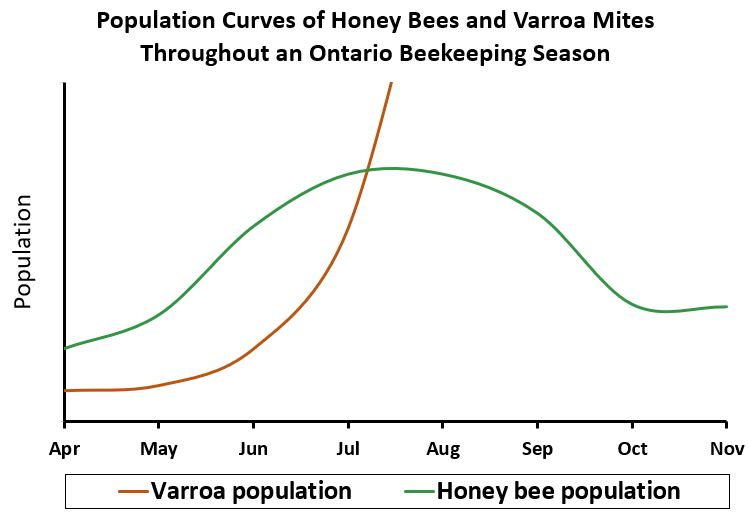
The life cycle of varroa mites is dependent on the life cycle of honey bees since varroa mites cannot reproduce independent of developing honey bees. If honey bees reproduce earlier in the season, varroa mites are accordingly increasing their levels and reaching peak populations earlier. As soon as honey bee brood is produced, varroa mites begin to reproduce and increase their population (Figure 4).
Varroa mites have an exponential population growth, meaning an increase in levels accelerates faster as time goes on. Once varroa mites reach a certain level, they may become difficult to manage later in the season due to the sheer number present in the colony.
Accessible description of Figure 4
This shows the importance of regularly monitoring for varroa mite levels throughout the beekeeping season as it can be easy to miss early population peaks, especially when growth falls outside of a typical year’s pattern (for example, in early spring). If beekeepers do not sample frequently throughout the season to check if their varroa mite levels are low, and if earlier treatments are needed, it becomes difficult to dismiss varroa mites as a major factor of overwinter colony loss.
Weather and seasonal conditions influence varroa mite levels and beekeepers must adapt their management practices accordingly, especially as earlier springs and warmer weather lasting longer into the fall become more common with climate change.
Overall, the available data shows that both regular monitoring throughout the season and late season monitoring for varroa mites are important. In particular, late season sampling in September and in October, after varroa mite treatment has been applied, is important to ensure that the treatment used was effective at lowering the level of infestation and that reinfestation with varroa mites from nearby apiaries is not occurring.
Learn more about varroa mites.
Honey production
In 2024, the honey survey was expanded to survey all registered beekeepers with 20 or more colonies. Previously only commercial beekeepers with 50 or more colonies were surveyed. This change was made to get a better response rate and more accurate results for the industry in Ontario.
Honey survey questionnaires were conducted using Survey Hero and emailed to registered beekeepers with 20 or more colonies. About 12% of the beekeepers responded, representing approximately 5,850 colonies across the province. This is only about 5% of all colonies in Ontario in 2024.
Based on the responses, the preliminary estimated average honey production in Ontario was 23.85 kg (52.59 lb) per colony. This is a notable decrease from the final 2023 statistics, which were 35.9 kg (79.1 lb) per colony. The decrease is likely due to cooler weather and variable nectar-producing conditions, particularly too much rainfall in many parts of Ontario.
Pollination services
Ontario honey bee colonies are regularly sent to pollinate berry crops in eastern Canada (Quebec, New Brunswick and Prince Edward Island).
25,004 honey bee colonies were moved from Ontario to eastern Canada in 2024 for the purpose of pollination. This is an increase from the 18,564 honey bee colonies that left the province in 2023. This increase may reflect an increase in colony numbers from some large operations that may have had higher losses in the previous year.
Ontario and the eastern Canadian provinces worked together to set inspection requirements for shipping colonies across provincial borders. The spread of SHB from regions in Ontario to eastern Canada remained a concern for inspection requirements in 2024.
Another inspection criterion for pollination colonies in 2024 was EFB. In 2023, 2 large operations in southern Ontario had difficulty managing serious EFB infections. Inspections in 2024 showed that EFB was down and there were no reported outbreaks of EFB.
Honey bee mortality
Overwinter honey bee mortality
In spring 2024, a survey was used to estimate overwinter honey bee colony losses. The survey was sent to 182 registered commercial beekeepers. About 58% responded, representing 50,803 colonies across the province.
Based on the survey results, commercial beekeepers reported an approximate 50% overall honey bee colony loss during the 2023–2024 winter. This was an increase from the 36% reported in the previous year (2022–2023). Small-scale beekeepers reported a lower winter loss of 43%.
Refer to the full report on 2024 overwinter losses.
In-season honey bee mortality
An in-season honey bee incident is defined as atypical mortality in a honey bee colony during the active beekeeping season that may be suspected to be related to chemical or pesticide exposure. Pests, disease and management practices are factors that need to also be taken into account when there are notable colony health issues or bee death observed by the beekeeper.
Beekeepers can report these incidents to OMAFA through the Agriculture Information Contact Centre or by using the Apiary Program’s online form.
Beekeepers are encouraged to use the Managed Honey Bee Mortality online form to report significant honey bee mortality incidents. Reports may be shared with the Ministry of the Environment, Conservation and Parks (MECP) and Health Canada’s (HC) Pesticide Management Regulatory Agency. After reviewing a report an inspection of the reported yard(s) may be conducted by:
- OMAFA (for a honey bee health issue)
- MECP or HC (for a pesticide-related issue)
In 2024, OMAFA received 4 in-season honey bee mortality incident reports.
Varroa mite management and the possibility of amitraz resistance
Managing the mite
Controlling varroa mites, a pest that lives on honey bees, can be complicated but it is possible.
The concept of Integrated Pest Management (IPM) has been available to beekeepers for over 20 years and its use is supported by Ontario’s Provincial Apiarist. IPM involves using a mix of strategies rather than selecting a single type of treatment.
Throughout the season, beekeepers may need to use different treatments at different times. They should consider:
- which treatments to use and when
- how many treatments to apply during the season
- whether the treatments were successful in reducing mite levels enough to stop damage
No single treatment can guarantee full control. A treatment may not work as expected due to:
- timing of application
- duration of application
- seasonal variations
- re-infestation
- temperature sensitivity
This requires beekeepers to frequently sample their colonies to monitor varroa mites levels. Beekeepers should also understand that:
- if sampling for varroa reveals that varroa are at low levels, understand that varroa levels are always increasing
- the varroa mite population grows exponentially as the beekeeping season goes on
- once varroa levels have greatly increased in a colony, they can be difficult to control or decrease
- not all treatments will reduce the levels of varroa mites sufficiently, and further additional treatments may be needed
Beekeepers should invest in training and education in IPM and sampling for varroa mites.
Varroa mites and amitraz resistance
Beekeepers may be concerned about varroa mites in Ontario that may have developed resistance to amitraz, the active ingredient in the treatment Apivar®.
In fall 2023, the Ontario Apiary Program and the Ontario Beekeepers’ Association’s Technology Transfer Program ran a small sampling project to investigate this. They used the Pettis Test (bioassay) method to check for resistance. Most samples showed high efficacy (90% and above), but a few showed reduced efficacy (below 85% efficacy).
The sampling project had some limitations:
- The Pettis Test is not the most sensitive method for detecting resistance in varroa.
- Sampling was done late in the season and was partially dictated by logistics and available resources.
- The results are not representative of the population of varroa mites in Ontario.
While the project didn’t confirm widespread and established resistance to amitraz in varroa mite populations in Ontario, it also couldn’t rule it out.
Amitraz resistance has been documented in varroa mite populations in the United States and some prairie provinces in Canada, so its status should continue to be monitored in Ontario. Varroa mites in Ontario have established resistance (or reduced efficacy) to other compounds, including:
- coumaphos
- fluvalinate
- flumethrin
New treatment options will be needed to help beekeepers rotate treatments and continue to incorporate effective IPM practices in their beekeeping operations. However, developing, testing and approving new treatments can take many years.
There are currently many legally registered options for varroa mite control available. Each of these treatments have their own advantages and disadvantages. Beekeepers must make their own decision on what to use balancing:
- efficacy
- temperature thresholds
- cost and handling time
- application methods
Beekeepers may also want to consider using a flash treatment (a shorter timed treatment) with an organic acid before or after the full use period of Apivar®. Beekeepers should not combine Apivar® with another treatment, since this may degrade the Apivar® or impact the bees in ways the manufacturer had not tested for.
Beekeepers may need to consider changing some of their established production or labor practices to adopt new ways of managing varroa mites.
Learn about the treatment options, their application methods and timing for control of varroa mites.
Accessible image descriptions
Figure 1. Annual prevalence of EFB among Ontario honey bee colonies receiving a brood nest inspection from 2016 to 2024.
Figure 1 shows the annual prevalence of European foulbrood in Ontario apiaries was:
- 0.1% in 2016
- 0.03% in 2017
- 0% in 2018
- 0.03% in 2019
- 0.43% in 2020
- 0.59% in 2021
- 0.38% in 2022
- 1.38% in 2023
- 0.16% in 2024
Figure 2. Mean varroa mite infestation levels and treatment thresholds in Ontario commercial honey bee operations in 2024.
Figure 2 shows the mean varroa mite infestation of commercial honey bee operations was:
- 0.11% in April
- 0.16% in May
- 0.20% in June
- 0.45% in July
- 0.74% in August
- 1.95% in September
- 0.06% in October
Figure 3. Mean varroa mite infestation levels and treatment thresholds in Ontario small-scale honey bee operations in 2024.
Figure 3 shows the mean varroa mite infestation of small-scale honey bee operations was:
- 0.13% in April
- 0.09% in May
- 0.26% in June
- 0.38% in July
- 1.47% in August
- 3.03% in September
- 0.40% in October
Figure 4. Varroa mite population curve (without treatment or intervention) in relation to a honey bee population curve over a typical Ontario beekeeping season.
Figure 4 is a line graph showing the relationship between varroa mite (brown line) and honey bee (green line) populations within a single honey bee colony over the beekeeping season. The relationship reflects the growth of varroa mite populations if no varroa mite treatments are applied to the colony. In this situation, the varroa mite population shows exponential growth beginning in the spring (May) and overtaking the honey bee population in the summer months (July). The honey bee population growth line resembles a bell curve, peaking in the summer months and declining into the fall months.