Broad-scale Monitoring Program
We monitor fisheries in Ontario’s inland lakes in cycles. The first took place between 2008-12. Read about our program here.
Managing recreational fisheries in Ontario
In 2008, the ministry began to fully implement the Ecological Framework for Fisheries Management (EFFM) with the goal of improving the way recreational fisheries are managed in Ontario. In addition to individual lake management on some waters, fisheries management is focused on broad geographic areas, where management, planning, and monitoring occurs in 20 fisheries management zones (FMZs).
The EFFM provides the core components of fisheries management including:
- a regulatory and policy outline
- public involvement in management decisions
- fisheries management planning
- research, monitoring, and assessment of fisheries
- communications and public reporting
MNR, with advice from FMZ advisory councils, develops fisheries management zone plans. Plans include the identification of challenges facing the fishery within a zone, setting of goals for the fishery, and management actions to achieve those goals. The Broad-scale Monitoring (BsM) Program was developed to support the EFFM through long-term monitoring of fish populations, aquatic habitat, and recreational fishing. The BsM program provides information to support fisheries management decisions and to report on the state of fisheries in each FMZ.
Goals of the Ecological Framework for Fisheries Management
- improve sustainability of fisheries
- public participation in fisheries management
- better customer service with simpler fishing regulations
Fisheries are now monitored on a broad scale
The BsM program was created by MNR to evaluate Ontario’s fisheries on a broad level. Once every 5 years, information is collected from a representative number of lakes in each FMZ in a standardized way. The number of lakes included in the program is sufficient for managing and reporting on fisheries in each zone, but represents a relatively small percentage of the total number of lakes in Ontario. Broad-scale monitoring includes the collection of detailed information about fish species and fish communities, physical and chemical water characteristics, aquatic invasive species, and fishing effort for each lake surveyed. The first sampling cycle of the BsM program occurred from 2008 to 2012.
The BsM program is designed to:
- describe the distribution, amount, and diversity of fishes in Ontario
- estimate the current state and changes over time of Ontario’s fisheries
- identify natural and human-caused stresses affecting fisheries
- provide reports on the state of fisheries and aquatic environments in Ontario
The program provides MNR biologists with additional benefits and opportunities to gather information on the biodiversity and health of aquatic environments. It includes monitoring the spread of aquatic invasive species, collecting genetic samples for researchers, gathering climate change data, sampling fish for contaminants for the Ministry of the Environment and Climate Change’s Guide to Eating Ontario Sport Fish, and collecting samples for the monitoring of water quality in surveyed lakes.
Question: Why is sampling conducted once every 5 years?
Answer: Five years is an appropriate interval for detecting changes in fish populations based on a management or environmental change. This is due partly to the generation time of many recreational fish species. It’s also the time it takes to collect enough information to detect those changes in fish populations while remaining cost-effective, since Ontario is so large with many lakes.
How many lakes are in the Broad-scale Monitoring Program?
It would be impractical to monitor all of the lakes in Ontario, so a sample of lakes from each zone is selected for monitoring. Lakes are randomly selected in proportion to the total number of lakes in each zone, starting with lakes greater than 50 hectares and up to 250,000 hectares.
Fifty hectares was chosen as the smallest lake size based on the ability to access and use sampling gear in the lake, while 250,000 hectares was the largest because lakes larger than this are already intensively monitored by the ministry. There are over 18,000 lakes in Ontario with a surface area between 50 and 250,000 hectares. Fifty-eight percent are located in northwestern Ontario, 34% in northeastern Ontario, and 8% in southern Ontario (Table 1).
Table 1. The number and percentage of lakes between 50 and 250,000 hectares (ha) in each fisheries management zone (FMZ) in Ontario
| Region | FMZ | Number of lakes (50–250,000 ha) | Percent of provincial total |
|---|---|---|---|
| Northwest | 2 | 6,448 | 35 |
| Northwest | 4 | 2,003 | 11 |
| Northwest | 5 | 1,652 | 9 |
| Northwest | 6 | 894 | 5 |
| Northeast | 1 | 1,584 | 8 |
| Northeast | 3 | 941 | 5 |
| Northeast | 7 | 1,170 | 6 |
| Northeast | 8 | 1,116 | 6 |
| Northeast | 10 | 1,220 | 7 |
| Northeast | 11 | 399 | 2 |
| South | 12 | 10 | <1 |
| South | 15 | 853 | 5 |
| South | 16 | 88 | <1 |
| South | 17 | 41 | <1 |
| South | 18 | 256 | 1 |
| Total | All | 18,675 | 100 |
Lakes are randomly selected for the program and identified as either a trend lake or a state lake. A trend lake is sampled once in each monitoring cycle. Trend lakes must contain brook trout, lake trout, or walleye. These species are top predators and indicators of the status of coldwater and coolwater aquatic ecosystems. The BsM program aims to survey 10% of all known brook trout, lake trout, and walleye lakes in Ontario.
State lakes are sampled once in a 5-year cycle and may or may not be sampled again in future sampling cycles. State lakes are any lakes greater than 50 hectares regardless of the fish species present. The objectives of monitoring state lakes are to: sample lakes where the fish communities are unknown, as a measure of biodiversity, and to track the spread of invasive species. The BsM program aims to survey an equal number of trend and state lakes across the province within each zone.
Monitoring trend lakes is best for detecting changes in fish populations and aquatic ecosystems over time, while monitoring state lakes is best for describing the overall status of fish populations at a point in time. Including both trend and state lakes within the monitoring program is important for providing a balance between detecting changes quickly and describing the state of fishes and aquatic resources.
Within each FMZ, 10% of all known brook trout, lake trout, or walleye lakes between 50 and 250,000 hectares are selected as trend lakes, with a minimum of 10 lakes selected for brook trout and lake trout, and 20 lakes for walleye. Only four FMZs (6, 7, 10, and 15) have significant brook trout fisheries for sampling. The total number of trend lakes surveyed in Ontario for Cycle 1 of the BsM program was approximately 670.
The number of state lakes originally selected in each FMZ was proportional to the total number of all lakes between 50 and 250,000 hectares in each FMZ. However, due to constraints in Cycle 1, fewer state lakes were sampled than was originally planned. The total number of state lakes surveyed in Ontario for Cycle 1 of the BsM program was 113.
What information is collected?
Sampling is conducted by MNR crews on the selected lakes during the summer each year of the BsM cycle. This includes netting for fish, collecting water samples, checking for invasive species, conducting angling effort counts, and in some cases, collecting water depth (bathymetric) information for the lakes. Sampling on each lake may take 5 to 8 days to complete.
Fish netting
Fish netting is conducted to study and monitor the abundance and health of all fish species in a lake. Broad-scale monitoring uses a combination of two types of gill nets:
- “Large mesh” gill nets that target fish larger than 20 cm in length, the size range of interest to anglers
- “Small mesh” gill nets that target smaller fish, the size range of interest to large fish
Large mesh nets are useful for targeting sport fish like brook trout, lake trout, smallmouth bass and walleye and providing population size estimates. A variety of information is collected from the fish caught in each lake survey:
- length
- weight
- sex
- maturity
- ageing structure: scales and/or ear bone
- contaminant sample from muscle
- stomach contents
Small mesh nets are useful for providing information on fish communities (how many species exist). For small mesh nets, fish species, numbers caught, and length are recorded for each species. Information collected from both large and small mesh nets is used to describe the fish community structure including growth rates, survival estimates, feeding relationships, contaminant levels, fish health, and habitat use.
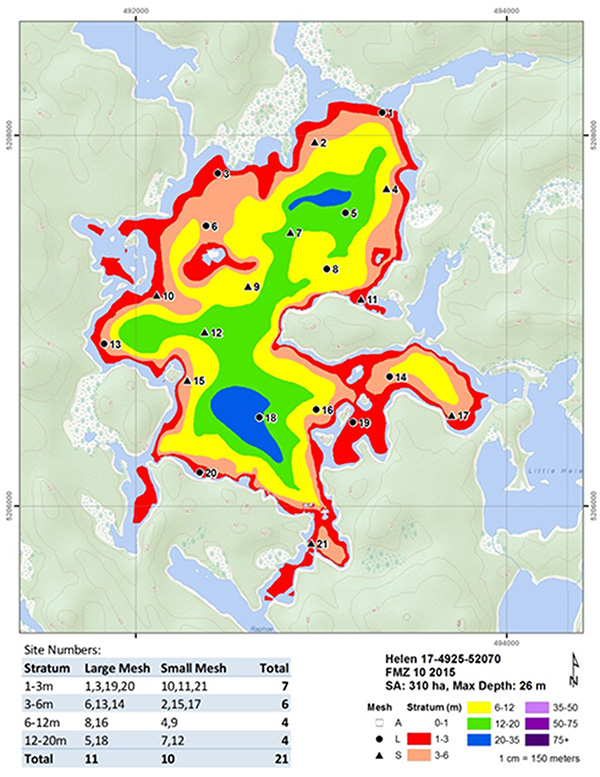
Netting begins in late May after the surface water temperature reaches 18ºC or greater. The number of nets used per lake is based on lake size (surface area) and depth. Netting locations are randomly selected by depth strata (1–3 m, 3–6 m, 6–12 m, 12–20 m, 20–35 m, 35–50 m, 50–75 m, >75 m) and distributed across the entire lake (Figure 1).To capture fish as they move throughout the lake, nets are set perpendicular to the shore. All nets are set overnight and lifted in the morning (nets are set no later than one hour before sunset and lifted no earlier than one hour after sunrise) to capture fish when they are most active.
Bathymetry
The BsM program requires the use of bathymetric (depth) data to: estimate lake depths, determine where to set fish nets, and for analyzing fish netting data. Bathymetric data is available for nearly 10,000 lakes in Ontario. For lakes without bathymetric information, a new depth survey is conducted.
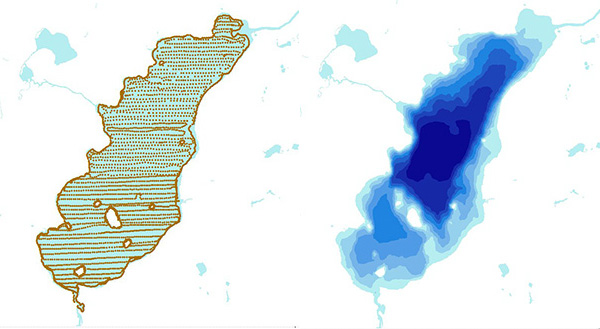
Bathymetric surveys are conducted by boat using a depth sounder with a global positioning system (GPS). The depth sounder collects a series of points at timed intervals as the boat moves across the lake. Depths and locations are recorded at each point by the GPS while the boat is driven along the shoreline (at 3–5 m depth), and then back and forth across the lake (Figure 2). A computer is used to connect points of equal depth to create a model representing the depth profile (depth contours) of the lake. Bathymetric data can provide information about lake size, volume, depth, and shoreline length that are factors which can influence the number and types of fish in a lake.
Water clarity
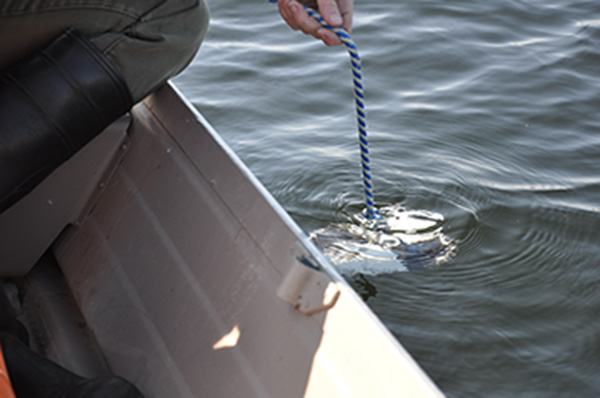
Water clarity is measured by collecting a secchi depth reading using a black and white metal disc known as a secchi disc (Figure 3). The deeper the secchi disc can be seen, the clearer the water. It is a simple and inexpensive way to gather data that reflects the productive capacity of a lake. Secchi depth readings are often collected at the deepest location of the lake, on the shaded side of the boat. The disk is lowered until it disappears; the depth is noted, and then the disk is raised until it reappears (depth noted). Secchi depth is recorded midway between these two depths.
Lakes with high amounts of suspended materials have lower water clarity and lower secchi depth readings. Suspended materials such as nutrients and algae can mean that the lake is productive. Typically, high productivity means lots of plant growth, low dissolved oxygen. When used in conjunction with other measurements, secchi depth readings can help to evaluate the nutrient status of a lake. As a general guideline, typical secchi depth readings for low productivity lakes are greater than 5 m, between 2- and 5-m depth ranges for medium-productivity lakes, and less than 2 m in depth for highly productive lakes.
Temperature and dissolved oxygen
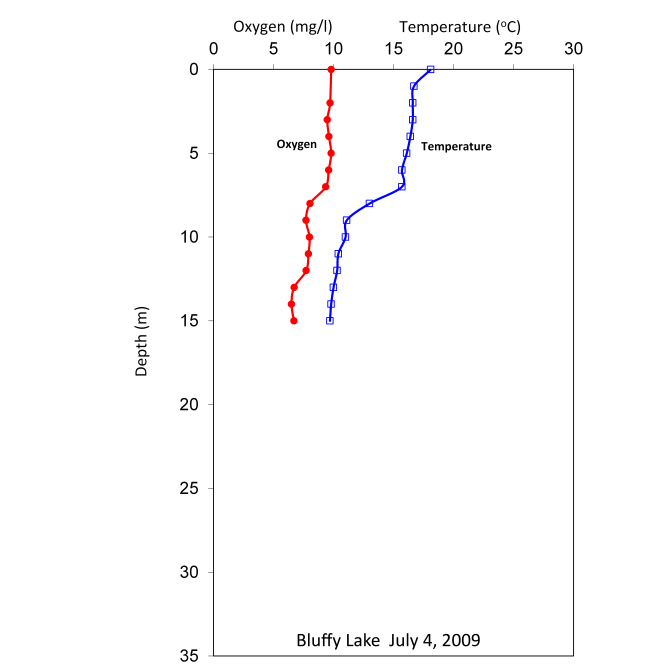
Dissolved oxygen and temperature profiles are recorded using a digital oxygen/temperature meter at the deepest location of the lake. Measurements are observed and recorded at the surface, and then at every metre until 16-m depth, then at every 2 m to the lake bottom. From this information, a temperature/dissolved oxygen profile is created: a graph showing how temperature and dissolved oxygen change with depth in a lake (Figure 4). The temperature and dissolved oxygen measurements provide information on fish habitat and the types of fish that can live in the lake. For example, lake trout require high oxygen levels in the cold deeper portions of the lake to survive.
For example, temperature remained relatively steady around 16°C, from the surface to 7 m, then started to cool.
Water chemistry
Lake water chemistry is evaluated for information on the nutrients in each lake surveyed. Fish distribution and production are linked to water chemistry and nutrient concentrations. Dissolved gases and nutrients contribute to the production of algae, which is food for many aquatic animals and fish.
Water samples are taken over the deepest part of the lake within four weeks of ice leaving the lake. For large multi-basin lakes, sampling is conducted in the basin where the outflow is located, or each basin might be sampled.
Sampling is conducted by lowering a sample bottle to the secchi depth and then slowly retrieving the bottle to the surface. Seven bottles are filled with the lake water, labelled and sent to the Ministry of the Environment and Climate Change for chemical analyses. Water samples are analyzed for the following:
- True colour
- pH
- Conductivity
- Alkalinity
- Calcium
- Magnesium
- Sodium
- Potassium
- Chloride
- Sulphate
- Silicate
- Iron
- Dissolved inorganic carbon
- Dissolved organic carbon
- Ammonia/Ammonium
- Nitrate/Nitrite
- Total Kjeldahl Nitrogen
- Total Phosphorous
Zooplankton
Zooplankton (small animals that live in the water or on plants/rocks in the lake) are collected and tested for aquatic invasive species that may not be visible to the eye, like spiny waterflea (Figure 5).
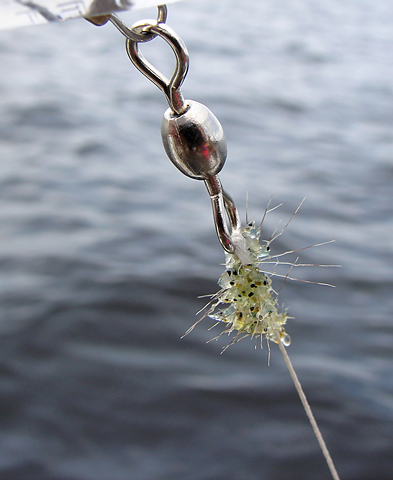
Zooplankton “hauls” are samples taken using fine-mesh nets at three locations in a lake: over the deepest part of the lake; near a boat launch, marina, or other access point; and a location on the windward side of the lake, since some aquatic invasive species are passive swimmers and are pushed through the water by wind and waves. The zooplankton-haul net looks like a windsock with a plastic cup attached at the end. The mesh size of the net is small enough to filter microscopic animals, like the spiny waterflea and juvenile zebra mussel from the water. The plastic-cup portion of the net is called the cod end and collects the zooplankton sample as the water passes through the net. Zooplankton are collected by either a vertical or horizontal haul of the nets through the water, depending on water depth. The plankton are then preserved in a sample bottle and analyzed to determine the species present.
Zooplankton information is used to document the distribution of aquatic invasive species and to help prevent further spread of aquatic invasive species into lakes and rivers. Any occurrence of an aquatic invasive species new to Ontario or new to a waterbody is reported to the Invading Species Hotline (1-800-563-7711).
Angling activity
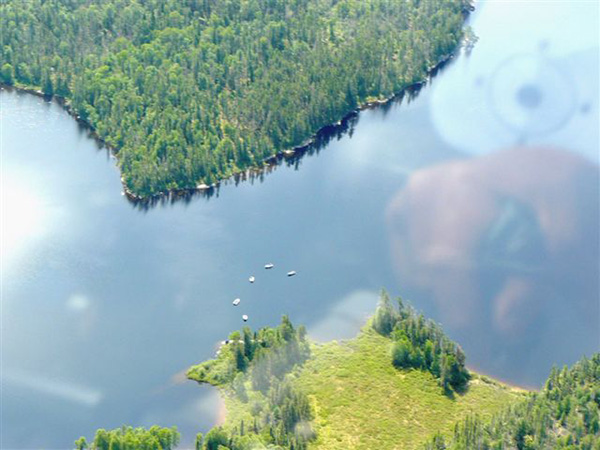
Aerial activity counts are completed each year during summer and winter to determine how much fishing is taking place in a zone. Angling surveys are done by airplane where a person counts the number of anglers, boats, and ice huts while a pilot flies over lakes in an FMZ. As many lakes as possible are surveyed within the flight path, which is determined by the location of lakes selected for the BsM program within each FMZ (Figure 6). Sometimes, lakes that are not part of the BsM program are surveyed in order to maximize the amount of information obtained for each flight.
Survey flights are conducted weekly, alternating between weekdays and weekends. Counts are conducted between 10 a.m. and 2:00 p.m. on scheduled days. The airplane is flown generally at an altitude of 460 m, but lower level flights occur due to weather or to count larger groups of anglers. Flight paths, direction of travel, and time entering and exiting the survey area are recorded. The number of anglers and boats are counted on each lake during summer surveys. The number of anglers, ice huts, and snowmobiles are counted on each lake during winter surveys.
Contaminant sampling
Contaminant sampling is conducted on fish caught during netting. A sample of tissue is taken from sport fish species spanning the range of sizes caught. The tissue sample is frozen and shipped to the Ministry of the Environment and Climate Change, Sport Fish Contaminant Monitoring Program. The information collected is published in the Guide to Eating Ontario Sport Fish.
Reporting on the Broad-scale Monitoring Program
Data collected through the BsM program is presented in different types of reports to help display and understand the information. Broad-scale monitoring bulletins have been created to summarize the information collected on each lake in the program.
Lake bulletins can be found on MNRs Fish ON-Line website.
State of the Resources Reports will also be produced for the BsM program and will summarize information for each FMZ and indicate the status of Ontario’s fisheries.
Definitions
Aquatic environment
Plant, animal and micro-organism communities and their physical environment functioning together as an ecological system. Ecological systems that support fish communities can have aquatic, wetland, riparian or terrestrial components.
Fishery
A term that is usually used to describe the human use of a group of fish and includes catching, preparing and selling fish. Ontario supports a number of different types of fisheries: aboriginal subsistence; commercial food fish; recreational; remote tourism; charter boat fisheries; and commercial bait fisheries.