Chapter 2: Economic Trends and Projections 2020
Introduction
This chapter presents a description of the anticipated changes in the Ontario economy based on past trends and the demographic projections presented in the previous chapter. Key implications for the future include:
- Moderating growth of the labour force
- Continued productivity growth; and
- Slowing economic growth driven by demographics
Economic performance in the near term will be heavily influenced by the COVID‑19 pandemic. As the purpose of this report is to focus on long-term trends, the projections are presented based on a 20-year outlook after the recovery from the COVID‑19 pandemic has occurred. A discussion of the implications of the COVID‑19 pandemic is included later in this chapter.
The projection presented is for Ontario's macroeconomic potential real gross domestic product (GDP) growth. Potential real GDP represents the maximum level of output that an economy can produce at relatively high rates of capacity utilization without causing rising rates of price inflation. These are presented as average annual rates of growth over time. An economy can temporarily produce above its potential level of output, which is accompanied by rising inflation. As well, an economy can operate below its potential output for a period of time. All economies will experience these variations above and below potential output through time over the business cycle.
1. Moderating Growth of the Labour Force
The future evolution in Ontario's labour force will be a critical factor in determining potential GDP growth. The long-term projection for Ontario's labour force depends on the increase in the working-age population and the participation rate — the percentage of the working-age population employed or seeking employment.
The overall economy-wide participation rate has been trending down due to the rising share of older workers (aged 55 and over) in the labour force, who tend to have lower participation rates compared to other working-age cohorts. The decline in the overall participation rate has been somewhat tempered by the participation rates of older workers rising gradually since the late 1990s as a growing segment of older workers have been delaying the transition to retirement. This reflects several factors including rising rates of educational attainment, greater employment opportunities and improving health outcomes.
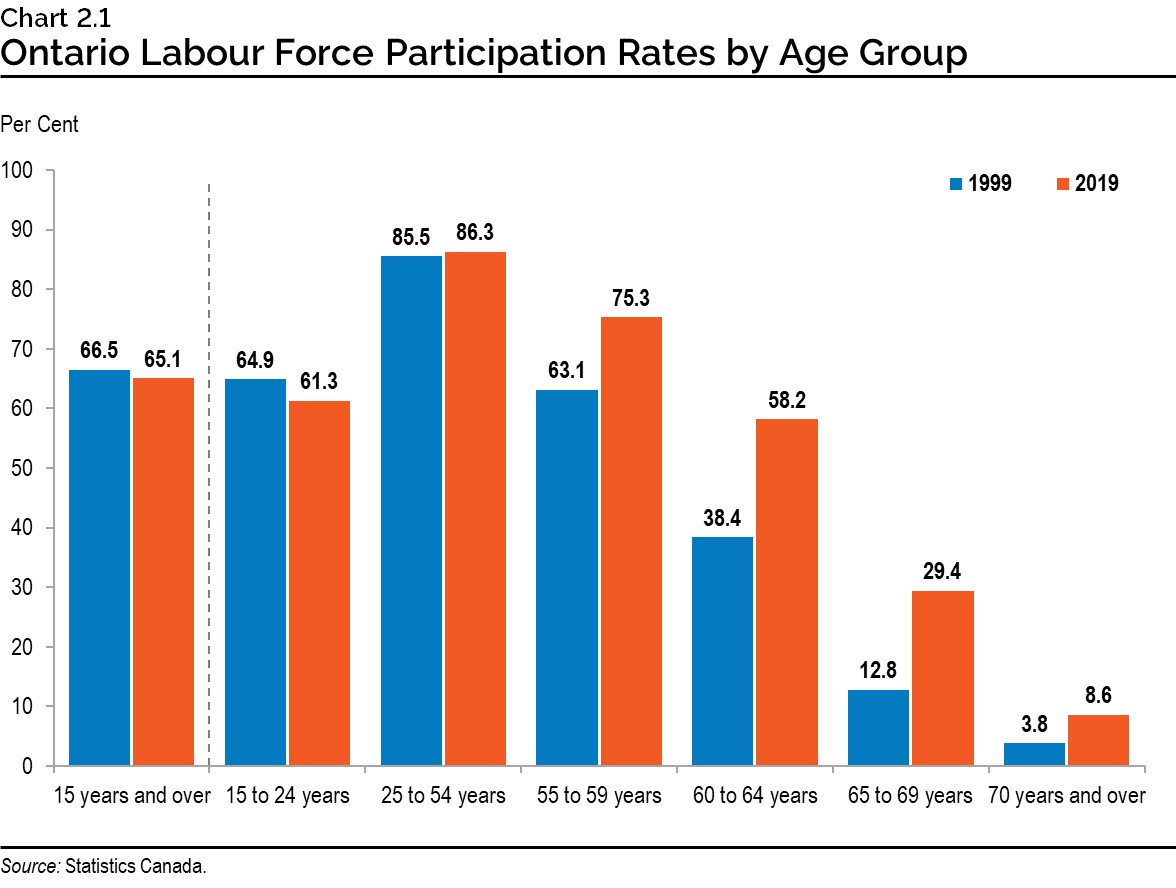
However, this increase is not projected to offset the impact of the declining shares of core working-age (aged 25 to 54 years) and youth populations (aged 15 to 24 years), whose participation rates are significantly higher than older workers.
The gradual decline in the participation rate combined with moderating working-age population growth over the long term would result in slower labour force growth over the forecast period. Ontario's labour force is projected to grow by an average of 0.9 per cent annually over the long term, slower than its historical average annual pace of 1.4 per cent.
Ontario's Labour Force in Perspective
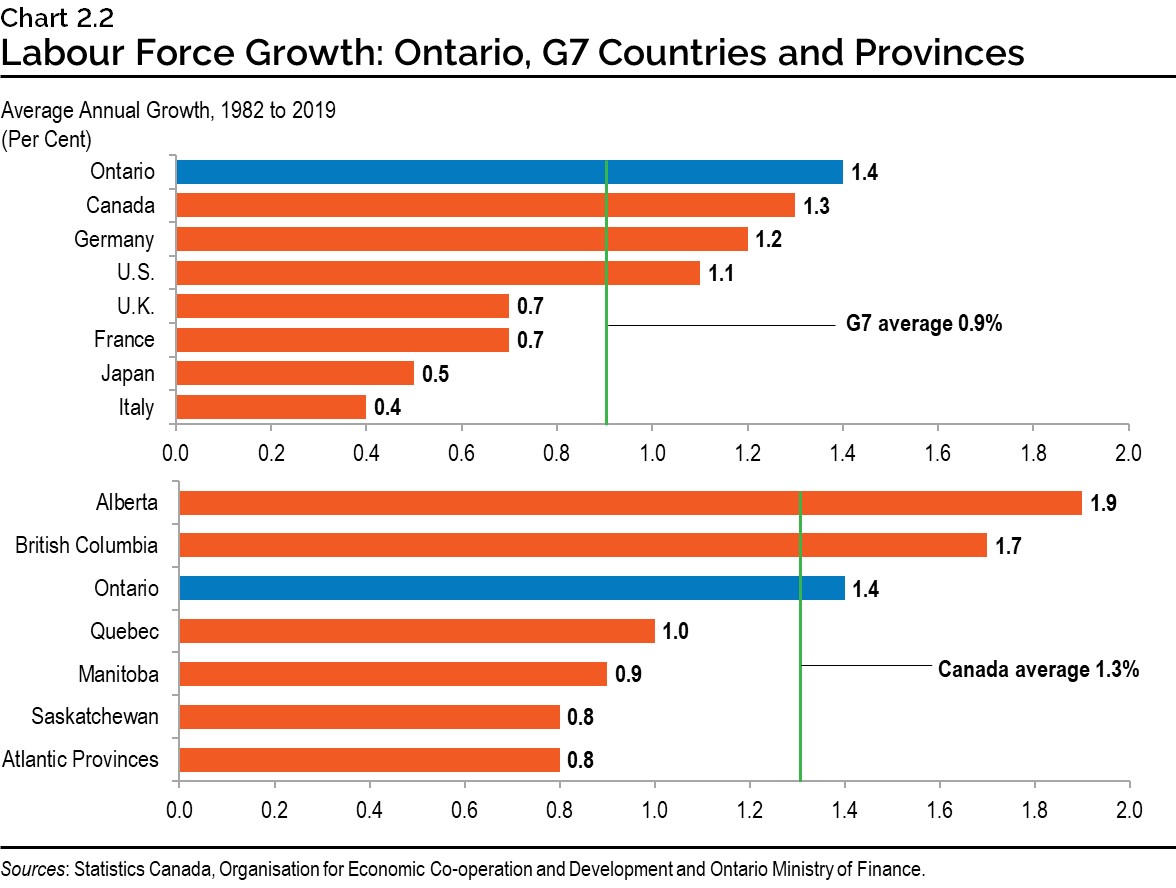
While Ontario and Canada's labour force growth has been slowing, they grew at a faster pace than most advanced economies over the 1982 to 2019 period. For example, during this period Germany, the United States, U.K. and other G7 countries experienced slower rates of labour force growth than Ontario and Canada.
Between 1982 to 2019, Ontario's labour force growth ranked third among Canadian provinces. Alberta's labour force growth led all other provinces during this period, expanding at an average annual rate of 1.9 per cent. Meanwhile, Quebec, Manitoba, Saskatchewan and the Atlantic provinces experienced relatively slower rates of labour force growth over this period.
2. Continued Productivity Growth
Labour productivity, or the amount of real GDP produced per hour worked, is a key determinant of future potential economic growth.
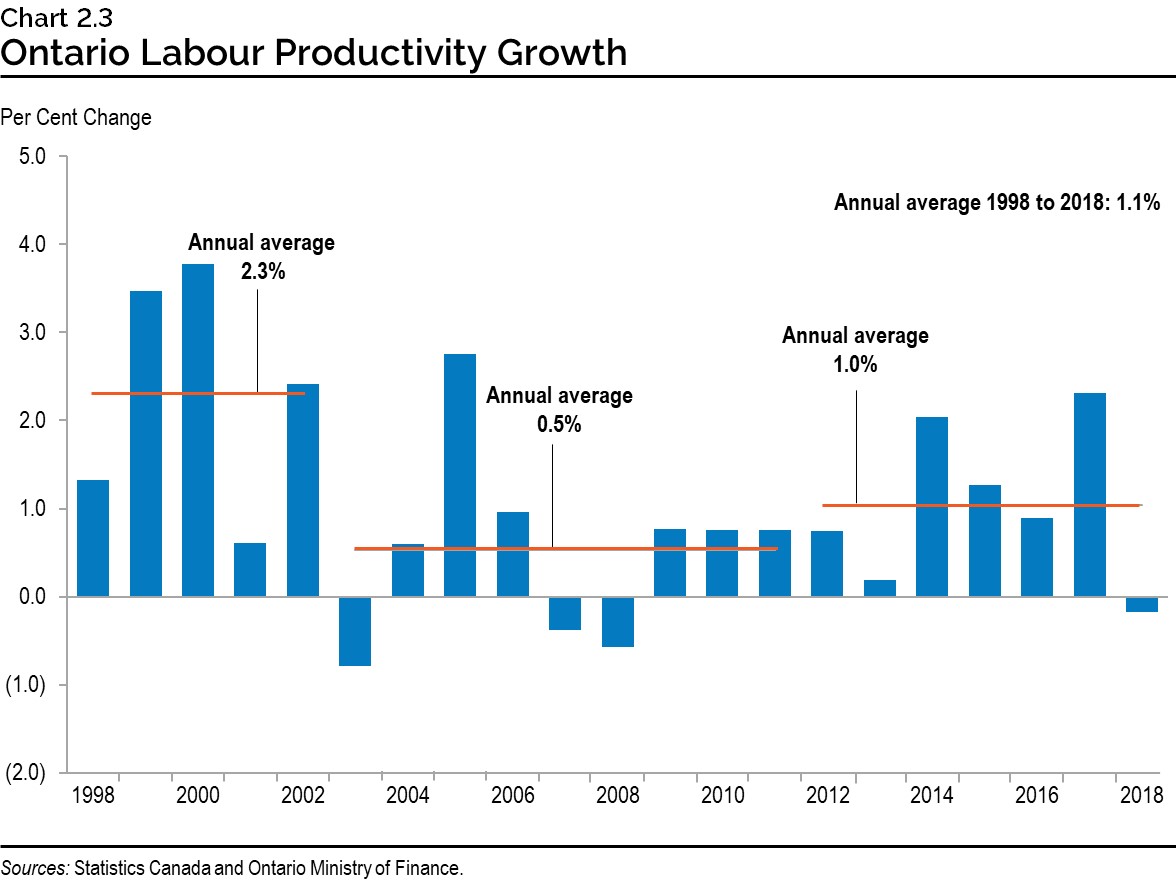
Ontario labour productivity growth has averaged 1.1 per cent per year from 1998 to 2018. During this period, productivity growth has experienced significant variations, with a period of relatively fast average annual growth of 2.3 per cent between 1998 and 2002, followed by an extended period of slower growth between 2003 and 2011, averaging 0.5 per cent annually. Ontario's productivity slowdown during that period can be largely attributed to the global commodity price boom and associated appreciation of the Canadian dollar, combined with increased competition from producers in newly industrializing economies.
Productivity is projected to advance at its historical average over the long-term projection period, averaging 1.1 per cent annually. Growth in labour productivity is largely driven by investment in physical capital, labour force skills and technological progress.
3. Slowing Economic Growth Driven by Demographics
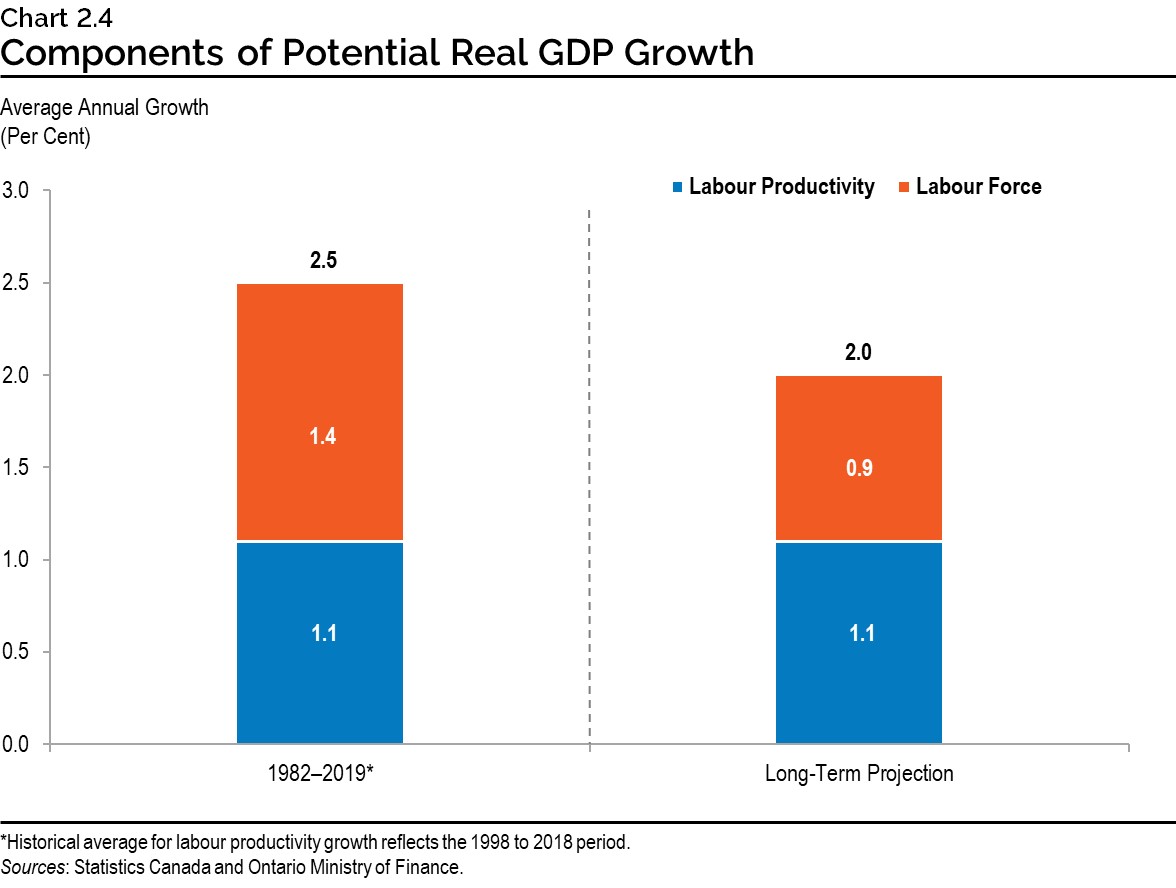
Potential real GDP represents the maximum level of output that an economy can produce without causing rising rates of price inflation. The main building blocks of potential output are the supply of workers (labour force) and the efficiency with which output is produced (labour productivity). Average annual growth in potential real GDP is projected to be 2.0 per cent for Ontario, slower than the 2.5 per cent average annual growth over the 1982 to 2019 period. This is the result of the slower projected growth in the labour force outlined earlier in this chapter, while labour productivity growth is expected to continue at its long run average pace.
Slower economic growth is expected across most regions globally. The Parliamentary Budget Officer (PBO) projects Canada's real GDP growth to advance at an average annual pace of 1.7 per cent over the long term, lower than the 2.4 per cent average annual growth experienced over the 1982 to 2019 period. The PBO projects Ontario's real GDP growth to be 1.7 per cent annually over the long term, same as the national average. This is lower than the Ontario Ministry of Finance's annual average growth projection of 2.0 per cent reflecting slower projected Ontario labour force growth by the PBO. Other provinces such as British Columbia and Quebec are also projected by the PBO to grow at a slower pace over the long-term projection. Likewise, long-run projections for the United States, Europe, Japan and China also indicate weaker economic growth than experienced in the past.
Slowing Economic Growth Across Jurisdictions
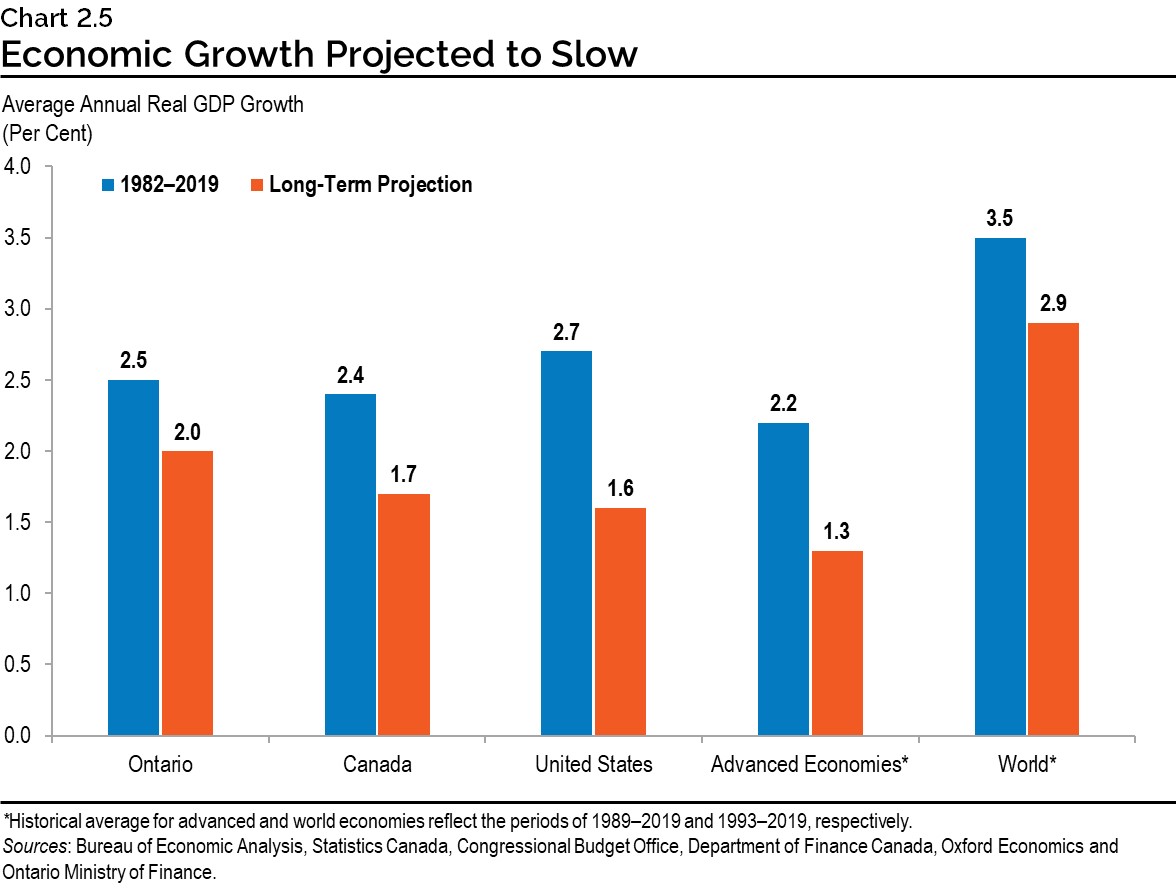
Ontario real GDP growth is projected to moderate from an average of 2.5 per cent annually between 1982 and 2019 to 2.0 per cent per year over the long-term projection. Moderating growth is expected in other jurisdictions as well. Canada, the United States, overall advanced economies, and the world economy are expected to experience a slower pace of economic growth over the long-term projection.
Long-Term Growth Projections
Prices and Nominal GDP Growth
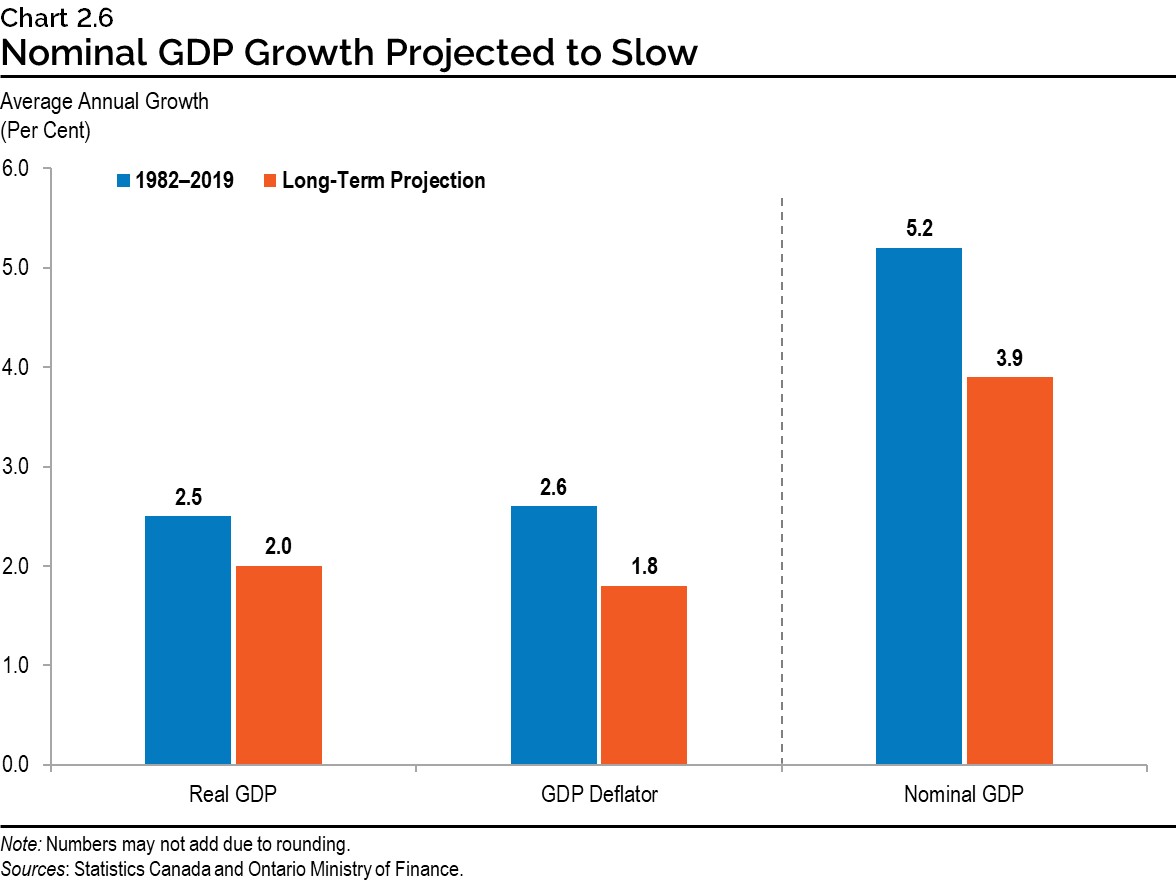
Ontario annual consumer price index (CPI) inflation is projected to be at the Bank of Canada's 2.0 per cent target range, on average, over the long-term projection. The GDP deflator is projected to average growth of 1.8 per cent annually, consistent with the historical relationship with CPI inflation. This is slower than the average rate of CPI inflation over time of 2.0 per cent due, in part, to differences in the calculation of the price indices. Nominal GDP is expected to expand at an annual average rate of 3.9 per cent over the projection period, slower than the historical average of 5.2 per cent per year.
Ontario Projected Potential Output Growth
| 1982–2019 | Long-Term Projection | |
|---|---|---|
| Nominal GDP | 5.2 | 3.9 |
| Real GDP | 2.5 | 2.0 |
| GDP Deflator | 2.6 | 1.8 |
| Consumer Price Index | 2.8 | 2.0 |
| Labour Force | 1.4 | 0.9 |
| Participation Rate (Per Cent) | 67.1 | 62.1 |
| Productivity Real GDP per Hour Worked | 1.1* | 1.1 |
* Average between 1998 and 2018.
Sources: Statistics Canada and Ontario Ministry of Finance.
Global Economic Environment
Ontario is part of an integrated global economy, connected with the rest of Canada, the United States and the world. Ontario has access to open and efficient markets which connects the province to global capital and trade flows.
The projections in this report assume that over the long term, after the global economy recovers from the impacts of COVID‑19, the external environment evolves in a manner consistent with trends leading up to the pandemic (alternative scenarios and risks are described later in the chapter).
The long-term projection assumes global real GDP growth to average 2.9 per cent annually while U.S. real GDP growth is expected to advance at an average annual pace of 2.0 per cent. Emerging market economies are expected to continue growing robustly but at a slightly more moderate pace than in the previous decade.
Other important external factors which impact the projections are the outlook for the Canada/U.S. dollar exchange rate, interest rates, oil prices and rest of Canada real GDP growth.
Details of these are outlined in the table below.
| 1982–2019 | Long-Term Projection | |
|---|---|---|
| Rest-of-Canada Real GDP (Per Cent Change) | 2.2 | 2.0 |
| U.S. Real GDP (Per Cent Change) | 2.7 | 2.0 |
| Canadian Dollar (Cents US) | 80.1 | 83.2 |
| 90-Day Treasury Bill Rate (Per Cent) | 4.8 | 2.7 |
| 10-Year Government of Canada Bond Rate (Per Cent) | 6.0 | 3.5 |
| U.S. 90-Day Treasury Bill Rate (Per Cent) | 3.9 | 2.7 |
| 10-Year U.S. Government Bond Rate (Per Cent) | 5.7 | 3.5 |
| U.S. Real West Texas Intermediate Oil Price (2019 US$ per Barrel) | 56.7 | 64.3 |
Sources: Statistics Canada, Bank of Canada, U.S. Energy Information Administration, Federal Reserve and Ontario Ministry of Finance.
External trade — the net balance of the value of goods and services exported to and imported from other provinces and countries — is projected to be a modest contributor to real GDP growth. Ontario's exports are projected to rise by an average annual pace of 2.1 per cent over the long-term projection, driven by growing U.S. and global demand. Imports are expected to advance at an average annual pace of 2.0 per cent over the outlook, supported by steady growth in domestic incomes and consumer demand.
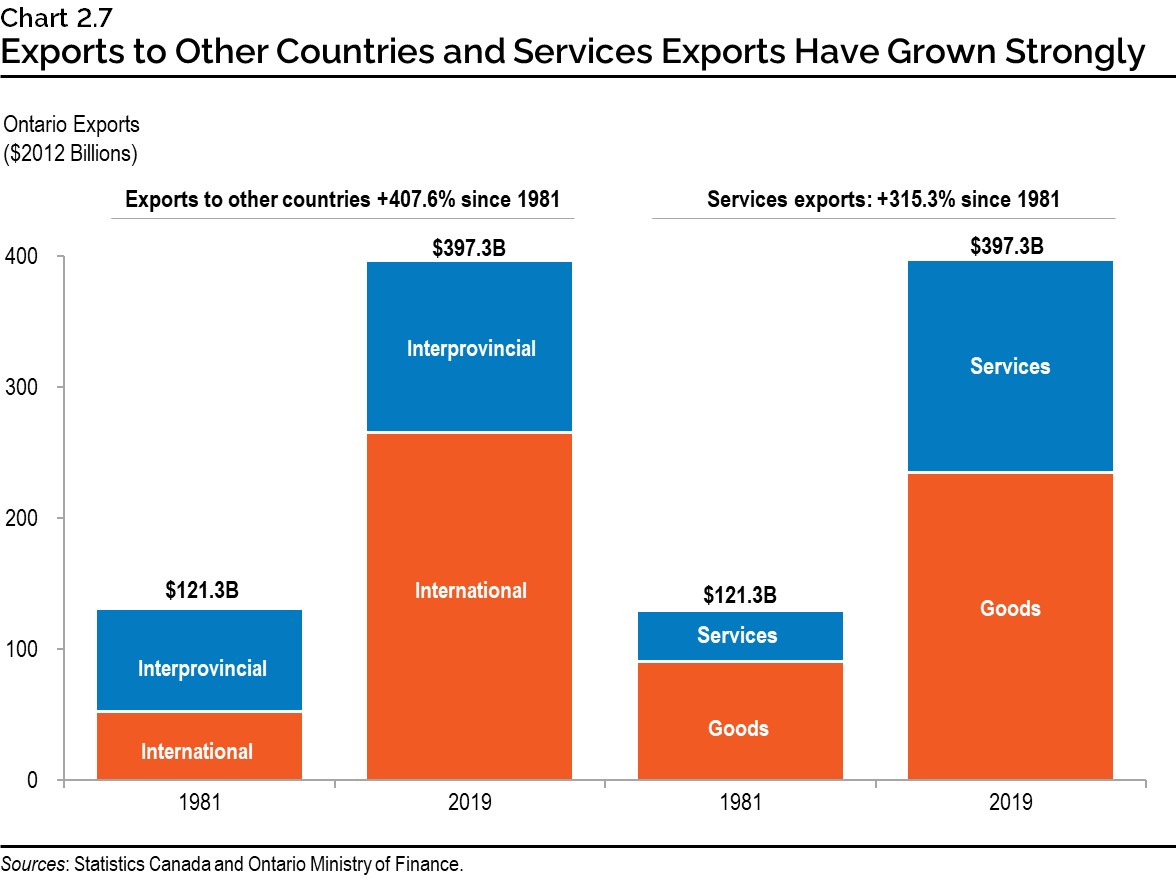
In the past few decades, external trade has evolved considerably. While overall trade has increased, exports of services has grown at a relatively stronger pace than goods exports. As well, international exports have increased more quickly than interprovincial exports. As a result, Ontario's international exports and services exports are now a larger share of overall exports than was the case in 1981.
There have been significant changes in the global trade landscape which have impacted Ontario's exports. Trade agreements and technological innovations have lowered trade costs, encouraging emerging market economies to integrate in the global economy and making global value chains (GVCs) economically viable. The emergence of GVCs has allowed countries to specialize in service-orientated tasks and increased the tradability of modern services such as telecommunications, information services and financial intermediation. In Ontario, service-based exports have grown in importance as the economy shifts from goods-producing to service‑producing industries. However, this has helped exacerbate a slowdown in made-in-Ontario manufacturing.
Continued Shifts in the Composition of Economic Activity
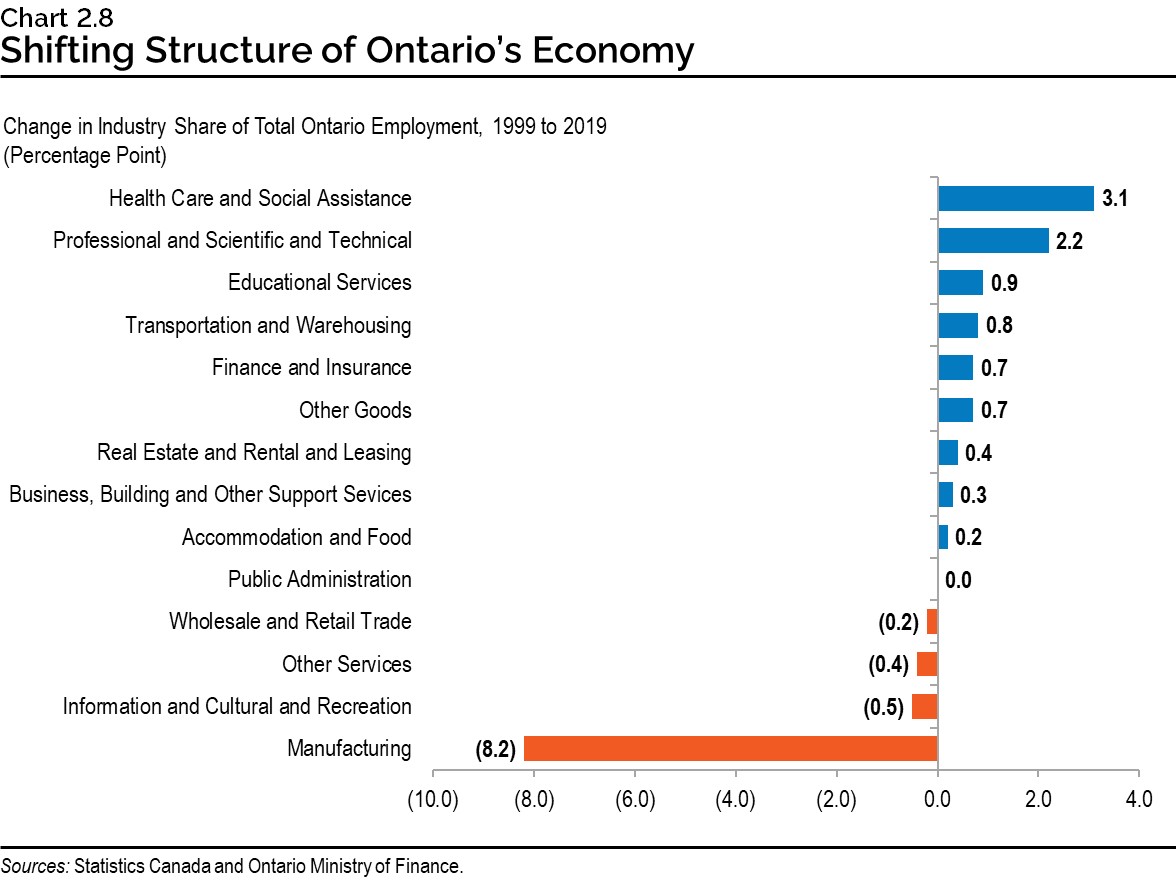
While Ontario's economy is highly diversified, it has undergone a major restructuring over the past two decades. The most significant change has been the decline in the proportion of output and employment in the manufacturing sector, as services sectors have been growing at a relatively stronger pace. Since 1999, the health care and social assistance share of total Ontario employment has increased 3.1 percentage points and the professional, scientific and technical services share has increased 2.2 percentage points over the same period. In comparison, the manufacturing share of total Ontario employment has declined 8.2 percentage points between 1999 and 2019.
Other Perspectives on Long-Term Growth
Projected long-term economic growth in this report is comparable to other forecasts. The lowest projection is from the Parliamentary Budget Officer (PBO) who projects growth of 1.7 per cent annually on average, while the University of Toronto projects average annual growth of 2.2 per cent over the long term. The Ontario Ministry of Finance's projection falls within the range of these projections.
| Real GDP | |
|---|---|
| University of Toronto | 2.2 |
| Ontario Ministry of Finance | 2.0 |
| Financial Accountability Office of Ontario | 2.0 |
| Conference Board of Canada | 1.8 |
| Parliamentary Budget Officer of Canada | 1.7 |
Sources: Policy and Economic Analysis Program, University of Toronto Long-Term Forecast (2019), Financial Accountability Office of Ontario Long-Term Budget Outlook: 2020-2050 (2020), Conference Board of Canada Provincial Outlook Long-Term Economic Forecast: Ontario (2020), Parliamentary Budget Officer of Canada Fiscal Sustainability Report (2020) and Ontario Ministry of Finance.
Alternative Scenarios and Risks
The path of long-term economic growth in Ontario is based on trends and assumptions that are subject to uncertainty and risk. The section below outlines the key risks and trends that could impact the economy, and how changes in key factors could influence Ontario's long-term growth.
Labour Force Growth
As outlined in Chapter 1: Demographic Trends and Projections, there are potential alternative paths for population growth in Ontario. Stronger rates of growth in the working-age population would lead to stronger growth in Ontario's labour force. Conversely, slower rates of growth in the working-age population would lead to slower growth in the labour force.
Though Ontario's labour force growth is expected to be slower over the long-term projection than in the past, this slowing in growth could be offset by stronger population growth through immigration. Real GDP growth would be directly impacted by different rates of growth in the labour force related to the alternative paths for population growth. The table below describes these changes.
| Long-Term Projection: Low Labour Force Growth | Long-Term Projection: Base Case Potential | Long-Term Projection: High Labour Force Growth | |
|---|---|---|---|
| Real GDP Growth (annual average) | 1.6 | 2.0 | 2.4 |
| Population Growth (annual average) | 0.6 | 1.1 | 1.6 |
| Labour Force Growth (annual average) | 0.5 | 0.9 | 1.3 |
Source: Ontario Ministry of Finance.M
Productivity Growth
Another factor that could be different is the province's long-run productivity growth. There have been periods when Ontario labour productivity growth experienced significant variations. Over a 20-year projection period, under a high productivity scenario leading to average annual real GDP growth of 2.3 per cent, the end-of-period level of real GDP would be 7.9 per cent higher than the base case potential scenario. In contrast, under a low productivity scenario with real GDP growth averaging 1.7 per cent annually, the end-of-period level real GDP would be 7.4 per cent lower than the base case potential scenario.
| Long-Term Projection: Low Productivity | Long-Term Projection: Base Case Potential | Long-Term Projection: High Productivity | |
|---|---|---|---|
| Real GDP Growth (annual average) | 1.7 | 2.0 | 2.3 |
| Labour Force Growth (annual average) | 0.9 | 0.9 | 0.9 |
| Labour Productivity Growth (annual average) | 0.8 | 1.1 | 1.4 |
Source: Ontario Ministry of Finance.
Global Economic Environment
In the long run, Ontario's economic growth will be influenced by developments in the global economy. A different pace of global economic growth, particularly in the United States, would have an impact on growth in Ontario. In addition, Ontario's growth could be heavily influenced by changes in the terms of trade. As commodity prices rise globally, Canada's terms of trade generally improve as the value of the country's exports rise relative to the price of imports. However, as a net importer of commodities, notably energy goods, higher commodity prices negatively affect Ontario's terms of trade. As well, higher commodity prices also cause the value of the Canadian dollar to appreciate, which has in the past negatively impacted the competitiveness of Ontario exports abroad.
Potential Implications of COVID‑19 on Ontario's Long-Term Economic Growth
The COVID‑19 pandemic has had an unprecedented impact on the global economy. The large and abrupt reductions in economic activity, uncertainty regarding the future path of the pandemic and the related easing of the necessary measures related to its containment have created a unique economic environment. The adverse economic impact of COVID‑19 will depend primarily on how long activity remains suppressed which, in turn, will depend on the evolution of the pandemic and the measures taken to suppress it.
Economic recovery from the global pandemic will occur. However, the timing and pace of the recovery will depend on a broad range of factors. Recovery will mainly be shaped by the decline and end of the pandemic, the corresponding easing and ultimate removal of measures taken to suppress it, as well as the success of policy measures taken by all levels of government to mitigate the associated economic impact.
The pace of Ontario's economic recovery will be influenced in part by its trading partners' response to COVID‑19. For example, the United States remains Ontario's primary destination for international merchandise exports. Ontario is also a major destination for U.S. exports, with the province being the number one trading partner with 19 states and the second largest trading partner with nine others in 2019.
As the situation evolves in the coming months, the full impact of COVID‑19 on the economy will become clearer. Past Ontario economic downturns have always been followed by a period of relatively strong and sustained growth. Historical experience suggests that average annual real GDP growth eventually resumes at or close to its pre-recession pace, as was the case following the recessions in Ontario in the early 1990s and 2008–09.
Appendix: External Environment
Global Economic Environment
The composition of global growth is expected to vary from region to region over the long-term projection. While countries like the United States are expected to post moderate growth, other regions like Europe and Japan are expected to post relatively slower economic growth.
Emerging markets such as China and India are expected to continue to post strong rates of economic growth over the long-term projection but at a slightly more moderate pace than in the previous decade.
Over the long-term projection, declining labour force growth due to an aging population is expected to slow global economic growth and will continue to be a key challenge to longer-term growth prospects globally.
Canadian Dollar
Long-term trends in the Canada/U.S. exchange rate are a consideration in the economic projection given that the United States will continue to be the largest international market for Ontario's exports. As of 2019, the United States was the destination for 77 per cent of Ontario's merchandise exports and the source of 54 per cent of Ontario's merchandise imports. The Canada/U.S. exchange rate is expected to average 83 cents US over the long-term projection, consistent with modestly rising world commodity prices.
United States
The long-run outlook for potential U.S. real GDP growth is expected to moderate according to the Congressional Budget Office (CBO). The CBO has modestly revised down U.S. long-term growth in recent years to 1.6 per cent average annual growth. This is due to trade barriers and a notable slowdown in labour force participation rates to just above 60 per cent by 2030.
Europe, Asia and Emerging Markets
Like the experience of the United States, major economies in Europe (European Union and United Kingdom) are expected to experience a moderation in economic growth over the long-term projection. The main factor behind this moderation in economic growth is the expected slowing of growth in the working-age population, which will adversely impact long-term economic prospects in Europe as well as in other economies in Asia and North America.
Over the long-term projection, economic growth in Japan is expected to be among the slowest of major advanced economies. Emerging market economies such as China will continue to account for a rising share of the global economy while posting more moderate rates of economic growth than in the recent past.
Rest of Canada
The rest of Canada is an important destination for Ontario exports. This report assumes that real economic growth in the rest of Canada will average 2.0 per cent annually over the long-term projection, in line with Ontario's projected long-term economic growth rate. Rest of Canada economic growth is expected to be supported by moderate economic growth in the United States as well as modestly rising commodity prices.
Chart Descriptions
Chart 2.1: Ontario Labour Force Participation Rates by Age Group
This chart compares Ontario labour force participation rates (expressed as percentages) by age groups in two different years, 1999 and 2019. The data points for the bar graph are as follows:
| Age Group | 1999 | 2019 |
|---|---|---|
| 15 years and over | 66.5 | 65.1 |
| 15 to 24 years | 64.9 | 61.3 |
| 25 to 54 years | 85.5 | 86.3 |
| 55 to 59 years | 63.1 | 75.3 |
| 60 to 64 years | 38.4 | 58.2 |
| 65 to 69 years | 12.8 | 29.4 |
| 70 years and over | 3.8 | 8.6 |
Source: Statistics Canada.
Chart 2.2: Labour Force Growth: Ontario, G7 Countries and Provinces
This shows two bar charts comparing the average annual growth in Ontario's labour force between 1982 and 2019, to labour force growth in G7 countries and in other Canadian provinces. The top chart shows Ontario's labour force growth at an average annual rate of 1.4 per cent, was higher than all other G7 countries. The aggregate G7 labour force average annual growth rate over the 1982 to 2019 period was 0.9 per cent. The bottom chart shows that Ontario's average annual growth in labour force of 1.4 per cent ranked third among Canadian provinces. Alberta's labour force growth led all other provinces during this period, while Quebec, Manitoba, Saskatchewan and the Atlantic provinces experienced slower rates of labour force growth over this same period. The average annual growth rate of the labour force for Canada was 1.3 per cent annually over the 1982 to 2019 period.
Sources: Statistics Canada, Organisation for Economic Co-operation and Development and Ontario Ministry of Finance.
Chart 2.3: Ontario Labour Productivity Growth
This bar chart shows the annual per cent change in Ontario's labour productivity between 1998 and 2018. Between 1998 and 2002, the average annual growth rate was 2.3 per cent. Between 2003 and 2011, the average annual growth rate was 0.5 per cent. Between 2012 and 2018, the average annual growth rate was 1.0 per cent. Over the entire period from 1998 to 2018, the annual average growth rate was 1.1 per cent.
Sources: Statistics Canada and Ontario Ministry of Finance.
Chart 2.4: Components of Potential Real GDP Growth
This chart is showing the average annual growth in combined labour productivity and labour force over the 1982 to 2019 period compared to the long-term projection. Over the 1982 to 2019 period, average annual growth for combined labour productivity and labour force was 2.5 per cent. Over the long-term projection, average annual growth for combined labour productivity and labour force is projected to be 2.0 per cent. Labour productivity has grown at an average annual rate of 1.1 per cent between 1998 and 2018 while labour force growth averaged 1.4 per cent annually over the 1982 to 2019 period. Over the long-term projection, labour productivity is projected to grow at an average annual rate of 1.1 per cent while labour force growth is projected to average 0.9 per cent annually.
Note: Historical average for labour productivity growth reflects the 1998 to 2018 period.
Sources: Statistics Canada and Ontario Ministry of Finance.
Chart 2.5: Economic Growth Projected to Slow
This chart is comparing historical and long-term projected average annual growth rates of real GDP for several jurisdictions. The historical average reflects the 1982 to 2019 period. The first pair of bars indicate Ontario's historical annual average growth rate to be 2.5 per cent, slowing to 2.0 per cent over the long-term projection. The second pair of bars indicate historical annual average growth for Canada to be 2.4 per cent, slowing to 1.7 per cent over the long-term projection. The third pair of bars indicate historical annual average growth for the United States to be 2.7 per cent, slowing to 1.6 per cent over the long-term projection. The fourth pair of bars indicate historical annual average growth for advanced economies to be 2.2 per cent, slowing to 1.3 per cent over the long-term projection. The final pair of bars indicate historical annual average growth for the world to be 3.5 per cent, slowing to 2.9 per cent over the long-term projection.
Note: Historical average for advanced and world economies reflect the periods of 1989 to 2019 and 1993 to 2019, respectively.
Sources: Bureau of Economic Analysis, Statistics Canada, Congressional Budget Office, Department of Finance Canada, Oxford Economics and Ontario Ministry of Finance.
Chart 2.6: Nominal GDP Growth Projected to Slow
This chart shows Ontario's average annual growth in nominal GDP over two time periods, 1982 to 2019 and over the long-term projection, disaggregated into its component parts, real GDP growth and GDP deflator growth. The first two bars show annual average growth in real GDP between 1982 and 2019 of 2.5 per cent, compared to 2.0 per cent growth over the long-term projection. The second pair of bars show GDP deflator growth between 1982 and 2019 of 2.6 per cent, compared to 1.8 per cent growth over the long-term projection. The final pair of bars show nominal GDP growth between 1982 and 2019 of 5.2 per cent, compared to 3.9 per cent over the long-term projection.
Note: Numbers may not add due to rounding.
Sources: Statistics Canada and Ontario Ministry of Finance.
Chart 2.7: Exports to Other Countries and Services Exports Have Grown Strongly
This chart contains four stacked bar charts showing total international and interprovincial, as well as goods and services exports between 1981 and 2019. The first two stacked bar charts show that both international and interprovincial exports have grown since 1981; international exports have grown by 407.6 per cent since 1981. The second pair of charts show that goods and services exports have both grown since 1981; services exports have grown by 315.3 per cent since 1981.
Sources: Statistics Canada and Ontario Ministry of Finance.
Chart 2.8: Shifting Structure of Ontario's Economy
This chart is a bar chart showing the change in industry share of total Ontario employment between 1999 and 2019 for the following industries: manufacturing; information and cultural and recreational; other services; wholesale and retail trade; public administration; accommodation and food; business, building and other support services; real estate and rental and leasing; other goods; transportation and warehousing; educational services; finance and insurance; professional, scientific and technical; and health care and social assistance services. The largest changes are a decline in manufacturing of 8.2 percentage points, and an increase in health care and social assistance services of 3.1 percentage points.
Footnotes
- footnote[1] Back to paragraph Fields, Uppal and LaRochelle-Côté, "The impact of aging on labour market participation rates", Statistics Canada (2017).
- footnote[2] Back to paragraph A. Sharpe, "Ontario's Productivity Performance, 2002-2012: A Detailed Analysis," Centre for the Study of Living Standards, (2015).