Benthic sampling in natural and regulated rivers
A methodology acknowledging that regulated rivers can have strong longitudinal and lateral gradients in the composition and abundance of benthos. These must be considered when developing a sampling plan. A similar approach can be used in lakes and reservoirs.
Aquatic Research and Development Section
Ontario Ministry of Natural Resources
Aquatic Research Series 2011-05
Sampling Methodologies for Ontario’s Flowing Waters
Nicholas E. Jones
September 2011
Benthic Sampling in Natural and Regulated Rivers
Sampling Methodologies for Ontario’s Flowing Waters
© 2011, Queen’s Printer for Ontario
Printed in Ontario, Canada
MNR 62761
ISBN 978-1-4435-8960-4 (PDF)
This publication was produced by:
Aquatic Research and Development Section
Ontario Ministry of Natural Resources
2140 East Bank Drive
Peterborough, Ontario
K9J 8M5
Online link to report can be found at: Ontario.ca/aquaticresearch
This technical report should be cited as follows:
Jones, N.E. 2011. Benthic Sampling in Natural and Regulated Rivers. Sampling Methodologies for Ontario’s Flowing Waters. Ontario Ministry of Natural Resources, Aquatic Research and Development Section, River and Stream Ecology Lab, Aquatic Research Series 2011-05
Please send comments and suggestions on the manual to Nick Jones at nicholas.jones@ontario.ca.
Cette publication hautement spécialisée Benthic Sampling in Natural and Regulated Rivers. Sampling Methodologies for Ontario’s Flowing Waters n’est disponible qu’en anglais en vertu du Règlement 411/97, qui en exempte l’application de la Loi sur les services en français. Pour obtenir de l’aide en français, veuillez communiquer avec le ministère des Richesses naturelles au Tom.Johnston@ontario.ca.
Abstract
Benthic invertebrates are the link from basal resources to higher trophic levels, including fishes. Benthic invertebrates are often sampled in aquatic monitoring programs because they are diverse, generally sedentary, responsive to environmental alterations, and are good indicators of ecosystem productivity and health. Longitudinal gradients in abiotic factors and benthic communities have long been recognized in natural and regulated rivers, while the importance of lateral gradients has gained less attention. In regulated rivers, particularly hydropeaking, the lateral areas of riverbed that are routinely wetted and dried with the variable stage and electrical demand create an “intertidal” or varial zone. Many established sampling protocols have been developed for wadeable streams and rivers and do not specify the distance from shore, or water depth and velocity where samples can be collected. The benthic sampling protocol discussed here provides a sampling methodology which acknowledges that rivers, particularly hydropower, can have strong longitudinal and lateral gradients in the composition and abundance of benthos that must be considered when developing a sampling plan.
Résumé
Les invertébrés benthiques constituent le maillon entre les ressources de base et les niveaux supérieurs de la chaîne trophique, et notamment les poissons. Dans le cadre des programmes de surveillance des eaux, on privilégie généralement la collecte d’échantillons d’invertébrés benthiques en raison de leur diversité, de leur sédentarité et de leur sensibilité aux détériorations environnementales, en plus ils sont de bons indicateurs de la productivité et de la santé des écosystèmes. Les gradients longitudinaux associés aux facteurs abiotiques et communautés benthiques sont reconnus depuis longue date dans les rivières au débit tant naturel que régularisé, mais les gradients latéraux suscitent moins d’attention. Dans les rivières au débit régularisé, et particulièrement au pic des crues, les parties latérales des lits des rivières qui sont régulièrement inondées puis asséchées en fonction des marées et de la demande d’électricité créent une zone « intertidale ». Bon nombre des protocoles d’échantillonnage ont été conçus pour les cours d’eau peu profonds, mais ils ne précisent pas à quelle distance du rivage il faut collecter les échantillons ni à quelle vitesse de débit ou profondeur d’eau. Le protocole de collecte d’échantillons benthiques dont il est question ici propose la méthodologie à suivre pour l’échantillonnage en précisant que les rivières, et particulièrement celles dont on exploite l’énergie hydraulique, peuvent avoir de forts gradients longitudinaux et latéraux dans la composition et l’abondance des peuplements benthiques dont il faut tenir compte quand on élabore un plan d’échantillonnage.
1.0 Introduction
Benthic invertebrates are consumers of basal resources (algae, biofilms, organic matter), and secondary consumers. They are the link from basal resources to higher trophic levels, including fishes. Benthic invertebrates are often sampled in aquatic monitoring programs because they are diverse, generally sedentary, and are responsive to environmental alterations. More importantly they are good indicators of ecosystem productivity and health. In Ontario, there are over 60 species of dragonfly that are provincially rare, making the monitoring of these species particularly important.
In general terms, the responses of invertebrates downstream of hydropower dams is not universal and appears to depend on the depth of the reservoir and the depth from which the dam draws water (Ward and Short 1978), and the ratio of low to high flows (Trotzky and Gregory 1974). Several authors have noted rapid longitudinal changes in environmental conditions and benthic invertebrate communities downstream of dams (Trotzky and Gregory, 1974; Armitage, 1978; Ward and Stanford, 1983). Changes in sediment size, water temperature, reservoir plankton (seston) output, are the primary factors that produce longitudinal zonation and can cause changes in the composition and productivity of the invertebrate community (Ward and Stanford 1983). Benthic invertebrate community characteristics in close proximity to the dam are often much different than those meters or kilometres downstream. Typically the filter feeding functional feeding group consisting blackflies (Simulids) and net spinning caddisflies (Trichoptera) dominate near the dam or lake outlet (Richardson and Mackey 1991; Jones 2010). These taxa filter the fine particulate e.g., zooplankton, phytoplankton, and dissolved organic carbon, called seston. As distance downstream of the facility increases, the amount of available seston decreases and invertebrate and fish production follows suit. While this longitudinal pattern is common it is not always present or can be reversed (e.g. anoxic discharge).
Previous research has shown that flow regime and level are important determinants of benthic community composition (Jones 2011). In regulated rivers, particularly hydropeaking operations, the lateral areas of riverbed that are routinely wetted and dried with the variable stage and electrical demand create an “intertidal” (Fisher and LaVoy 1972) or varial zone (Lorang et al. 1993). In natural rivers and run of the river operations, water levels typically recede much more slowly and peak less frequently (Figure 1). Invertebrates (e.g., oligochaetes, gastropods) within the varial zone of peaking rivers are typically tolerant of the harsh environmental conditions associated with them (i.e. , drying). Sampling that occurs only at low flows (minimum requirement) avoids this zone and provides a drastically different portrayal of the benthic community (Jones 2011).
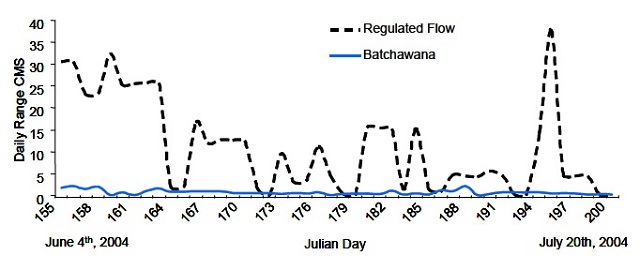
Figure 1. Daily range of flows (m3⋅s-1, CMS) in a natural and a regulated (peaking) river.
For general monitoring purposes the low flow channel is typically the focus and sampling is planned around low flow events. During high flows, the varial zone may be only the wadeable area; however, this zone will not provide a representative depiction of the benthic community and should be avoided. This can be determined from gauge information and/or by contacting the power authority as it is very difficult to assess in the field. Natural tributaries below dams will influence flow levels. Communicate with power authority so that sampling is done during periods of low flow (e.g., weekends) and such that repeated sampling events can take place at the same flow level.
A number of protocols for the assessment of river health are available but these typically involve the use of many wadeable reference streams and complex statistical analysis using addition environmental data (e.g., Environment Canada 2002, 2005, 2010; Rosenberg et al. 1997; Jones et al. 2004). Additionally, most of these protocols were developed to assess water quality issues rather than changes in habitat.
The applicability of the different protocols mention above depends on site conditions and whether specific biological responses or sentinel species are being investigated. One of the main deficiencies of these protocols is that they were developed primarily for wadeable streams, and hence, are less applicable for non-wadeable rivers. These protocols often do not quantify density or distribution patterns along a river which is important when investigating the impact of habitat changes (e.g., water level regulation in rivers and reservoirs following dam construction). The benthic sampling protocol discussed here provides a methodology which acknowledges that regulated rivers can have strong longitudinal and lateral gradients in the composition and abundance of benthos that must be considered when developing a sampling plan. A similar approach can be used in lakes and reservoirs (White et al. 2011).
2.0 Gear description
Basic equipment required for sampling include a GPS, measuring tape, velocity and depth meter, and a rangefinder. Ideally, photographs should be taken of each site and sites should be marked using flagging tape. This protocol uses a Surber net (Nitex 500 µm ) with a 12 x 12 inch (~30 x 30 cm) metal frame. This net is portable and easy to use.
Field crews should have all the necessary maps of the river systems to be sampled, including general sampling site locations, before going into the field. Prior to sampling, enough benthic sampling forms to record results while in the field should be prepared (see Appendix). Benthic invertebrate sampling forms can be printed or copied onto waterproof paper for working in inclement weather. The equipment list is intended for a two person sampling crew (Table 1). All equipment should be examined for condition and completeness before heading into the field.
Table 1. Equipment List for Benthic Sampling
| Item | Quantity |
|---|---|
| GPS (NAD 83 Datum) | 1 |
| Measuring tape | 1 |
| Data sheets, pencil, permanent marker, clipboard | As Required |
| Surber sampler 500 µm mesh net | 1 |
| Velocity and depth meter | 1 |
| Rangefinder | 1 |
| Digital camera | 1 |
| Spray paint (Fluorescent colours ideal) | As Required |
| 250 µm high-sided sieve | 1 |
| 1L squeeze wash bottles | 2 |
| Small white bucket or white tray 4” deep | 1 |
| Bottle of 10% buffered formalin (gloves) | 1 |
| Leak-proof wide mouth sample jars with screw-top lids | 3-6 per site |
| Parafilm | As Required |
3.0 Field procedures
Plan to sample the river during roughly the same time each year. More importantly, sample under similar water levels, ideally lowest flows, each year, particularly in regulated rivers. Record the discharge volume on the data sheet. To ensure water levels are consistent you will require cooperation from the hydro facility and weather. Comparing data from the same sites but from different times of the year or under different flows is not valid.
3.1 Site selection
In natural rivers sampling sites (n = 10) can be spaced equally along the length to the length of the river of zone of interest. In regulated rivers, unless otherwise directed, the first sample is collected immediately downstream of the dam or where safe to do so and where sampling methodology allows. The first five sampling sites are at 0, 250, 500, 1000, and 2000 m downstream from the dam. For sites 6-10, divide the remaining distance of the zone by five to establish spacing for the remaining sites. Allocating sites in this manner acknowledges the longitudinal gradients in abiotic and biotic variables, and that of the majority of change typically happens close to the dam (Ward and Stanford 1983). The exact location of sampling will depend on local conditions at the suggested site. Sometimes the site location chosen on a map will not be suitable for sampling (e.g. too deep, not accessible). In such cases, move either up or down to the nearest suitable habitat and record the new location.
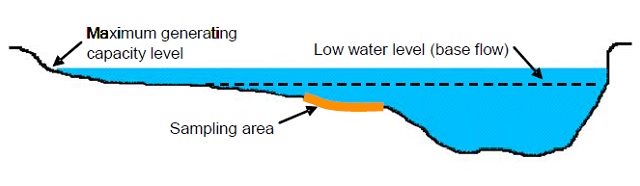
Figure 2. Cross-sectional depiction of a site at maximum and low flows. Sampling area of interest is shown in orange. See Figure 3 for an overhead view.
If the downstream boundary of the zone of influence is not known its location may be estimated based on where a large tributary enters the river or where the river enters a large lake. Lewis et al. (2004) suggests that the zone of influence extends to where the watershed area is greater than or equal to five times the watershed draining to the proposed waterpower site. In essence the dilution factor of Lewis et al. (2004) is four; one part regulated to four parts natural regime. Alternately, physical attributes such as thermal regime can be modelled to estimate the zone of influence.
For all sampling and observational efforts record the GPS coordinates (UTMs in North American Datum 83) at each site, date, and time for each sample. Sampling efforts must be repeatable. Failing to record accurate site and sample information will render data unusable. The site should also be flagged along the shoreline. Good sampling sites are typically C-type channels (Rosgen 1996) in rivers displaying a point bar, distinct riffles, and gravels with particle axes in the range of 2-64 mm (Figure 2).
3.2 Sampling invertebrates (rock wash)
- At each site collect 3-6 individual samples working in an upstream direction (Figure 3). Place the Surber perpendicular to the flow in water 20-30 cm deep during known low flow conditions. Stand to the side of the Surber. If there is little flow, orient the net such that it facilitates the collection of invertebrates by hand- pushing water through the net. Hold the frame squarely on the stream bottom as gaps between the frame and substrate will allow invertebrates to pass under the net. Be sure to check periodically to ensure there are no gaps.
- Work from the upstream edge of the sampling net backward and carefully pick-up and rub stones in the net so that any attached insects will drift into the net. Inspect each rock 10 cm or larger to ensure all insects have been dislodged and then set it outside the sampling area. If a rock is lodged in the stream bottom, rub it a few times concentrating on any cracks or indentations. After removing all large stones, disturb small substrates to a depth of approximately 10 cm by raking and stirring with your hands. Continue this process until you no longer see any invertebrates or organic matter being washed into the net. It should take approximately 3-5 minutes to complete one sample. Be consistent in your effort level across each sample and site.
- Wade carefully to shore without spilling the sample. In shallow water, hold the net vertically with the mouth up, and rinse any remaining material to the bottom of the net by vigorously splashing the outside of the net with river water. Empty net in the sorting tray.
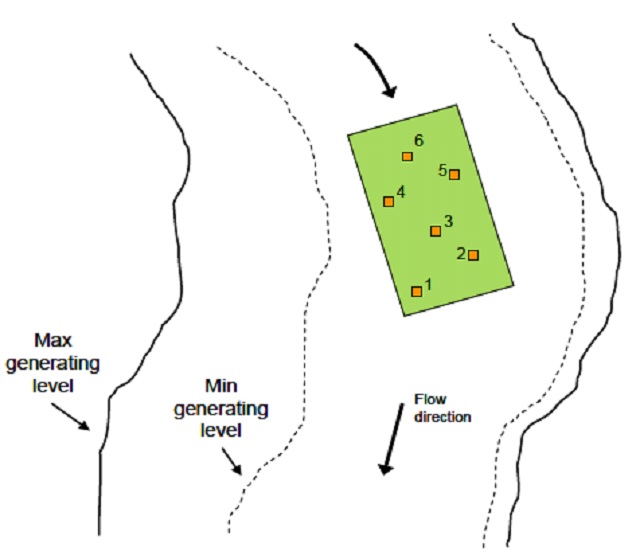
Figure 3. Overhead view of a site (green rectangle) and sampling locations (orange squares) in relation to maximum and minimum generating levels.
3.3 Emptying the net and filling the jar
Empty the contents of the net into a white deep-sided bucket or tray holding the sample in the bottom and inverting the net. Use a 1 L wash bottle (spout removed) to rinse any remaining sample into the tray. Rinse and remove any large rocks from the tray. Add water to the tray, swirl, and decant invertebrates and organic matter from the sample by pouring suspended sample into the 250 µm sieve. Repeat this process (5-20 times) until no additional organic matter can be decanted, i.e. , only sand and gravel is left in the tray. This is called elutriation. Examine the remaining sediment for clams, snails, and caddisfly cases made of stone particles which did not wash-out. Use a wash bottle to focus the sample into a corner of the sieve and into the jar. Add 10% buffered formalin solution to wash the sample into the jar. Every transfer of the sample should be done over a tray so that if any invertebrates are spilled they can be recovered.
3.4 Preserving samples and transport
The sample is preserved at a 1:3 ratio (formalin to sample) using 10% buffered formalin allowing the invertebrate bodies to remain firm for identification and preventing decomposition and the loss of pigment. To make a solution of 10% Formalin, mix nine parts of water to one part of 40% (aqueous) Formaldehyde. Therefore, a 10% solution of Formalin is the equivalent of a 4% solution of Formaldehyde. Formalin readily oxidizes into formic acid, an acidic solution in the pH 2.5 to 5 range. To prevent the dissolution of calcified tissue, Formalin solutions should be buffered. Calcium Carbonate (CaCO3) or Borax (Sodium Borate) in supersaturated solutions with Formalin are commonly used buffers for short-term formalin fixation. They should not be used to buffer Formalin solutions used for long-term storage because their effects do not last and Borax may cause lysis of tissue and clearing of pigments.
Cap jar, gently swirl the sample to distribute the formalin. Do not shake the jar as rocks in the sample will damage the organisms. If desired, wrap top of jars with parafilm. Samples should be transferred to ethanol shortly after 24 hrs after initial preservation or calcified structures will begin dissolving making identification difficult and costly. Use a mesh of 400 µm or less to filter out the formalin and replace with 70% ethanol. To reduce potential damage, it is best to use wide mouth PET 250-500 ml (Polyethylene Terephthalate) jars just large enough to contain the sample and the appropriate amount of ethanol (see System Plus for water sampling jars e.g. P250/US). Once preserved, samples will become brittle. You may wish to use foam between samples to reduce movement, especially when on rough roads.
3.5 Information to record
Use a flow meter to measure the current speed and water depth immediately beside each Surber sampling location. Also record substrate-particle-size class, see Table 2, and the presence/extent of algae for each sampling location. Use a laser rangefinder to measure the wetted width of the river at the site. Record discharge based on known gauges. Take photos of the site. Lastly, record any observations you make about water levels, temperature and weather conditions, vegetation, etc.
Table 2. Substrate classes based on the modified Wentworth scale.
| Substrate Class | Size Descriptor |
|---|---|
| Organic matter | Wood chips, leaves, dead branches |
| Clay and slit | < 0.0625 mm |
| Sand | 0.0625 – 2 mm |
| Gravel | 2 – 64 mm |
| Cobble | 64 – 256 mm |
| Boulder | > 256 mm |
| Bedrock | Impermeable, continuous rock |
4.0 Post-field procedures
4.1 Identifying and enumerating invertebrates
Identify benthic invertebrates to their families using appropriate keys or well-known diagnostic characters (e.g., see Pennak 1987; Merrit and Cummins 2008, McCafferty 1998). Process and enumerate the entire sample to the family or genus level. See Appendix for a List of Taxa common to Ontario. Carefully examine the sample for stoneflies and dragonflies because these taxa are known to be sensitive and of large size. Pay particular attention to Diptera (Chironominae and Orthocladiinae), Anisoptera, Coleoptera, Ephemeroptera, and Trichoptera. If sampling occurred downstream of a reservoir or lake, be sure to classify invertebrates by their origin (true riverine or lake derived). Many zooplankton and Chironomids can drift downstream from upstream lakes.
4.2 Filtering organic matter
If so desired, retain the organics remaining in the sample after invertebrates have been removed. This information can aid in data interpretation later as the biomass of benthic invertebrates in a sample is often related to the amount of coarse particulate organic matter (CPOM) in the sample. Filter (1 mm sieve) the organics and dry at 60°C. until a constant mass (mg) is achieved.
5.0 Safety and communication
5.1 Field safety
Benthic invertebrate sampling frequently takes place in remote locations and may require travel on roads that receive little maintenance. As such, the need for safety measures is intensified. A satellite phone is necessary in areas lacking cellular phone coverage and Citizen’s Band (CB) radios are required to coordinate traffic on logging roads. As an additional safety measure, government of Ontario employees may use the Provincial Communications Unit (PCU) to track their location and expected on and off water times.
Benthic invertebrate surveys often take place on rivers having deceptive and rapidly changing flows. Conditions can change abruptly, especially near hydro-electric dams. Contacting power generation authorities in advance to obtain information about changes in flow is highly recommended. Sampling should be delayed if severe weather conditions are expected. First-aid and safety equipment must be easily accessible and personal floatation devices must be worn as conditions dictate and whenever transportation by boat occurs. Safety of sampling crews must override all other activities and everyone participating in sampling must be aware of their rights and obligation according to the Occupational Health and Safety Act.
When river sampling, be sure to know where your put-in and take-out points are located including emergency exit points. Missing take-out points can be dangerous particularly if the ability to move upstream is limited.
5.2 Invasive species transfer
Although there is a low risk of transferring invasive species while sampling for benthic invertebrates, care must be taken not to transfer invasive flora and fauna. This may involve cleaning sampling nets, waders, and any other equipment used at the sampling location. Some options include chemical treatment (e.g., peroxide, Alconox) of gear, or high temperature steaming and drying. Another approach is to dedicate sampling gear to single sites, or to zones having similar benthic faunas. When boats are used, ensure they are drained (including bilge/live well), and that all vegetation is removed before moving to a new waterbody. Boat, motor, and trailer should be pressure-washed, and all gear should be left to dry between 48 and 96 hours in situations where the risk of contamination is high.
5.3 Species at Risk permits
A permit may be required under the provincial Endangered Species Act (ESA) or the federal Species at Risk Act (SARA), if the sampling locations are in areas where a listed species at risk may be captured. Species listed as Extirpated, Endangered or Threatened are protected under both the Endangered Species Act and Species at Risk Act. A list of species listed under the Endangered Species Act can be found at the and Schedule 1 species protected under SARA can be found at the Species at Risk Public Registry website. The local MNR and DFO district offices should be contacted, should there be a possibility of encountering a listed species. If the sampling activity is anticipated to cause an unacceptable level of harm to the population of a listed species, it is possible that a permit will not be issued and alternative sampling locations or methods may need to be selected.
6.0 Acknowledgments
Thanks to Chris Jones, Bohdan Bilyj, Mark Hulsman, Brianna Houston, and Sarah Hogg for their helpful comments and criticisms.
7.0 References
Armitage PD. 1978. Downstream changes in the composition, numbers and biomass of the bottom fauna in the Tees below Cow Green Reservoir and an unregulated tributary Maize beck in the first five years after impoundment. Hydrobiologia 58: 145156.
Environment Canada. 2002. Metal Mining Effluent Regulations (SOR/2002-222)
Environment Canada, 2005. Pulp and Paper Effluent Regulations (SOR/92-269) Environment Canada. 2010. Canadian Aquatic Biomonitoring Network: Wadeable Streams Field Manual. 52 pp
Fisher S.G. and LaVoy A. 1972. Differences in littoral fauna due to fluctuating water levels below a hydroelectric dam. Journal of the Fisheries Research Board of Canada 29:1472-1476. DOI 10.1139/f72-227
Jones, C., K.M. Somers, B. Craig, and T. Reynoldson. 2004. Ontario Benthos Biomonitoring Network Protocol Manual, Version 1.0. Ontario Ministry of Environment.
Jones, N.E. 2010. Incorporating lakes within the river discontinuum: longitudinal changes in ecological characteristics in stream-lake networks. Canadian Journal of Fisheries and Aquatic Sciences 67: 1350-1362.
Jones, N.E. 2011. Spatial Patterns of the Benthic Invertebrate Communities in Regulated and Natural Rivers. River Research and Applications DOI:10.1002/rra.1601
Lewis A, Hatfield T, Chilibeck B, Roberts C. 2005. Assessment methods for aquatic habitat and instream flow characteristics in support of applications to dam, divert, or extract water from streams in British Columbia. Ministry of Water, Land & Air Protection and Ministry of Sustainable Resource Management; 103. http://www.env.gov.bc.ca/wld/documents/bmp/assessment_methods_instreamflw_in_bc.pdf [link inactive] [22 November 2011].
Lorang, M.S., Stanford J.A., Hauer F.R., Jourdonnais JH. 1993. Dissipative and reflective beaches in a large lake and the physical effects of lake level regulation. Ocean and Coastal Management 19:1-25. DOI 10.1016/0964-5691(93)90045-Z
McCafferty, W.P. 1998. Aquatic Entomology: The Fishermen’s and Ecologists' Illustrated Guide to Insects and Their Relatives. Jones and Bartlett Publishers, Sudbury, Massachusetts.
Merritt, R.W. and K.W. Cummins, eds. 1996. An Introduction to the Aquatic Insects of North America, 3rd Ed. Kendall Hunt Publishing, Dubuque, Iowa.
Pennack, R. W. 1989. Freshwater Invertebrates of the US, 3rd Ed. John Wiley & Sons, New York, Richardson, J.S., and Mackay, R.J. 1991. Lake outlets and the distribution of filter feeders - an assessment of hypotheses. Oikos, 62(3): 370–380 DOI:10.2307/3545503.
Rosenberg, D.M., Davies, I.J., Cobb, D.G., and Wiens, A.P. 1997. Ecological Monitoring and Assessment Network (EMAN) Protocols for Measuring Biodiversity: Benthic Macroinvertebrates in Fresh Waters. Dept. of Fisheries & Oceans, Freshwater Institute, Winnipeg, Manitoba. 53, Appendices.
Rosgen, D.L. 1996. Applied River Morphology. Illus. H.L. Silvey. Wildland Hydrology Books, Fort Collins, Colorado.
Trotsky H.M., Gregory R.W. 1974. The effects of water flow manipulation below a hydroelectric power dam on the bottom fauna of the upper Kennebec River, Maine. Transactions of the American Fisheries Society 103:318-324. DOI:10.1577/15488659
Ward J.V., Stanford J.A. 1983. The serial discontinuity concept of lotic ecosystems. In Dynamics of Lotic Ecosystems. Edited by T.D. Fontaine and S.M. Bartell. Ann Arbor Science, Ann Arbor, Michigan, USA pp. 29-42.
White, M. S., Xenopoulos, M. A., Metcalfe, R. A., and Somers, K. M., 2011. Water level thresholds of benthic macroinvertebrate richness, structure and function of boreal lake stony littoral habitats. Can. J. Fish. Aquat. Sci. 68: 1695–1704.
Appendix: Benthic invertebrate sampling form
Benthic invertebrate sampling form
Benthos taxa list
Alderflies Megaloptera
Corydalidae
Sialidae
Beetles, Coleoptera
Carabidae
Curculionidae
Dryopidae
Dytiscidae
Elmidae
Gyrinidae
Haliplidae
Hydrophilidae
Psephenidae
Bugs, Hemiptera
Belostomatidae
Corixidae
Hebridae
Caddisflies, Trichoptera
Apataniidae
Brachycentridae
Dipseudopsidae
Glossosomatidae
Helicopsychidae
Hydropsychidae
Hydroptilidae
Lepidostomatidae
Leptoceridae
Limnephilidae
Molannidae
Philopotamidae
Odontoceridae
Phryganeidae
Polycentropodidae
Psychomyidae
Rhyacophilidae
Dragon Damselflies
Odonata
Anisoptera
Zygoptera
Aeshnidae
Calopterygidae
Coenagrionidae
Cordulegastridae
Corduliidae
Gomphidae
Lestidae
Mayflies Baetidae
Baetidae
Baetiscidae
Caenidae
Ephemerellidae
Ephemeridae
Heptageniidae
Isonychiidae
Leptophlebiidae
Leptohyphidae
Moths, Lepidoptera
Pyralidae
True Flies, Diptera
Athericidae
Ceratopogonidae, Midge
Chaoboridae
Chironomidae
Culicidae
Empididae
Enchytraeidae
Ephydridae
Muscidae
Psychodidae
Simuliidae, Blackflies
Stratiomyidae
Tabanidae, Horseflies
Tanyderidae
Tipulidae, Craneflies
Springtails, Collembola
Poduridae
Sminthuridae
Isotomidae
Crustaceans
Asellidae, Isopod
Bopyridae, Isopod
Cambaridae, Crayfish
Gammaridae, Amphipod
Hyalellidae, Amphipod
Haustoriidae, Amphipod
Molluscs
Ancylidae
Bithyniidae
Dreissenidae
Hydrobiidae
Physidae
Planorbidae
Sphaeriidae
Unionidae
Valvatidae
Viviparidae
Lymnaeidae
Pleuroceridae
Segmented Worms, Annelida
Oligochaeta
Naididae = Tubificidae
Tubificidae
Spionidae
Sparganophilidae
Sabellidae
Erpobdellidae
Glossiphoniidae
Piscicolidae
Stoneflies, Plecoptera
Capniidae
Chloroperlidae
Leuctridae
Perlidae
Perlodidae
Nemouridae
Pteronarcyidae
Taeniopterygidae
Horsehair Worms,
Nematomorpha
Gordiidae
Flatworms, Planaria
Planariidae
Horsehair Worms,
Nematomorpha
Gordiidae
Mites, Hydracarina
Hydrachnidae
Lebertiidae
Anisitsiellidae
Arrenuridae
Aturidae
Hydrodromidae
Hydryphantidae
Limnesiidae
Oxidae
Sperchontidae
Torrenticolidae
Pionidae
Unionicolidae
Hydrozetidae
Trhypachthoniidae
Hydra, Coelenterata
Flatworms, Turbellaria
Roundworms, Nematoda
Leech, Hirudinea
MNR 62761
ISBN 978-1-4435-8960-4 (PDF)
Footnotes
- footnote[1] Back to paragraph It is highly recommended that field crews carry back-up equipment.