Methodology summary for the AgriSuite greenhouse gas decision support tool
Learn about the AgriSuite greenhouse gas decision support tool to explore options for reducing greenhouse gas emissions from farms. This technical information is for Ontario farmers.
Disclaimer
The AgriSuite Greenhouse Gas Decision Support Tool was designed to encourage users to explore options for reducing greenhouse gas emissions from farms. The estimates of emission are approximate and may change noticeably as new scientific findings emerge. The Ministry of Agriculture, Food and Rural Affairs (OMAFRA) does not justify the reliability of this tool for uses other than education or exploration of possible practices.
This tool is designed for Ontario and uses Ontario-specific data, including:
- climate data
- soils data
- primary production methods
- manure test data
- crop data
- emissions factors
These data may not be applicable to jurisdictions outside Ontario. This tool is not intended to capture every input or export of the farm, nor is it intended as a life-cycle assessment or reporting and verification tool.
Introduction
In 2020, the Canadian agriculture sector contributed 8% of Canada’s total greenhouse gas (GHG) emissions and Ontario’s agriculture sector contributed 8% of Ontario’s total GHG emissions. Since 1990, emissions from the Canadian agriculture sector have increased by 34%, mainly due to increased use of inorganic nitrogen fertilizers, higher populations of swine and changes in weight, feed and manure handling practices in the beef, dairy and swine industries
To help agriculture producers in Ontario understand on-farm greenhouse gas emissions and identify best management practices (BMPs) which can reduce emissions and/or sequester carbon, OMAFRA developed the AgriSuite Greenhouse Gas (GHG) Decision Support Tool (tool).
This tool is designed to estimate GHG emissions from primary agriculture production in Ontario and raise awareness of BMPs which can reduce emissions and/or sequester carbon. Within the tool, these BMPs are called mitigation practices for their role in mitigating greenhouse gas emission.
The model behind the tool is intended to create a picture of a farm for 1 year and estimate the annual emissions associated with that farm for that year. The goal of the tool is to help farmers understand greenhouse gas emissions directly resulting from their farming practices and understand what steps they can take to reduce emissions and improve the greenhouse gas emissions balance of their farms.
This document summarizes the methodology behind the calculations for the tool. This technical information is intended for users of the tool, to explain the methods and assumptions behind the calculations at a high level and provide confidence that the results align with the latest available science. For full details, including the supporting equations and data tables, contact OMAFRA.
Greenhouse gases
The most important agricultural greenhouse gas sources are:
- methane (CH4)
- nitrous oxide (N2O)
- carbon dioxide (CO2)
CH4 in agriculture is primarily produced from livestock production systems through enteric fermentation and from anaerobic microbes in manure storage. N2O in agriculture is primarily produced from crop production systems through direct conversion of nitrogen in fertilizer and manure to N2O and indirect loss of nitrogen in fertilizer and manure through volatilization and leaching. CO2 in agriculture is primarily produced from soil carbon losses and fossil fuel burning.
In 2020, Ontario’s agriculture sector produced 34% of Ontario’s CH4 emissions and 69% of Ontario’s N2O emissions
| GHG | Description | GWP |
|---|---|---|
| N2O | 100-year GWP of N2O (kg CO2e (kg N2O)-1) | 265 |
| CH4 | 100-year GWP of CH4 (kg CO2e (kg CH4)-1) | 28 |
| CO2 | 100-year GWP of CO2 (kg CO2e (kg CO2)-1) | 1 |
System boundary
The tool is divided into 3 modules:
- livestock
- fields
- buildings (barns, greenhouses, grain dryers)
Each module calculates the annual greenhouse gas emissions directly related to those production systems.
The livestock module calculates:
- CH4 from enteric fermentation
- CH4 and N2O from manure storage
- CO2 from fuel used for manure spreading
The fields module calculates:
- N2O from fertilizer use
- CO2 from soil carbon change
- CO2 from fuel used for producing nitrogen fertilizer
- CO2 from fuel used for field work
The buildings module calculates:
- CO2 from fuel used for barn heating
- CO2 from fuel and electricity used for greenhouse heating and lighting
- CO2 from fuel and electricity used for grain drying
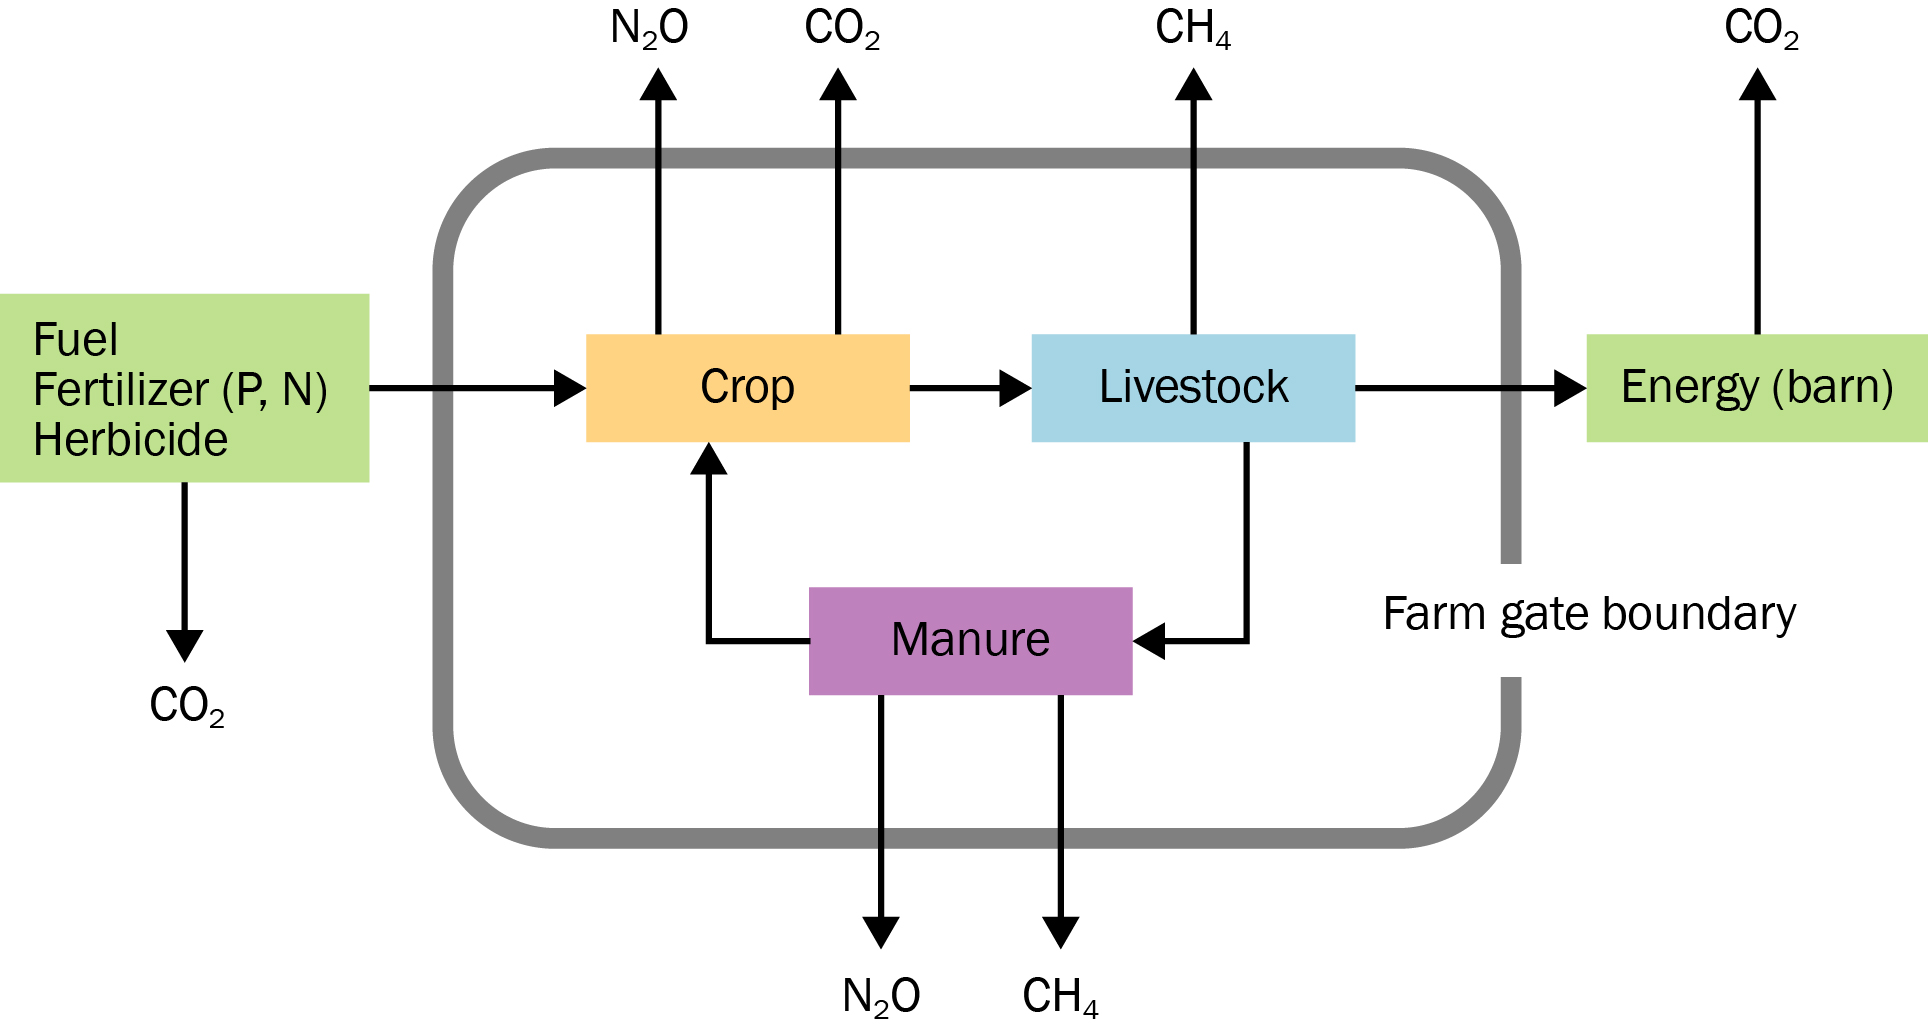
Figure 1 shows a farm gate boundary and highlights the specific GHGs which the AgriSuite tool can estimate. Other sources of emissions, such as production of inputs other than nitrogen fertilizer, transportation of inputs or products, feed ingredients, off-farm materials or supply chain emissions are not currently accounted for in the tool. Other GHGs such as hydrofluorocarbons, or other non-GHG emissions such as ammonia, are also not currently accounted for in the tool.
Methodology
The methodology to estimate greenhouse gas emissions from farming practices is complex and detailed. This document summarizes at a high-level the methodology used in each module.
Livestock
The livestock module calculates CH4 emissions from enteric fermentation, CH4 and N2O emissions from manure in storage and pasture-deposited manure and CO2 emissions from fuel used for land application of manure in storage. All emissions values are converted to tonnes of CO2 equivalent.
The methodology for the livestock calculations has been developed from the 2006 Intergovernmental Panel of Climate Change (IPCC) Guidelines for National Greenhouse Gas Inventories and the 2019 modifications to those guidelines. Canada- and Ontario-specific emissions modifiers and conversion factors, where available, have been taken from Canada’s National Inventory Report
Enteric CH4, manure CH4 and pasture manure N2O
The method to calculate enteric CH4 (produced by ruminant livestock digestion), manure CH4 (produced from stored manure) and pasture manure N2O (produced from pasture-deposited manure) varies depending on the type of livestock.
Dairy, beef and sheep
For cattle and sheep, enteric CH4 emissions are calculated by first estimating net energy requirements. For cattle, diet is inferred based on either milk production level (for dairy) or average daily gain (for beef). For sheep, diet is selected by the user directly. Diet and net energy requirements are used to calculate gross energy intake. Enteric CH4 emissions are directly calculated from gross energy intake
Volatile solids production rates are calculated from gross energy intake. CH4 emissions from manure are calculated from volatile solids, factoring in the type of manure (solid or liquid), storage type and presence of crust
For pasture-deposited manure, nitrogen excretion rates are estimated based on protein intake and protein retention of each livestock type. N2O emissions are estimated based on direct and indirect (leaching and volatilization) emission fractions and emissions factors for pasture
Swine, poultry and other livestock
Fixed values for volatile solids production and nitrogen excretion rates from swine, poultry, and other livestock are used. These values are dependent on the type, weight and production stage of livestock
N2O from stored manure
For stored manure, nitrogen content is taken from the AgriSuite manure databank which contains data for over 12,000 individual samples of manure for various livestock types, taken in Ontario
Direct and indirect (leaching and volatilization) emissions are calculated from the nitrogen content in the stored manure
CO2 from land application of manure
For stored manure, fuel-based emissions from spreading of manure are calculated based on the volume of manure to be spread, and fixed conversion values for energy use per cubic metre of manure and emissions rate per gigajoule of diesel fuel
There are no fuel-based emissions associated with pasture manure.
Mitigation practices
The tool incorporates several mitigation practices for livestock production systems which can reduce emissions. Further details on each practice, method of action and estimated emissions reductions are provided in Table 2.
| Mitigation practice | Method of action | Estimated reduction |
|---|---|---|
| Pasturing animals | Reduced manure going into storage, reduced emissions from stored manure | Varies depending on livestock type, diet, manure type (liquid or solid) |
| Diet optimization to reduce CH4 emissions | Increased feed efficiency, reduced waste resulting in reduced CH4 emissions | 10% reduction in enteric CH4 emissions |
Feed additives (dairy and beef):
| Reduced enteric CH4 production. | 5 to 15% reduction in enteric CH4 emissions for 2 to 4% fat; 15% reduction for 3-NOP, which reduces enteric CH4 formation in ruminants |
| Anaerobic digestion of liquid manure | Reduced volatile solids, removal of CH4 | 60% reduction in volatile solids and CH4 emissions from stored manure |
| Solid-liquid separation of liquid manure | Reduces the volume of manure stored as liquid, solid manure has lower CH4 emissions | 15% liquid volatile solids converted to solid fraction for swine
50% liquid volatile solids converted to solid fraction for dairy, beef, and other livestock |
| Acidification of liquid manure | Reduced pH inhibits the methanogens and reduces CH4 emissions | 40% reduction in CH4 emissions from stored manure |
| Covering liquid manure with thick straw cover | Increased surface resistance and aerobic biological activity to prevent CH4 escape | 15% reduction in CH4 emissions from stored manure |
| Frequent emptying of liquid manure pit | Reduced overall stored volume and reduced stored volume over summer contribute to reduced CH4 production | 25% reduction in CH4 Conversion Factor for spring or summer emptying; 39% reduction for spring and fall combined |
| Composting of solid manure | Aerobic composting reduces methanogens and CH4 emissions | Varies depending on CH4 Conversion Factor, Volatilization and Leaching fractions and Emissions Factors for base livestock type |
Key assumptions
The following assumptions are used in the AgriSuite GHG calculator when estimating livestock emissions:
- Animals in pasture for a portion of the year are outside during the warmer months of the year, centred around the summer.
- All cows and ewes are pregnant.
- Pregnancy twinning rate for sheep is based on current lamb-to-ewe ratio (assumed static).
- All mature dairy cows and ewes are lactating.
- For cows, 5 kg of protein is retained for every pregnancy.
- Feed intake is equal to energy requirements.
- All feed is used. Waste feed emissions are not accounted for.
- Diet additives for cows, if used, are added to both lactation and dry diets.
- Milk production is constant throughout year and there is one milk production cycle per year.
- Dairy calves are milk-fed only and there are no enteric emissions from dairy calves.
- Beef calf emissions are calculated as part of brood cows. Beef calf-cow ratio is assumed to be 0.87. Dairy calf-cow ratio is assumed to be 1.0.
- There are no emissions from nursing lambs.
- Emissions from bedding are not calculated.
- Liquid manure from swine, dairy with sand bedding, and under-barn storages have no natural crust. Other liquid manure types form natural crust.
- Solid/liquid separator will take liquid manure, reduce volume and Volatile Solids (VS) percentage of the liquid fraction, and generate solid manure which is stored in the solid manure section.
- The sex ratio of feedlot animals (whether sheep or cattle) is assumed 1:1.
- All barn manure is handled in one system (separated into liquid and solid, if applicable) and land-applied yearly.
- For liquid manure storages, standard depth for estimating volume and rainfall entry is 3.3 m (10 ft).
- Solid manure storages which are covered or have a runoff containment system have no leaching losses. Liquid manure storages have no leaching losses.
Fields
The fields module calculates:
- net carbon gains (sequestration) or losses (emissions) due to soil carbon changes
- direct and indirect N2O emissions from fertilizer, manure and crop residues
- CO2 emissions from fuel used for field work
- carbon storage in tree plantings
The methodology for the livestock calculations has been developed from the 2006 IPCC Guidelines for National Greenhouse Gas Inventories
Soil carbon change
The soil carbon methodology largely follows the algorithm developed by AAFC for their Holos tool, version 2.0
For the purposes of determining a change in practice, the baseline is intensive tillage (plough) with no perennial crops and no manure application.
The model relies on an annual calculation approach using a single tillage intensity
- No-Till if every crop year is No-Till and/or Permanent Cover
- Intensive if every crop year is Plough
- Reduced for any other combination of tillage practices
For rotations which include perennial crops, the fraction of years of perennial crops compared to the total years in the crop rotation is used to produce the average annual carbon increase for perennial crops over the entire rotation.
Carbon addition from manure application uses the carbon-nitrogen ratio from the AgriSuite material databank and applies a manure-induced carbon retention coefficient
N2O from fertilizer and manure application
The N2O from fertilizer emissions methodology follows the method outlined in National Inventory Report (NIR) 2022
Nitrogen from crop residues is calculated from crop type and yield. Mineralized nitrogen is calculated based on soil carbon change: a net loss in soil carbon equates to a net increase in mineralized nitrogen. However, a net gain in soil carbon results in no net mineralized nitrogen rather than a negative value.
Direct and indirect emissions for crop input nitrogen, crop residue nitrogen, mineralized nitrogen and manure nitrogen are calculated using nitrogen inputs and multiplying by location-specific emissions factors and ratio factors for soil texture, tillage method, nitrogen type, cropping system and irrigation (if used)
CO2 from field work
Fuel use for each crop is calculated based on the associated energy use for the type of crop and tillage practice. Fixed conversion values for emissions rate per gigajoule of energy from diesel fuel are used to calculate CO2 emissions.
Fuel used for manure application is calculated in the livestock section.
Mitigation practices
The tool incorporates several mitigation practices for crop and field-based production systems which can reduce emissions and/or sequester carbon. Further details on each practice, method of action and estimated emissions reductions are provided in Table 3.
| Mitigation practice | Method of action | Estimated reduction |
|---|---|---|
| Reduced tillage and tillage method changes | Increases carbon storage in soils, reduces fuel use and energy emissions | Varies depending on soil texture, tillage type |
| Nitrogen fertilizer reduction by 10%, 15% or 20% | Decreases emissions through directly reducing fertilizer application and/or adopting practices which increase nitrogen use efficiency | Reduces input fertilizer rate by 10-20%. Emissions reduction will vary depending on soil types, baseline fertilizer rates, incorporation practices, crop type, and more |
| Use of nitrification and urease inhibitors | Reduces leaching and volatilization losses of nitrogen | 25% reduction in direct and indirect N2O emissions |
| Fertilizer application incorporation | Reduces volatilization loss of nitrogen | Volatilization losses reduced by 45% |
| Material (manure) application incorporation | Reduces volatilization loss of nitrogen | Varies depending on length of time before incorporation and/or field condition at time of application |
| Cover crops | Increases carbon storage in soils, reduces fertilizer demand, reduces direct and indirect nitrogen emissions | Varies according to crop type and cover crop growth
|
Tree planting:
| Stores carbon in tree biomass | Soil carbon storage of 3.3 to 5.5 mg carbon per hectare of trees planted; assumes 40 years to tree maturity. Deciduous species store 20% less carbon and coniferous store 25% more carbon compared to mixed species |
Key assumptions
The following assumptions are used in the AgriSuite GHG calculator for the purposes of estimating emissions from fields and crops:
- The past and present farm area is assumed to be constant, except when tree planting replaces cropland.
- If perennial croplands are present, past perennial crop area is assumed to be zero.
- Crop residue emissions are allotted to the farm of residue origin.
- Emissions are calculated based on the most common soil texture in the field.
- The farm utilizes only one type of tillage. For the purposes of determining tillage impacts, tillage is defined as follows:
- No-till is defined as no tillage at any point in the rotation except at seeding (defined as No-till or Permanent cover in AgriSuite).
- Reduced tillage is defined as one or few tillage passes with most residue retained on the surface (defined as one of either zone till, ridge till or mulch till in AgriSuite).
- Intensive tillage is defined as complete burial of residue (defined as Plough in AgriSuite).
- For a crop rotation encompassing multiple years with different tillage practices in different years, the average tillage intensity across the entire rotation is defined as follows:
- No-Till if every crop year is No-Till and/or Permanent Cover
- Intensive if every crop year is Plough
- Reduced for any other combination of tillage practices
- Emissions from biological nitrogen fixation are negligible. The N2O emissions from decay of residues containing biologically-fixed nitrogen, however, are included.
- Emissions from mineralized nitrogen are distributed equally among the cropped land area.
- Carbon sequestration from annual crop production is 0.
- Net CH4 exchange to and from soils is 0.
- Tree planting:
- Estimates include carbon stored as tree biomass and soil organic carbon (SOC) gain.
- Biomass values are averaged over entire tree lifespan to estimate average carbon change per year.
- Trees reach full maturity and biomass in 40 years.
- Even distribution of trees across planted area.
- Approximate density of tree plantings is 1500–2000 trees per ha.
- Default shelterbelt width is 3 m per row.
Buildings
The buildings module calculates energy-related emissions in the form of CO2 from fuel combustion and/or electricity use for building heating, lighting and other select equipment. Buildings included are livestock barns, greenhouses and grain dryers.
The methodology for energy calculations for heating and ventilation loads from plant and livestock production facilities and for energy calculations from grain dryers has been developed using the American Society of Heating, Refrigeration and Air Conditioning Engineers (ASHRAE) Handbooks and the American Society of Agricultural and Biological Engineers (ASABE) Standards. Canada-specific emissions factors for various fuels have been taken from NIR 2022
Barns
The barn component focuses on energy use and associated emissions for heating of livestock production facilities. Calculations are completed monthly based on average weather data and summed to estimate annual energy use patterns. Ventilation loads are calculated. However, associated electricity use is not estimated at this time. Electricity for lighting and other equipment is not estimated at this time.
Moisture, heat and CO2 production from livestock is estimated by livestock type and size
Heat transfer through the building envelope, and thermal properties of materials and insulation, are calculated in accordance with ASHRAE procedures and data
Ventilation rates are based on the maximum ventilation required to control barn temperature, barn humidity and barn CO2 levels
Greenhouses
The greenhouse component focuses on energy use and associated emissions for heating and lighting of greenhouse crop production facilities. Calculations are completed monthly based on average weather data and summed to estimate annual energy use patterns. Solar gains and electricity use for lighting (if used) are estimated in the tool. Ventilation requirements are calculated based on heat gains from solar and lighting, and moisture gains from crop evapotranspiration. However, associated electricity use is not estimated at this time. Electricity requirements for other equipment are not estimated at this time.
Solar gains for heating are calculated in accordance with ASHRAE procedures and daily light integrals are determined for plant lighting requirements
Heat transfer through the building envelope, and thermal properties of materials and insulation, are calculated in accordance with ASHRAE procedures and data
Grain dryers
The grain dryer component focuses on energy use and associated emissions for heating and electricity to operate grain dryers. Calculations are completed based on excess water elimination and energy requirements
Mitigation practices
The tool incorporates several mitigation practices for buildings which can reduce CO2 emissions. Some practices are dependent on the building type and some apply to multiple building types. Further details on each practice, method of action and estimated emissions reductions are provided in Table 4.
| Mitigation practice | Method of action | Estimated reduction |
|---|---|---|
| Replace wall and/or roof materials (barns and greenhouses) | Increased insulation to reduce heat loss | Varies depending on level of insulation and (for greenhouses) light transmittance |
| Replace wall and/or roof curtains (greenhouses) | Increased insulation during night-time hours to reduce heat loss | Varies depending on type(s) of curtains |
| Update lighting systems (greenhouses) | Reduced electricity use using increased efficiency lights and/or improved controls | Varies depending on lighting choice and control type |
| Destratification systems (barns) | Reduced thermal stratification, reduced excess heating | Thermal stratification reduced by 64-73% depending on strategy. Heating reduction varies depending on barn temperatures, insulation materials |
| Ventilation heat exchangers (barns) | Recovery of heat from exhaust air | 30 to 70% recovery of heat and associated reduction in heating system energy |
| Replace heating system (barns and greenhouses) | Improved efficiency with newer heating equipment | Varies depending on existing system and choice of new equipment; reductions up to 30% are possible |
| Electric heating system (barns and greenhouses) | Improved efficiency and reduced emissions from fuel switching | Varies depending on existing system. Heat pumps can be up to 300% more efficient than conventional heaters |
| Alternate fuel type (barns, greenhouses, grain dryers) | Reduced emission from fuel switching to renewable biomass-type fuels | Renewable fuels are treated as zero carbon emissions since carbon can be rapidly cycled back to new biomass growth |
| Burner optimization (grain dryers) | Improved fuel-to-air ratio for cleaner burning, reduced fuel use | Up to 10% reduction in fuel use |
| Heat recovery system (grain dryers) | Recapture pre-heated air and recycle through dryer, reduce wasted heat | Up to 15% reduction in fuel use |
| Dryer replacement (grain dryers) | Replace grain dryer with more efficient system
Suction cooling can be added to pre-heat incoming air through grain cooling section | Reduction varies depending on dryer type
Dryers with suction cooling can achieve up to additional 10% reduction |
Delayed cooling (grain dryers):
| High-temperature dryer to remove most excess moisture Residual heat in grain and/or low temperature drying to remove final excess moisture | Varies depending on grain type, dryer type, moisture setpoints |
Key assumptions
The following assumptions are used in the AgriSuite GHG tool for the purpose of estimating energy use emission from buildings:
- Systems are steady state.
- Buildings are assumed to be rectangular.
- 4:12 roof pitch assumed for barns; 6:12 roof pitch assumed for greenhouses.
- Monthly average 30-year climate data (temperature minimums and maximums, humidity) is representative of current Ontario climate conditions.
- Monthly average climate data accounts for the variability of climate throughout the month.
- Buildings (barns, greenhouses) are treated as 1 single room.
- Insulative properties of wall insulation (barns), glazing and curtains (greenhouses) do not vary with temperature.
- Floor temperature is assumed equal to building temperature at 1 m above floor.
- Thermal stratification is linear.
- Solar gains ignored for barns.
- For greenhouses, division of day and night-time is based on solar day length. Solar gains only present during daytime.
- Solar gains for the 21st of the month are representative for the entire month
footnote 29 . - Greenhouse curtains are used only during nighttime hours to retain heat. Daytime use for light exclusion is not modeled.
- Heat loss through floor is negligible. However, heat loss through foundation walls is modeled.
- Ground temperature is assumed to vary linearly through the year in accordance with ASHRAE 2017 Chapter 18
footnote 28 . - For greenhouses, heating system operation for the purpose of CO2 production is not modeled.
- Grain drying is steady state. Moisture variability is not accounted for.
- Drying efficiency does not vary with outdoor temperature.
- Dryeration uses 40 CFM of airflow per tonne of grain for 24 hours, with fan power of 1 kW per 1000 CFM airflow.
- Dryeration reclaims ⅔ of theoretical residual heat in grain.
Uncertainties
There can be significant uncertainties when estimating greenhouse gas emissions. Many of the processes generating greenhouse gases are biological (such as enteric fermentation, manure decomposition, nutrient uptake by plants) and may be affected by localized climate and weather, soil conditions, animal health, genetics, and many other factors. In addition, the tool assumes these systems are steady state for the purposes of calculation, however in reality these systems are dynamic and can have large variations which influence actual emissions.
Since it is impossible to account for every contingency, estimates of uncertainty ranges are provided in Table 5 for various greenhouse gases. These uncertainty levels can vary significantly. Table 5 provides relative levels of uncertainty between the various emissions sources for awareness. More precise values for uncertainty can be found in the NIR
| Emission source | GHG | Uncertainty |
|---|---|---|
| Soils – direct | N2O | High |
| Manure – direct | N2O | Medium |
| Soils and manure – indirect | N2O | Very high |
| Enteric | CH4 | Low |
| Manure | CH4 | Low |
| Soils | CO2 | Medium |
| Energy use | CO2 | Medium |
| Lineal tree planting | CO2 | Low |
Contact us
For more details about the methodology used in the tool, or to request the full series of equations and reference list used in the tool, contact:
Amadou Thiam, P. Eng.
Engineering specialist, air quality
OMAFRA
James Dyck, P. Eng.
Engineering specialist, crop systems and environment
OMAFRA
Footnotes
- footnote[1] Back to paragraph NIR 2022. National Inventory Report 1990-2020: Greenhouse Gas Sources and Sinks in Canada. Cat. No.: En81-4E-PDF. Prepared by the Pollutant Inventories and Reporting Division (PIRD) of Environment and Climate Change Canada, Gatineau, Canada. (Accessed: May 5, 2022).
- footnote[2] Back to paragraph Myhre, G., D. Shindell, F.-M. Bréon, W. Collins, J. Fuglestvedt, J. Huang, D. Koch, J.-F. Lamarque, D. Lee, B. Mendoza, T. Nakajima, A. Robock, G. Stephens, T. Takemura and H. Zhang. 2013. Anthropogenic and Natural Radiative Forcing. In: Climate Change 2013: The Physical Science Basis. Contribution of Working Group I to the Fifth Assessment Report of the Intergovernmental Panel on Climate Change [Stocker, T.F., D. Qin, G.-K. Plattner, M. Tignor, S.K. Allen, J. Boschung, A. Nauels, Y. Xia, V. Bex and P.M. Midgley (eds.)]. Cambridge University Press, Cambridge, United Kingdom and New York, NY, (Retrieved: March 4, 2022)
- footnote[3] Back to paragraph Little, S., K. Beauchemin, H. Janzen, R. Kroebel and K. Maclean. 2013. Holos: A tool to estimate and reduce greenhouse gases from farms – Methodology & Algorithms for Version 2.0. Agriculture and Agri-Food Canada. 104 pp.
- footnote[4] Back to paragraph IPCC 2019. 2019 Refinement to the 2006 IPCC Guidelines for National Greenhouse Gas Inventories. Volume 4. Agriculture, Forestry and Other Land use. Calvo Buendia, E., Tanabe, K., Kranjc, A., Baasansuren, J., Fukuda, M., Ngarize S., Osako, A., Pyrozhenko, Y., Shermanau, P. and Federici, S. (eds). Published: IPCC, Switzerland. (Accessed: May 5, 2022).
- footnote[5] Back to paragraph Brown, C. 2021. Available nutrients and value for manure from various livestock types. Order no. 21-077. AgDex 538. ISSN 1198-712X. Ministry of Agriculture, Food and Rural Affairs: Guelph, ON. 10pp.
- footnote[6] Back to paragraph Viresco Solutions. 2015. Summary Report – Dairy AGGP Science Coordination and Implementation Workshop. Ottawa, April 16-17, 2015. 23pp.
- footnote[7] Back to paragraph Chastain, J.P., W.D. Lucas, J.E. Albrecht, J.C. Pardue, J. Adams III and K.P. Moore. 2001. Removal of solids and major plant nutrients from swine manure using a screw press separator. Applied Engineering in Agriculture 17 (3): 355-363. https://doi.org/10.13031/2013.6209
- footnote[8] Back to paragraph Wightman, J., P.B. Woodbury, C. Gooch and P. Wright. 2017. Dairy Manure Storage & Greenhouse Gas Mitigation Opportunities. Information Sheet 2. Cornell University, New York, . (Retrieved: March 29, 2022).
- footnote[9] Back to paragraph Sokolov V., A. VanderZaag, J. Habtewold, K. Dunfield, T.J. Tambong, C. Wagner-Riddle, J.J. Venkiteswaran and R. Gordon. 2020. Acidification of Residual Manure in Liquid Dairy Manure Storages and Its Effect on Greenhouse Gas Emissions. Front. Sustain. Food Syst. 4:568648. https://doi.org/10.3389/fsufs.2020.568648
- footnote[10] Back to paragraph VanderZaag, A., R. Gordon, R. Jamieson, D. Burton and G. Stratton. 2008. Straw Covers to Reduce Gas Emissions from Liquid Dairy Manure Storage. ASABE Paper no. 083606. Providence, Rhode Island, June 29 – July 2, 2008. https://doi.org/10.13031/2013.24950
- footnote[11] Back to paragraph Hung, C.-Y., A. VanderZaag, W. Smith, and B. Grant. 2022a. Evaluating the 2019 IPCC refinement for estimating methane conversion factors in Canada. Science of the Total Environment (2022). https://doi.org/10.1016/j.scitotenv.2022.155325
- footnote[12] Back to paragraph Hung, C.-Y., A. VanderZaag, W. Smith, and B. Grant. 2022b. Methane Conversion Factor (MCF) Calculator. (Accessed: May 5, 2022).
- footnote[13] Back to paragraph IPCC 2006. 2006 IPCC Guidelines for National Greenhouse Gas Inventories. Volume 4. Agriculture, Forestry and Other Land Use. Prepared by the National Greenhouse Gas Inventories Programme, H.S. Eggleston, L. Buendia, K. Miwa, T. Ngara and K. Tanabe. (Eds). IGES, Japan. (Accessed: March 11, 2022).
- footnote[14] Back to paragraph McConkey, B.G., D.A. Angers, M. Bentham, M. Boehm, T. Brierley, D. Cerkowniak, C. Liang, P. Collas, H. de Gooijer, R. Desjardins, S. Gameda, B. Grant, E. Huffman, J. Hutchinson, L. Hill, P. Krug, T. Martin, G. Patterson, P. Rochette, W. Smith, B. VandenBygaart, X. Vergé, and D. Worth. 2007. Canadian Agricultural Greenhouse Gas Monitoring Accounting and Reporting System: Methodology and greenhouse gas estimates for agricultural land in the LULUCF sector for NIR 2006. Agriculture and Agri-Food Canada, Ottawa, Canada.
- footnote[15] Back to paragraph Liang, C., X. Hao, J. Schoenau, B-L. Ma, T. Zhang, J.D. MacDonald, M. Chantigny, M. Dyck, W.N. Smith, S.S. Malhi, A. Thiagarajan, J. Lafond and D. Angers. 2021. Manure-induced carbon retention measured from long-term field studies in Canada. Agriculture, Ecosystems and Environment 321 (2021): 107619. https://doi.org/10.1016/j.agee.2021.107619
- footnote[16] Back to paragraph Liang, C., D. MacDonald, A. Thiagarajan, C. Flemming, D. Cerkowniak and R. Desjardins. 2020. Developing a country specific method for estimating nitrous oxide emissions from agricultural soils in Canada. Nutrient Cycling in Agroecosystems 117 (2020): 145-167. https://doi.org/10.1007/s10705-020-10058-w
- footnote[17] Back to paragraph Drever, C.R., S.C. Cook-Patton, F. Akhter, P.H. Badiou, G.L. Chmura, S.J. Davidson, R.L. Desjardins, A. Dyk, J.E. Fargione, M. Fellows, B. Filewood, M. Hessing-Lewis, S. Jayasundara, W.S. Keeton, T. Kroeger, T.J. Lark, E. Le, S.M. Leavitt, M. LeClerc, T.C. Lemprière, J. Metsaranta, B. McConkey, E. Neilson, G. Peterson St. Laurent, D. Puric-Mladenovic, S. Rodrigue, R.Y. Soolanayakanahally, S.A. Spawn, M. Strack, C. Smyth, N. Thevathasan, M. Voicu, C. A. Williams, P.B. Woodbury, D.E. Worth, Z. Xu, S. Yeo and W.A. Kurz. 2021. Natural Climate Solutions for Canada. Science Advances 7: eabd6034. http://dx.doi.org/10.1126/sciadv.abd6034
- footnote[18] Back to paragraph Fertilizer Canada. 2019. 4R Practices Guidance Document. 24pp. (Accessed: October 19, 2022).
- footnote[19] Back to paragraph Abalos, D., S. Jeffert, C.F. Drury and C. Wagner-Riddle. 2016. Improving fertilizer management in the and Canada for N2O mitigation: Understanding potential positive and negative side-effects on corn yields. Agriculture, Ecosystems and Environment 221 (2016): 214-221. https://doi.org/10.1016/j.agee.2016.01.044
- footnote[20] Back to paragraph Yanni, S., P. Rajsic, C. Wagner-Riddle, and A. Weersink. 2018. A Review of the Efficacy and Cost-Effectiveness of On-Farm BMPs for Mitigating Soil-Related GHG Emissions. Prepared by the University of Guelph, Guelph, Ontario, Canada for the Ministry of Agriculture, Food and Rural Affairs. Technical report. 108pp.
- footnote[21] Back to paragraph Bouwman, A. F., L.J.M. Boumans, and N.H. Batjes. 2002. Estimation of global NH3 volatilization loss from synthetic fertilizers and animal manure applied to arable lands and grasslands. Global Biogeochem. Cycles, 16(2): 8-1 – 8-14, https://doi.org/10.1029/2000GB001389
- footnote[22] Back to paragraph Brown, C., J. Follings, M. Moran and B. Rosser (Eds.). 2017. Agronomy Guide for Field Crops. Publication 811: Agronomy Guide for Field Crops. Ministry of Agriculture, Food and Rural Affairs. Queen’s Printer for Ontario: Toronto, Canada. 458pp. (Accessed: June 14, 2022).
- footnote[23] Back to paragraph COMET Planner Tool: Carbon and greenhouse gas evaluation for NRCS conservation practice planning. Version 2.1. August 2022. (Accessed: May 5, 2022).
- footnote[24] Back to paragraph Swan, A., M. Easter, A. Chambers, K. Brown, S.A. Williams, J. Creque, J. Wick and K. Paustian. 2020. COMET Planner: Carbon and greenhouse gas evaluation for NRCS conservation practice planning: A companion report to www.comet-planner.com. 144pp. (Accessed: May 5, 2022).
- footnote[25] Back to paragraph Robertson, A., R. Chambers, H. House and D. Ward (eds.). 2010. Publication 833: Ventilation for Livestock and Poultry Barns. Guelph, ON: Ontario Ministry of Agriculture Food and Rural Affairs. 270pp. (Accessed: July 14, 2022)
- footnote[26] Back to paragraph Huffman, H. 1999. Fan Ventilation Analysis. Version 3.0. Guelph, ON: Ministry of Agriculture, Food and Rural Affairs. 114pp.
- footnote[27] Back to paragraph ASHRAE 2019. ASHRAE Handbook – HVAC Applications (SI Edition). Atlanta, GA: ASHRAE.
- footnote[28] Back to paragraph ASHRAE 2017. ASHRAE Handbook – Fundamentals (SI Edition). Atlanta, GA: ASHRAE.
- footnote[29] Back to paragraph ASHRAE 2005. ASHRAE Handbook – Fundamentals (SI Edition). Atlanta, GA: ASHRAE.
- footnote[30] Back to paragraph Faust, J. E., and J. Logan. 2018. Daily Light Integral: A Research Review and High-resolution Maps of the United States. HortScience 53(9): 1250-1257. https://doi.org/10.21273/HORTSCI13144-18
- footnote[31] Back to paragraph SunTracker Technologies. 2019. DLI Calculator [Online Tool]. Version 2.1. (Accessed: June 21, 2022).
- footnote[32] Back to paragraph ASABE 2021. Moisture Relationships of Plant-Based Agricultural Products. ASAE D245.7 June 2021. St. Joseph, MI: ASABE. (Accessed: July 13, 2022).
- footnote[33] Back to paragraph ASABE 2003. Thermal Properties of Grain and Grain Products. ASAE D243.4 May 2003. St. Joseph, MI: ASABE. (Accessed: July 13, 2022).
- footnote[34] Back to paragraph Loewer, O.J., T.C. Bridges and R.A. Bucklin. 1994. On-Farm Drying and Storage Systems. ASAE Publication 9. American Society of Agricultural Engineers.
- footnote[35] Back to paragraph Wageningen University & Research Greenhouse Horticulture. 2018. Radiation Monitor. [Online Tool] Version: November 2018. (Accessed: May 31, 2022).
- footnote[36] Back to paragraph Wageningen University & Research Greenhouse Horticulture 2016. Help document on the Radiation Monitor. (Accessed: May 31, 2022).
- footnote[37] Back to paragraph De Zwart, F. 2016. Radiation Monitor. Presented at GreenTech 2016: Amsterdam, Netherlands. (Accessed: May 31, 2022).
- footnote[38] Back to paragraph Kim, H.-W., G.-C. Kang, J.-P. Moon, T.-S. Lee and S.-S. Oh. 2018. Estimation of Thermal Performance and Heat Loss in Plastic Greenhouses with and without Thermal Curtains. Energies 2018, 11(3), 578.
- footnote[39] Back to paragraph Runkle, E. and R. Lopez. 2022. Making Sense of Lighting During Propagation (webinar). Controlled Environment Agriculture Webinar Series. Presented by Ministry of Agriculture, Food and Rural Affairs and Michigan State University. February 24. (Accessed: November 9, 2022).
- footnote[40] Back to paragraph Shelford, T.J. and A.J. Both. 2021. On the Technical Performance Characteristics of Horticultural Lamps. AgriEngineering 2021 (3): 716–727.
- footnote[41] Back to paragraph Beadle, S. 2022. Ministry of Agriculture, Food and Rural Affairs. June 7. (Personal communication).
- footnote[42] Back to paragraph Bottcher, R.W., G.R. Baughman & L.B. Driggers. 1988. Temperature Stratification in Broiler Houses and the Effects of Ceiling Fans. Applied Engineering in Agriculture 4 (1): 66-71. https://doi.org/10.13031/2013.26582
- footnote[43] Back to paragraph Boon, C.R. & V.A. Battams. 1988. Air Mixing Fans in a Broiler Building – Their Use and Efficiency. J. Agric. Eng. Res. 39 (2): 137-147. https://doi.org/10.1016/0021-8634(88)90136-9
- footnote[44] Back to paragraph Han, Y., Z. Li and P. Xu. 2014. Comparative Study on Energy Consumption of Gas-Fired Infrared Radiant and Convection Heating. Advanced Materials Research 953-954 (2014): 849-853. https://doi.org/10.4028/www.scientific.net/AMR.953-954.849
- footnote[45] Back to paragraph SpaceRay. 2013. Infrared Heating Engineering Manual and Application Information. 75pp. (Accessed: May 16, 2022).
- footnote[46] Back to paragraph Sanford, S. 2011. Greenhouse Unit Heaters: Types, Placement and Efficiency (A3907-02). University of Wisconsin Extension – Cooperative Extension: Madison, WI. 6pp. (Accessed: May 16, 2022).
- footnote[47] Back to paragraph Natural Resources Canada. 2021. Heating and Cooling with a Heat Pump. February 11. (Accessed: July 5, 2022).
- footnote[48] Back to paragraph Thibault, L. 2020. Grain Conditioning Study Final Report. 3D Energy Limited. Sherwood Park, Alberta. 43pp. (Accessed: June 24, 2022).
- footnote[49] Back to paragraph Brinker, J.L and N. Anderly. 2012. Energy Efficiency Data Comparison of Ten Wisconsin Grain Dryer Installations. ASABE Paper No. 12-1337410. Written for presentation at the 2012 ASABE Annual International Meeting. Dallas, Texas, July 29 – August 1: ASABE. https://doi.org/10.13031/2013.41783
- footnote[50] Back to paragraph Hanna, H.M., J.D. Harmon and D.D. Schweitzer. 2016. Energy Use for Field Operations, Crop Drying, and Swine Housing on University Farms. Applied Engineering in Agriculture 32(6): 769-781. https://doi.org/10.13031/aea.32.11720
- footnote[51] Back to paragraph Epstein, A., W. Lubitz, G. Dineen and J. Dyck. 2020. Performance evaluation of a non-equilibrium model for low temperature grain drying and simulation of seasonal dryer operation. Drying Technology 40(5): 835-851. https://doi.org/10.1080/07373937.2020.1832511
- footnote[52] Back to paragraph Sanford, S. 2015. University of Wisconsin-Madison. December 4. (Personal communication).
- footnote[53] Back to paragraph Brown, R., H. Spieser and R. Winfield. 2010. Dryer Performance Testing Report – Preliminary Report for LAW-MAROT-MILPRO. University of Guelph. 11pp.
- footnote[54] Back to paragraph Montross, M.D. and D.E. Maier. 2000. Simulated Performance of Conventional High-Temperature Drying, Dryeration, and Combination Drying of Shelled Corn with Automatic Conditioning. Transactions of the ASAE 43(3): 691-699. https://doi.org/10.13031/2013.2751