Moose population objective guidelines
How the province determines its moose population objectives.
1.0 Background
Context
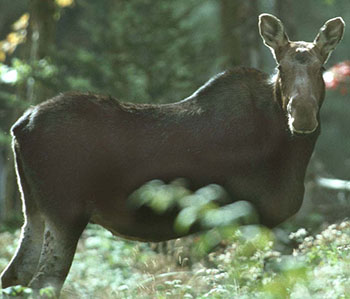
Ontario is fortunate to be home to an abundance of forests and wetlands that provide valuable moose habitat that sustains a healthy moose population. As a result, moose hunting is a very popular recreational activity pursued by many Ontario residents and non-resident hunters from Canada and the United States. The popularity of moose hunting in Ontario requires an intensive management approach to ensure a sustainable moose population. Moose population assessment and population objectives setting are critically important in the management of healthy moose populations and maintaining their related benefits.
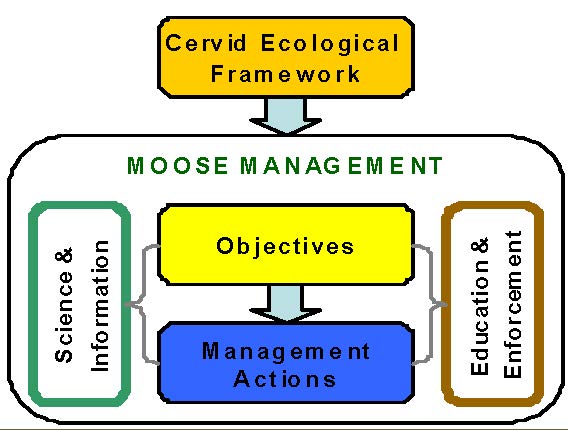
Moose population objectives are guided by the broad approach to cervid management outlined in Ontario’s Cervid Ecological Framework and Moose Management Policy.
Scope
A moose population objective is the population range of moose desired across a broader Cervid Ecological Zone and the distribution of that number across the sub-zone and Wildlife Management Unit (WMU) scale.
Purpose
These moose population objective setting guidelines are a process of determining a moose population objective that considers a broad range of ecologically-based moose population goals and objectives, at a variety of management scales including broad Cervid Ecological Zones, sub- Zones and WMUs. A moose population objective supports a variety of sustainable social, cultural and economic benefits and activities.
Adaptive moose management approach
Moose management in Ontario reflects an adaptive management approach. Setting a moose population objective reflects this adaptive approach as outlined below:
- Objectives: Population objectives are set to achieve ecological sustainability and provide for optimal benefits associated with moose and moose related activities.
- Management Actions: Management actions are put in place to achieve these objectives. Management actions need to consider land use and other resource management practices in managing moose as well as the integration of harvest and habitat management strategies to ensure a cohesive and effective management regime for moose.
- Science and Information: The moose population and other social and ecological factors are monitored and assessed to determine whether the objective and associated benefits are being achieved.
Assessment can indicate that the harvest management strategy employed or other management actions may need to be revisited, or may indicate that the objectives should be re-examined. The adaptive management cycle is then repeated.
Past moose population objectives setting approaches: 1980s
The first moose population objectives in Ontario were established in the early 1980s. They were a key component of a management strategy to increase Ontario’s moose population which included the implementation of a selective harvest system. The implementation of moose population objectives and the selective harvest system resulted in an increase in the moose population from ~ 80,000 in 1980 to ~ 109,000 in 2007.
The original objectives estimated that the number of moose that could be supported in ecosystems known to have suitable habitat was generally 40 moose per 100 km2. The approach was that moose populations should be able to reach this level in areas that are managed for good habitat and where hunting was controlled. Based on this assumption, the objective of 40 moose per 100 km2 was applied across much of Ontario’s core moose range.
While the provincial population did increase and some WMUs were able to achieve and in some cases surpass their population objective, some WMUs were not as successful.
2000 Moose population objectives setting approach
The 1980 moose population objectives were revised in 2000. WMU-specific population objectives were adjusted to consider ecological conditions and socio-economic factors. New information was used wherever possible for these revised population objectives, such as science and information, habitat capability modeling, stakeholder input and improved mapping technologies to calculate land area and moose range.
Lessons learned
Habitat suitability: In some WMUs, habitat suitability could not support a population objective that aimed to increase the population. Some large areas in Ontario do not have productive moose habitat. It was recognized that WMU-specific habitat should be considered.
Ecological role of moose: The 1980 objectives did not consider the role of moose in ecosystem sustainability. It is important to consider how many moose are necessary to maintain their natural function in the ecosystem across a broader landscape. This is particularly critical for harmonizing the management of moose with other cervids and associated predators.
Human use of moose: In some WMUs, the original population target was not achievable over the long term because of high socio-economic demands relative to landscape productivity. In other WMUs, the target could have been higher to support the quality of moose related activities. A sustainable mix of socio-economic benefits should be considered across the broader landscape.
2.0 Setting moose population objectives
The following general approach is intended to guide the development of new moose population objectives. The approach reflects current policy as outlined in Ontario’s Moose Management Policy and Cervid Ecological Framework, and builds on the 1980 and 2000 objective setting processes.
- Ecological: Recognizing that population objectives must consider the broader ecosystem, and help maintain natural ecosystem processes and functions.
- Strategic Management Scales: Achieve moose management goals and population objectives by using the Cervid Ecological Framework (and associated zones) to guide decision making at the sub-zone level and within the WMU level.
- Coordinated: Recognition that the determination of population objectives is coordinated amongst Wildlife Management Units to achieve broader population objectives across the ecological zone.
- Integrated: Establishing population objectives are to be integrated with other land use and resource management planning exercises.
- Transparent: Consulting with public and stakeholders and communicating clearly on the development and implementation of population objectives and results.
- Adaptive: Applying an adaptive management approach, whereby management actions are guided by newly obtained science and management information, will help ensure that harvest management strategies are continuously evaluated and refined.
Process
Establishing moose population objectives in Ontario is an iterative three-step process for the Cervid Ecological Zone (CEZ) and Wildlife Management Unit (WMU) or sub-Zone scale, and involves the:
- Determination of Ecological Population Range
- Determination of Socio-Economic Population Range
- Setting Specific Population Objective

2.1 Ecological population range
Purpose:
Moose are important to the health of northern ecosystems and play an integral role in preserving Ontario’s biodiversity. A key element of Ontario’s moose management goal is to ensure sustainable moose populations and the ecosystems on which they rely. This means that moose numbers should be in a range where they can fulfill their natural role within the ecosystem.
Process:
The ecological population range is determined through consideration of the main interactions between moose and the ecosystem. The main interactions are summarized in three broad categories:
- Habitat Suitability
- Other Cervid Factors
- Moose Ecosystem Interactions e.g. predators
Establishing an ecological population range in Ontario is an iterative three-step process for the Cervid Ecological Zone (CEZ) and Wildlife Management Unit (WMU) or sub-Zone scale, and involves:
Step 1: Habitat Suitability
Determining the maximum number of moose that a specific habitat can sustainably support by assessing the habitat suitability for moose and the estimated potential moose density within those areas.
Considerations:
Existing computer models provide the geological and ecological information necessary to broadly assess moose habitat. Local knowledge should be used wherever possible to more accurately identify and define the boundaries of areas that do not support moose.
Non Moose Range - Areas where moose are not expected over the long-term, including urban and developed areas, industrial areas e.g. mines, large blocks of water, agricultural land and other areas of unsuitable habitat e.g. bog.
Moose Range - Areas considered poor habitat to support moose populations and used by moose to move through as part of their range.
Main Moose Range - Large areas that are capable of supporting > 10 moose per 100 km2 over the long-term. Main moose range can be divided into high, moderate, and low density areas for use in setting the upper and lower ecological bounds in Steps 2 and 3.
Other Moose Range - Large areas where moose are likely to be at < 10 moose per 100 km2 over the long-term. At this density threshold, moose contribution to ecosystem function may be reduced.
Step 2: Other Cervid Factors
Identify the specific cervid management focus for the CEZ, WMU or sub-Zone area, as detailed in the Cervid Ecological Framework. The moose density objective is applied in consideration of other cervid objectives.
Considerations:
Guidance for determining the cervid management focus for each CEZ and WMU can be found in the Cervid Ecological Framework. Some areas may have a management focus on more than one cervid species. Multiple cervid species can and do exist on the same landscape in healthy and natural ecosystems, and these areas should be managed within ecological and socio-economic limits.
Species-specific policies should be consulted in the population objective setting process. Where warranted, it may be appropriate to explore sub-zone or sub-WMU management to achieve multiple objectives.
Caribou - In areas where caribou are the primary focus of management, moose should be managed to a low density to reduce predation pressure on caribou. Given ecological and geographic variances within these zones, setting a moose population objective that assists in maintaining or restoring caribou populations may mean managing to ≤10 moose per 100 km2 (Bergerud et al. 2007).
The total prey base should be considered when applying management actions within Caribou Areas. Management criteria for moose may not be maintained in all circumstances due to fluctuations in moose hunting demand and success, as well as natural fluctuations in the number of predators and prey over time with changing ecological conditions.
Deer: In CEZs where white-tailed deer are the primary focus of management, moose populations are generally absent or exist at low densities due to differences in habitat selection, habitat utilization and other ecological factors. In these areas, the moose population objective may reflect current or expected moose numbers rather than revealing the need for active management. Where both deer and moose are the focus of management on the same area, the effect of the combined biomass of ungulates on the ecosystem should be considered.
Elk: Where moose and elk occur together, elk are not expected to affect moose numbers and vice versa.
Step 3: Moose-Ecosystem Interactions
Determining a population range where moose fulfill their natural role within the ecosystem context e.g. healthy and productive conditions as browsers and prey, for example:
- The relationship between moose and predator populations;
- The effect of too many or too few moose on the ecosystem;
- The effects of high moose density on overall moose condition, productivity and spread of disease; and
- The effects of low moose density on calf productivity and survival.
Considerations:
Upper limit population range indicators:
Predators: In systems where both wolves and bears are predators of moose, moose densities generally do not exceed an average of 40 moose per 100 km2 (Messier and Crete 1985) – this is also witnessed in areas where the habitat may support higher moose populations. Predation can provide an upper limit of the maximum number of moose in areas that could support above 40 moose per 100 km2. Habitat generally limits moose population in remaining areas.
Habitat: Favoured moose browse vegetation and some rare species can be largely eliminated from ecosystems with very high moose densities of more than 100 per 100 km2. Tree regeneration can also be affected and significant changes to the ecosystem can occur (Schwartz and Franzmann 1989).
Moose Condition and Disease: At very high densities (relative to the carrying capacity of the land), moose can degrade their habitat which has led to a corresponding decline in body condition, a reduction in productivity and an increase in mortality. Higher moose densities can also lead to increased occurrences of disease and parasites e.g. winter tick. In general, these situations appear to be reduced when moose populations occur at less than 40 per 100 km2.
Lower limit population range indicators
Predator: Wolf populations do not generally thrive well at moose densities of less than 20 moose per 100 km2 (Messier 1985). Bears, other predators and scavengers are generally not as dependant on moose; however, they can benefit from higher moose numbers.
Habitat: Moose play an important role in shaping the composition and structure of the forest, however there are no estimates of minimum moose densities required to maintain forest composition and structure.
Moose Productivity and Survival: Dispersed populations or low densities of moose may result in population recruitment problems as some females may not breed or conceive during the relatively short breeding season. If females are bred later, their calves will be correspondingly late-born and may not survive winter conditions. A moderate level of moose population density that may address this is ~ 20 moose per 100 km2 or consideration of the habitat carrying capacity.
Table 1: Setting the ecological population range
Step 1. Habitat suitability
| Category | Criteria | Action | Method |
|---|---|---|---|
| Non Moose Range | no moose expected |
|
|
| Moose Range: High Density | moose expected ≥ 40 moose/100 km2 |
|
|
| Moose Range: Moderate Density | moose expected 20-40 moose/100 km2 |
|
|
| Moose Range: Low Density | moose expected ≤ 20 moose/100 km2 |
|
|
Step 2. Other cervid considerations
| Category | Criteria | Action | Method |
|---|---|---|---|
| Caribou Areas | ≤ 10 moose/100 km2 Note: In Caribou Areas, management actions may focus on maintaining low density moose populations to reduce predation pressure on caribou. Moose are one part of the total prey biomass for predators in these ecosystems and should be considered in this context when applying management actions in Caribou Areas. |
Note: may require using CEZ sub-zones (where appropriate / if feasible) |
Note: The criteria for moose may not be maintained in all circumstances due to fluctuations in moose hunting demand and success rates, as well as natural fluctuations in the number of predators and prey over time with changing ecological conditions. |
| Deer Areas | Current moose density |
Note: may require using CEZ sub-zones (where appropriate / if feasible) |
Note: The criteria for moose may not be maintained in all circumstances due to fluctuations in moose hunting demand and success rates, as well as natural fluctuations in the number of predators and prey over time with changing ecological conditions. |
| Moose Areas | continue to Step 3 |
Note: may require using CEZ sub-zones (where appropriate / if feasible) |
Note: The criteria for moose may not be maintained in all circumstances due to fluctuations in moose hunting demand and success rates, as well as natural fluctuations in the number of predators and prey over time with changing ecological conditions. |
Step 3. Moose - Ecosystem interactions
| Category | Criteria | Action | Method |
|---|---|---|---|
| Upper Limits Predator Limitation Habitat Damage Moose Condition /Disease | ≥40 moose/100 km2 |
* Note: a few WMUs may have traditionally supported higher density moose populations and, in such cases, an upper limit historic density in excess of 40 moose/100 km2 may be appropriate. |
*Note: There may be instances where sustainable population targets exceed or do not reach these specified criteria |
| Lower Limits Predator Needs Habitat Function Moose Productivity/Survival | ≤ 20 moose/100 km2 or near habitat carrying capacity. |
|
*Note: There may be instances where sustainable population targets exceed or do not reach these specified criteria |
Step 4. Combine ecological factors
| Category | Criteria | Action | Method |
|---|---|---|---|
| Upper Ecological Limit | Step 1 densities with any Step 2 & 3 maximums |
|
|
| Lower Ecological Limit | Step 1 densities with any Step 2 & 3 minimums |
|
|
2.2 Socio economic population range
Purpose:
A socio-economic population range indicates the optimal moose population range, consistent with the objectives of the Cervid Ecological Framework and Moose Management Policy, to support a variety of socio-economic benefits, and is a critical component of an appropriate population objective. To help ensure desired outcomes are achieved, input from the public and stakeholders should inform the process.
Process:
The socio-economic population range is determined through consideration given to:
- Stakeholder Interests
- Activities
- Areas Accessibility
Establishing a socio-economic population range in Ontario is a flexible process that is inclusive of local interests and realities and complies with cervid ecological zone and moose policy objectives, and considers:.
Stakeholder interests
To help ensure to the greatest extent possible that desired outcomes can be achieved, local input from the public, stakeholders and the local aboriginal communities should inform the process of determining the socio-economic population range.
Some examples of public/stakeholder interests in the moose population are:
- Recreational interests related to hunting and viewing activities
- Cultural and spiritual interests and knowledge
- Socio-economic interests
Activities
When setting a socio-economic population range, consideration should be given to the range of different activities practiced and the economic, spiritual and social benefits they provide. These activities and associated benefits can include, but are not limited to:
- Hunting and harvest by all users;
- Viewing and other inherent (spiritual and cultural) benefits; and
- Economic benefits generated by all moose related activities.
Moose harvest:
Determining the optimal sustainable harvest is an important socio-economic consideration of moose population management. Moose hunting generates considerable economic benefits to the Ontario economy each year.
Considerations:
There is no single population density that will continually provide optimum moose harvest in a Cervid Ecological Zone or WMU. Local trend information on recruitment, tag numbers, success rates (including calf harvest), level of subsistence harvest and population density can assist in estimating the range where optimal harvest may occur. Consideration can also be given to the mid-winter calf population to estimate potential recruitment. If trend information is not available, consideration may be given to a density of 30 moose/100 km2 (good habitat) – which falls well below a predator limited density.
To some people, the availability of adult validation tags may be more important than harvest success. To many hunters, encounters with moose are as important as the harvest of moose or the availability of adult tags. This is often reflected in tag fill rates and number of moose seen per hunter day. However, no specific density has been identified that will optimize hunt quality. Consideration should be given to hunter desires, local information and trend in populations, moose seen per hunter day and success rates.
Areas accessibility:
Accessibility is an important factor that affects the practice of moose related activities, and it is important to consider the distribution of moose in relation to accessibility when determining the socio-economic population range.
Delineating large remote areas from road accessible areas can help identify where the majority of moose related activities are practiced. In addition, consideration should also be given to:
- Different user groups;
- Where these activities are practiced; and
- Location of the moose population.
Viewing and Inherent value – Considerations
Wildlife viewing is an increasingly popular activity in Ontario. The socio-economic population range should consider that wildlife viewing encompasses moose and associated landscapes and other species. In addition, the population range should recognize the intrinsic value of moose to the people of Ontario.
Economic benefits – considerations
As mentioned above, moose provide important economic benefits to residents, communities and the tourist industry. Moose are also important economically as a food source, particularly in northern and aboriginal communities.
Other considerations
Where moose cause a significant conflict with people (e.g. vehicle collisions) it may be appropriate to consider a reduced population density. It is important to note however that these problems are usually localized and additional appropriate strategies may need to be developed.
Table 2 Moose population objectives – General relationships
| Approximate Density Moose/100 km2) | Ecological benefits from Moose | Socio-Economic Benefits from Moose< | Habitat Quality |
|---|---|---|---|
| 30-40 | High – but avoids disease and damage |
| Good |
| 20-30 | Medium – provides for Wolves |
| Medium |
| 10-20 | Low – low inmportance of moose in ecosystem |
| Poor |
| 0 | Ecosystem dominated by other species (may change over time) | Management for other species | Non range |
2.3 Specific population objective
A specific population objective is to be developed for each Cervid Ecological Zone/sub-zone and Wildlife Management Unit. This objective will be the range of moose densities that is intended, over time, to provide the optimal mix of socio-economic benefits within the ecologically sustainable bounds of the population.
To assist in determining the most fitting population objective to provide optimal socio-economic benefits, a moderate approach to incrementally manage the population within the identified range may be appropriate.
Coordination
To ensure that the management goals and objectives within the Cervid Ecological Framework and Moose Management Policy are achieved, development of the CEZ and WMU population objectives must be coordinated and harmonious. In general, there should be a good distribution of the various types of moose population objectives across the landscape.
Public involvement
All Ontarians are encouraged to participate in planning and decision-making in moose management and public input will be sought on the specific population objectives.
3.0 Achieving moose population objectives
Purpose:
Ontario’s Cervid Ecological Framework and Moose Management Policy provide strategic and specific direction for moose management and for achieving population objectives. However, a number of factors can affect the achievement of the population objective. This section details some of the more significant factors that can affect the achievement of the population objective and provides a range of considerations for planning to achieve the population objective.
Considerations:
The following is a general list of factors that can affect the achievement of the population objective within the Cervid Ecological Zone and Wildlife Management Unit that should be considered in management planning:
Licensed Harvest Management
- Refer to Ontario’s Moose Harvest Management Guidelines
Aboriginal Harvest
- Work with Aboriginal organizations and communities to achieve ecologically sustainable moose populations and sustainable harvests.
Illegal and Mistaken Harvest
- Work with Enforcement personnel to identify problem areas
- Enhance education and communication efforts
Other Species – Cervids and Predators
- Identify opportunities to incorporate moose population objectives in the local management of these species
Disease
- Identify methods to reduce significant disease problems
Vehicle Collisions
- Identify actions to reduce significant local problems
Habitat
- Identify areas to apply moose habitat management direction in Forest Management Plans
- Identify areas where forest management practices require additional management for moose - for example, protection from hunting in large cutover areas
Management planning of the population objective will typically have a multi-year focus and should be reviewed periodically in a coordinated manner as new information is available, for example: validation tag calculations are typically reassessed when new Moose Aerial Inventory survey information is available or other population information indicates a significant change in the population.
An adaptive management approach should be applied to ensure action is taken, as appropriate, in response to continued evaluation and improvement of population objectives based on new knowledge and past experiences (e.g. best available science, monitoring data). Population objectives should be examined relative to population trend information to assess the overall level of achievement.
4.0 Assessing moose population objectives
Ongoing evaluation is key to early identification of issues and timely management actions. Local moose managers will also need to determine whether there are other factors affecting the population that should be addressed.
Methods of Assessment:
Moose Aerial Inventory surveys provide moose population estimates according to a standard method and provide an objective estimate of the population over a broad area. Moose Aerial Inventories should be considered in conjunction with other available population trend information.
Accuracy and Precision: It is critical that Moose Aerial Inventory surveys are conducted according to standard methodology. This is essential for reliable comparisons within and among WMUs and CEZs over time.
Frequency: Surveys should be conducted at an appropriate frequency for each WMU and CEZ. This frequency should:
- allow interim assessment of movement towards or away from the population objective and potential management adjustments; and
- allow detection of any potential problems in the population or management before significant declines in the population occur.
Estimate Type: The moose population estimate used will generally includes moose seen and moose missed from track aggregates. This should be the most accurate estimate of the population. However, it is very important that moose missed make up only a small portion of the estimate (generally less than 10% and preferably less than 5%). Higher proportions of moose missed could indicate that the survey standards were not met and the population estimate may be unreliable.
Confirmation: Where possible, more than one method should be used to evaluate the population status to independently confirm results or trends. Harvest and sightings information may be used to enhance or confirm other population information results.
Because of the statistical variability of aerial survey results, the following considerations are advised:
- Confirm with independent data: Use other information, such as harvest or sightings, to confirm aerial survey trends where possible.
- Examine large increases: Determine if a questionable increase is biologically possible given estimated recruitment and mortality.
- Carefully consider declines: Examine mortality and recruitment as well as hunt and harvest data to help determine if a decline is possible.
- Appropriate use of statistical procedures: Caution should be exercised when using standard tests of significance to evaluate the difference between successive aerial surveys. It is also seldom appropriate to use the upper or lower end of the confidence interval as the estimated population - the estimated mean remains the highest probability for the true population level.
- Examine Past Trends: Look at the past population estimates, recruitment, and harvest to see if the most recent survey results resemble a pattern or appear reasonable.
Reporting
The moose population objectives and population estimates should be calculated consistently and coordinated across WMUs in order to make direct comparisons within and between Cervid Ecological Zones/sub-zones and WMUs. The following calculations should be considered:
Moose Number: For both the population objective and the population estimate, the main measurements are the estimated moose population within the geographic boundaries of the WMU/CEZ, adult bull:cow ratios in the population, and recruitment rates (e.g. % calves, calves/100 cows).
Moose Density: This is the average density of moose based on the estimated moose population divided by the moose strata area used to estimate the moose population. Moose density is used to standardize comparisons within and between WMUs and CEZs. The densities detailed below for population objectives and population estimates are generally used though additional measures (e.g. road accessible moose range) may be used across and within a CEZ or WMU.
- Land and Water Moose Range: This density represents the total number of moose over the total landscape area they use. Water is included because it forms part of the landscape that moose and their predators interact in. Moose also use shallow water areas for feeding and islands for calving. The sum of these areas gives an estimate of the total moose range in Ontario.
- Land Only Moose Range: Same as above but with water removed. This calculation is often used in areas with large amounts of water (e.g., northwestern Ontario). Note that removing water will result in higher moose densities than on the overall landscape.
- Main Moose Range; Land and Water: This is the part of the moose range that can support ≥10 moose per 100 km2. Moose are an important part of the ecosystems in these areas. So moose need to be at densities where they fulfill their ecological role in these areas.
Criteria for Achievement
For moose populations, three levels of objective achievement can be evaluated:
- Ecological Population Range - The moose population should be managed to stay within the Ecological Population Range identified in Section 2.1. This is the primary measurement of management success. It is important to be cautious in interpreting population estimates – particularly at the lower end of the range because of the variability in population estimates. For example, a population estimate at the lower end of the ecological range has a 50% chance of being below the range. To increase the probability of being inside the range to 67% or 75% the estimate should be about 5% or 8% above the lower ecological limit and about 5% or 8% below the upper ecological limit. This is with a survey precision of +/- 20% of the mean 90% of the time.
- Socio-Economic Population Range - The moose population should also be managed within the Socio-Economic Population Range identified in Section 2.2. If the population is within this range, then an appropriate mix of socio-economic benefits from moose should be provided. Again, to be sure of being within this range, the population estimate should be slightly higher than the lower limit and slightly lower than the upper limit of the range (e.g. 5% to 8%).
- Specific Population Objective - This is the population range identified to give the best mix of benefits over the next planning cycle, see Section 2.3. The question arises as to when the population objective is considered as achieved. Having an estimate within 10% of a desired level is generally considered quite close in natural systems. However, with an estimate that is 10% below the objective, there is an approximately 80% chance that the actual population is below the objective. In such cases, it might still be reasonable to continue management efforts to increase the population. Therefore, objective achievement is better translated as a range of management responses to the population status – see the table below.
Table 3: Management approach for various population levels and trends
| Population Level relative to objective | Population Trend Increasing | Population Trend Decreasing |
|---|---|---|
| < - 20% | intensive management to increase population | intensive management changes to increase population |
| - 20% to - 10% | moderate management to increase population | strong management changes to increase population |
| - 10% to 0 | continue moderate management to increase population | management changes to reverse decline |
| 0 to +10% | management changes to stabilize population | continue management to stabilize population |
| > + 10% | management changes to allow gradual decline | adjust management to allow gradual decline |
5.0 References
Bergerud, A. T., W. J. Dalton, H. Butler, L. Camps, & R. Ferguson. 2007. Woodland caribou persistence and extirpation in relic populations on Lake Superior. Rangifer, Special Issue No. 17.
Crête, M. and P.A. Jordan. 1982. Production and quality of forage available to moose in southwestern Quebec. Can. J. For. Res. 12: 151-159.
Messier, F. 1985. Social organization, spatial distribution, and population density of wolves in relation to moose density. Can. J. Zool. 63: 1068-1077.
Messier, F. and M. Crete. 1985. Moose-wolf dynamics and the natural regulation of moose populations. Oecologia (Berlin) 65: 503-512.
Schwartz, C.C. and A.W. Franzmann. 1989. Bears, wolves, moose and forest succession, some management considerations on the Kenai Peninsula, Alaska. Alces 25: 1-10.