Office of the Chief Coroner of Ontario Report for 2015–2019
Death investigation is a process where the coroner seeks to understand how and why a person died. Get information about the findings and find statistics about these investigations in Ontario.
Overview
The Office of the Chief Coroner (OCC) is releasing the most up-to-date statistics for 2015 to 2019 in an effort to increase transparency and accountability to the public. Partial data for 2019 has been provided as some death investigations are still on-going. Data collected through the death investigation system can be used by governments, communities, researchers, prevention organizations, and the public to enhance public safety and inform injury and death prevention strategies.
Also, in July 2020, the OCC updated the public brochure, ‘Death Investigations in Ontario: A Guide for Family and Loved Ones’, to bring greater understanding about the death investigation process. Coroners provide the brochure to families and loved ones to help them learn about and navigate the death investigation system. In addition, the OCC also created an additional brochure about the death reporting and investigation processes specifically for long-term care homes. Both brochures were distributed to all long-term care homes in the province.
It is the OCC’s goal to provide high-quality death investigations that support the administration of justice, the prevention of premature death, and be responsive to Ontario’s diverse needs.
Organizational facts
In Ontario, coroners are medical doctors with specialized training in conducting death investigation. Coroners’ duties include:
- investigating deaths as directed by the Coroners Act
- informing the public about investigation findings that may prompt prevention of similar deaths
- requesting autopsies for legal reasons
- conducting inquests
- completing certificates for cremation and for shipment of bodies out of Ontario
The Chief Coroner administers the Coroners Act and Anatomy Act, and is also responsible for:
- inspecting Schools of Anatomy in Ontario
- managing Ontario’s Mass Fatality Plan
- supervising and educating coroners
The OCC and Ontario Forensic Pathology Service (OFPS) are part of the Ministry of the Solicitor General and accountable to the Solicitor General.
The Death Investigation Oversight Council (DIOC) provides oversight as an independent advisory body. It ensures the OCC’s services are provided in an effective and accountable manner.
Overall statistics on death investigations in Ontario
During the 2015-2019 period, there was a total of 82,539 death investigations in Ontario. Of that total, by manner of death, there were:
- 44,302 natural deaths
- 26,411 accidental deaths
- 7,900 suicide deaths
- 1,130 homicide deaths
- 2,433 undetermined deaths
Additionally, there were 93 investigations into potential human remains that were reportedly found.
Breakdown of death investigations by year
| Manner of death | 2015 reporting year | 2016 reporting year | 2017 reporting year | 2018 reporting year | 2019 reporting year |
|---|---|---|---|---|---|
| Natural deaths | 8,148 | 8,586 | 9,206 | 9,166 | 9,196 |
| Accidental deaths | 4,494 | 4,724 | 5,400 | 5,821 | 5,972 |
| Suicide deaths | 1,406 | 1,624 | 1,747 | 1,570 | 1,553 |
| Undetermined deaths | 358 | 402 | 480 | 534 | 659 |
| Homicide deaths | 183 | 216 | 209 | 272 | 250 |
| Investigations into potential human remains found | 27 | 26 | 14 | 15 | 11 |
| No manner (To be determined) | 0 | 3 | 16 | 75 | 176 |
| Total death investigations | 14,616 | 15,581 | 17,072 | 17,453 | 17,817 |
Breakdown of death investigations by region
| Region | Total number of death investigations | Number of natural deaths | Number of accidental deaths | Number of suicide deaths | Number of homicide deaths | Number of undetermined deaths | Number of investigations into potential human remains found |
|---|---|---|---|---|---|---|---|
| Central East Durham, Muskoka, York | 9,205 | 5,351 | 2,755 | 749 | 97 | 235 | 7 |
| Central West Halton, Peel, Simcoe | 10,851 | 5,922 | 3,384 | 1,066 | 125 | 336 | 5 |
| Toronto East Toronto - East of Yonge Street | 11,539 | 6,530 | 3,467 | 812 | 269 | 393 | 6 |
| Toronto West Toronto - West of Yonge Street | 6,397 | 3,900 | 1,615 | 515 | 118 | 239 | 1 |
| Region | Total number of death investigations | Number of natural deaths | Number of accidental deaths | Number of suicide deaths | Number of homicide deaths | Number of undetermined deaths | Number of investigations into potential human remains found |
|---|---|---|---|---|---|---|---|
| Ottawa Lanark, Leeds-Grenville, Stormont, Dundas, Glengarry, Prescott and Russell, Ottawa, Renfrew | 8,513 | 4,652 | 2,643 | 853 | 107 | 245 | 18 |
| Kingston Northumberland, Haliburton, Kawartha Lakes, Peterborough, Frontenac, Hastings, Lennox and Addington, Prince Edward | 5,822 | 3,012 | 2,032 | 558 | 53 | 117 | 6 |
| Region | Total number of death investigations | Number of natural deaths | Number of accidental deaths | Number of suicide deaths | Number of homicide deaths | Number of undetermined deaths | Number of investigations into potential human remains found |
|---|---|---|---|---|---|---|---|
| Hamilton Brant, Dufferin, Haldimand, Hamilton, Niagara, Norfolk, Waterloo, Wellington | 11,417 | 4,840 | 4,580 | 1,362 | 142 | 402 | 15 |
| London Bruce, Chatham-Kent, Elgin, Essex, Grey, Huron, Lambton, Midlesex, Oxford, Perth | 11,219 | 6,269 | 3,432 | 1,069 | 98 | 254 | 17 |
| Region | Total number of death investigations | Number of natural deaths | Number of accidental deaths | Number of suicide deaths | Number of homicide deaths | Number of undetermined deaths | Number of investigations into potential human remains found |
|---|---|---|---|---|---|---|---|
| Sudbury Algoma, Cochrane, Manitoulin, Nipissing, Parry Sound, Sudbury, Timiskaming | 4,983 | 2,657 | 1,631 | 495 | 44 | 137 | 14 |
| Thunder Bay Kenora, Rainy River, Thunder Bay | 2,507 | 1,163 | 857 | 322 | 77 | 84 | 4 |
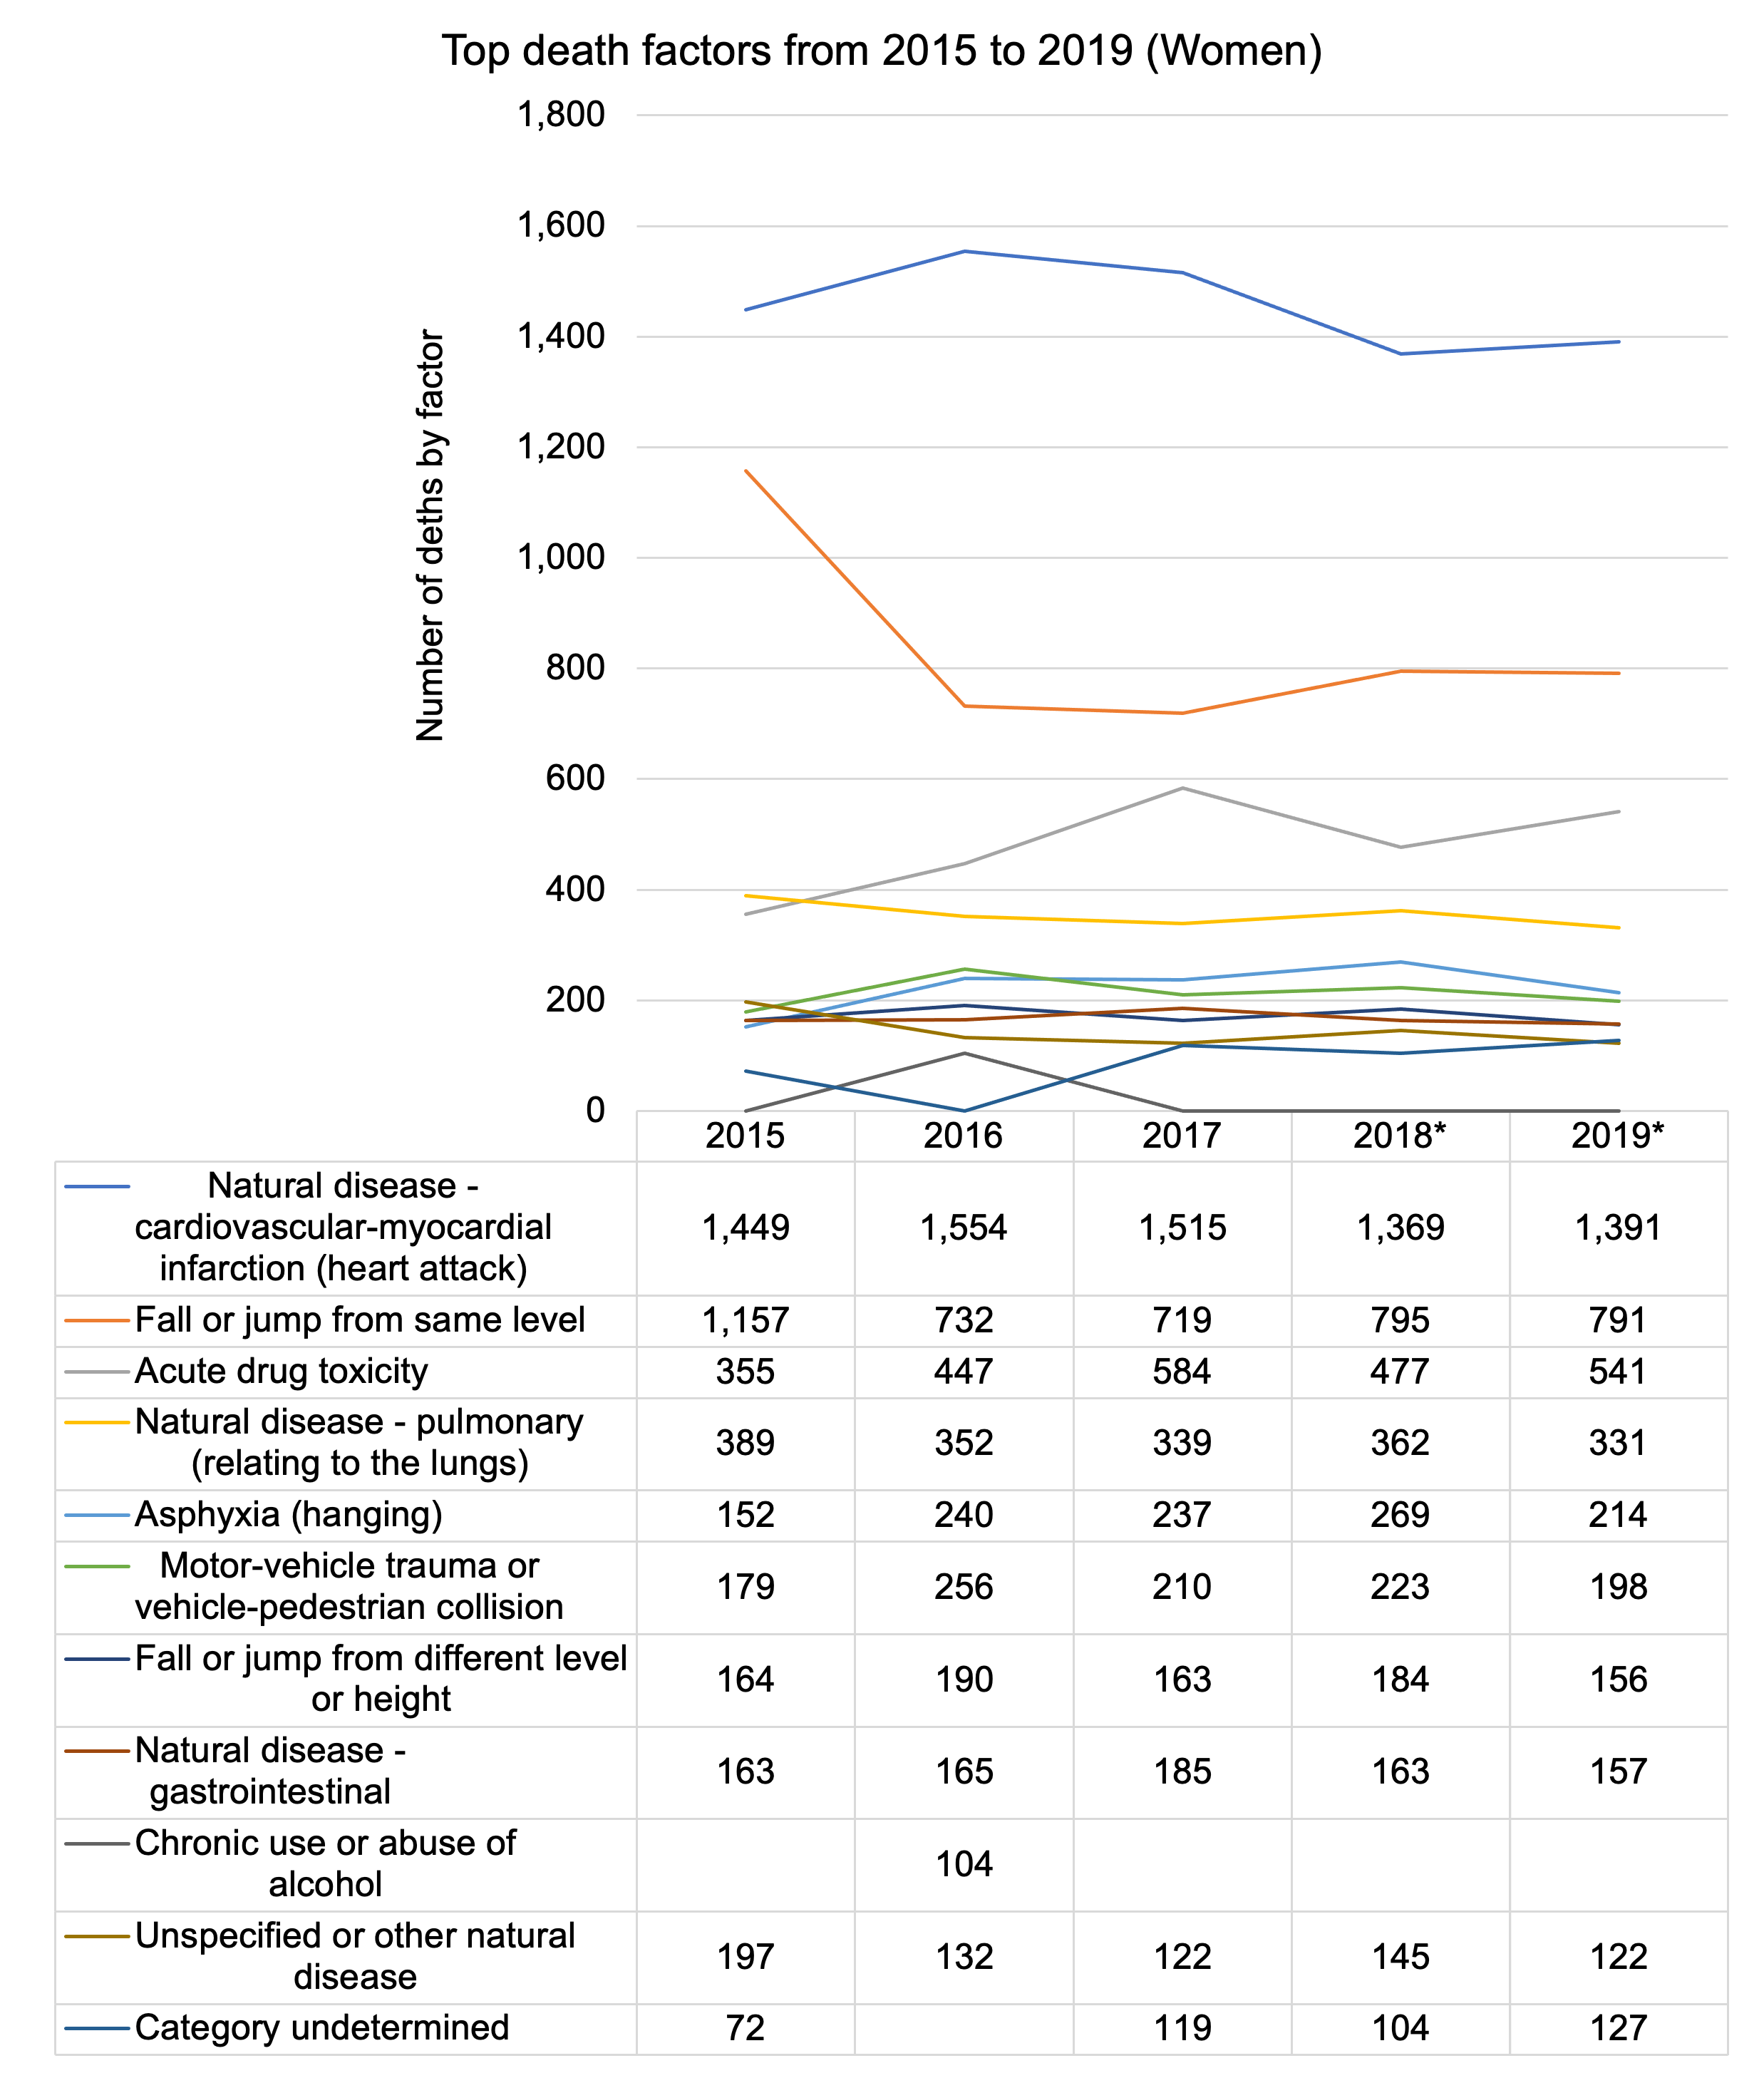
Top death factors by year
* Statistics from 2018 and 2019 may change once the statistical year has been completed.
Accessible description of Top death factors by year - men
* Statistics from 2018 and 2019 may change once the statistical year has been completed.
Accessible description of Top death factors by year - women
Top death environments by year
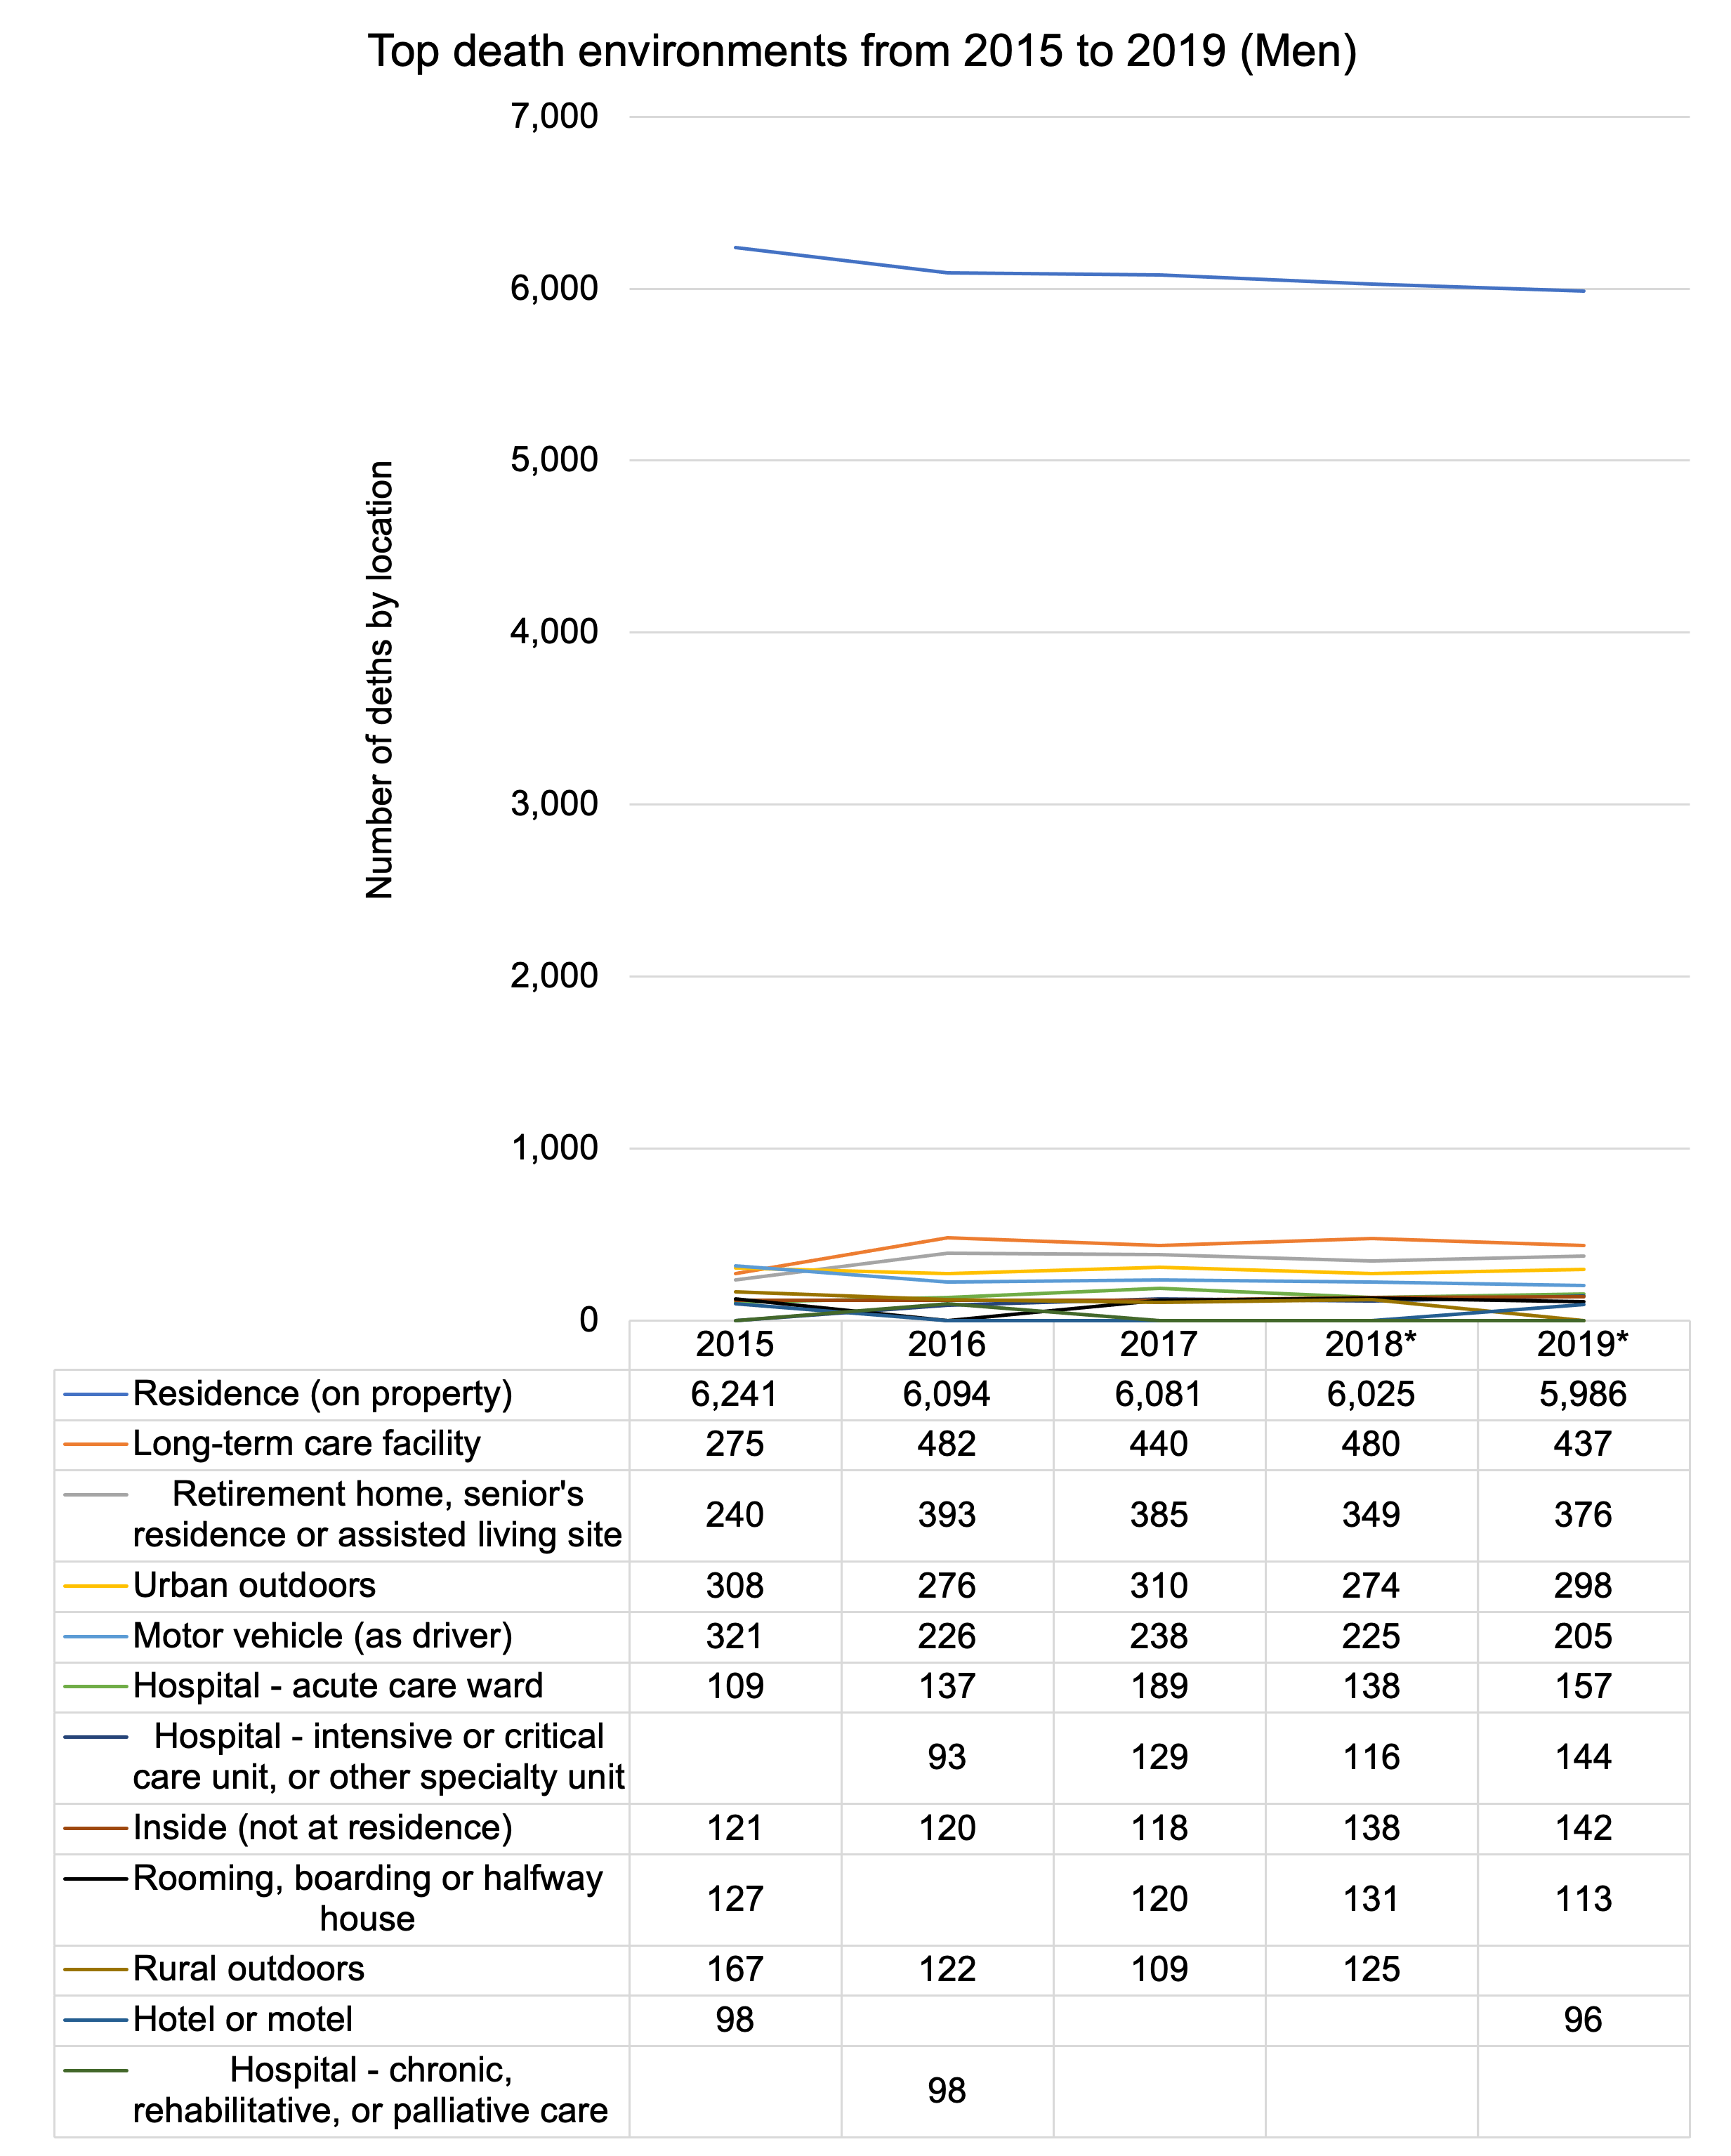
* Statistics from 2018 and 2019 may change once the statistical year has been completed.
Accessible description of Top death environments by year - men
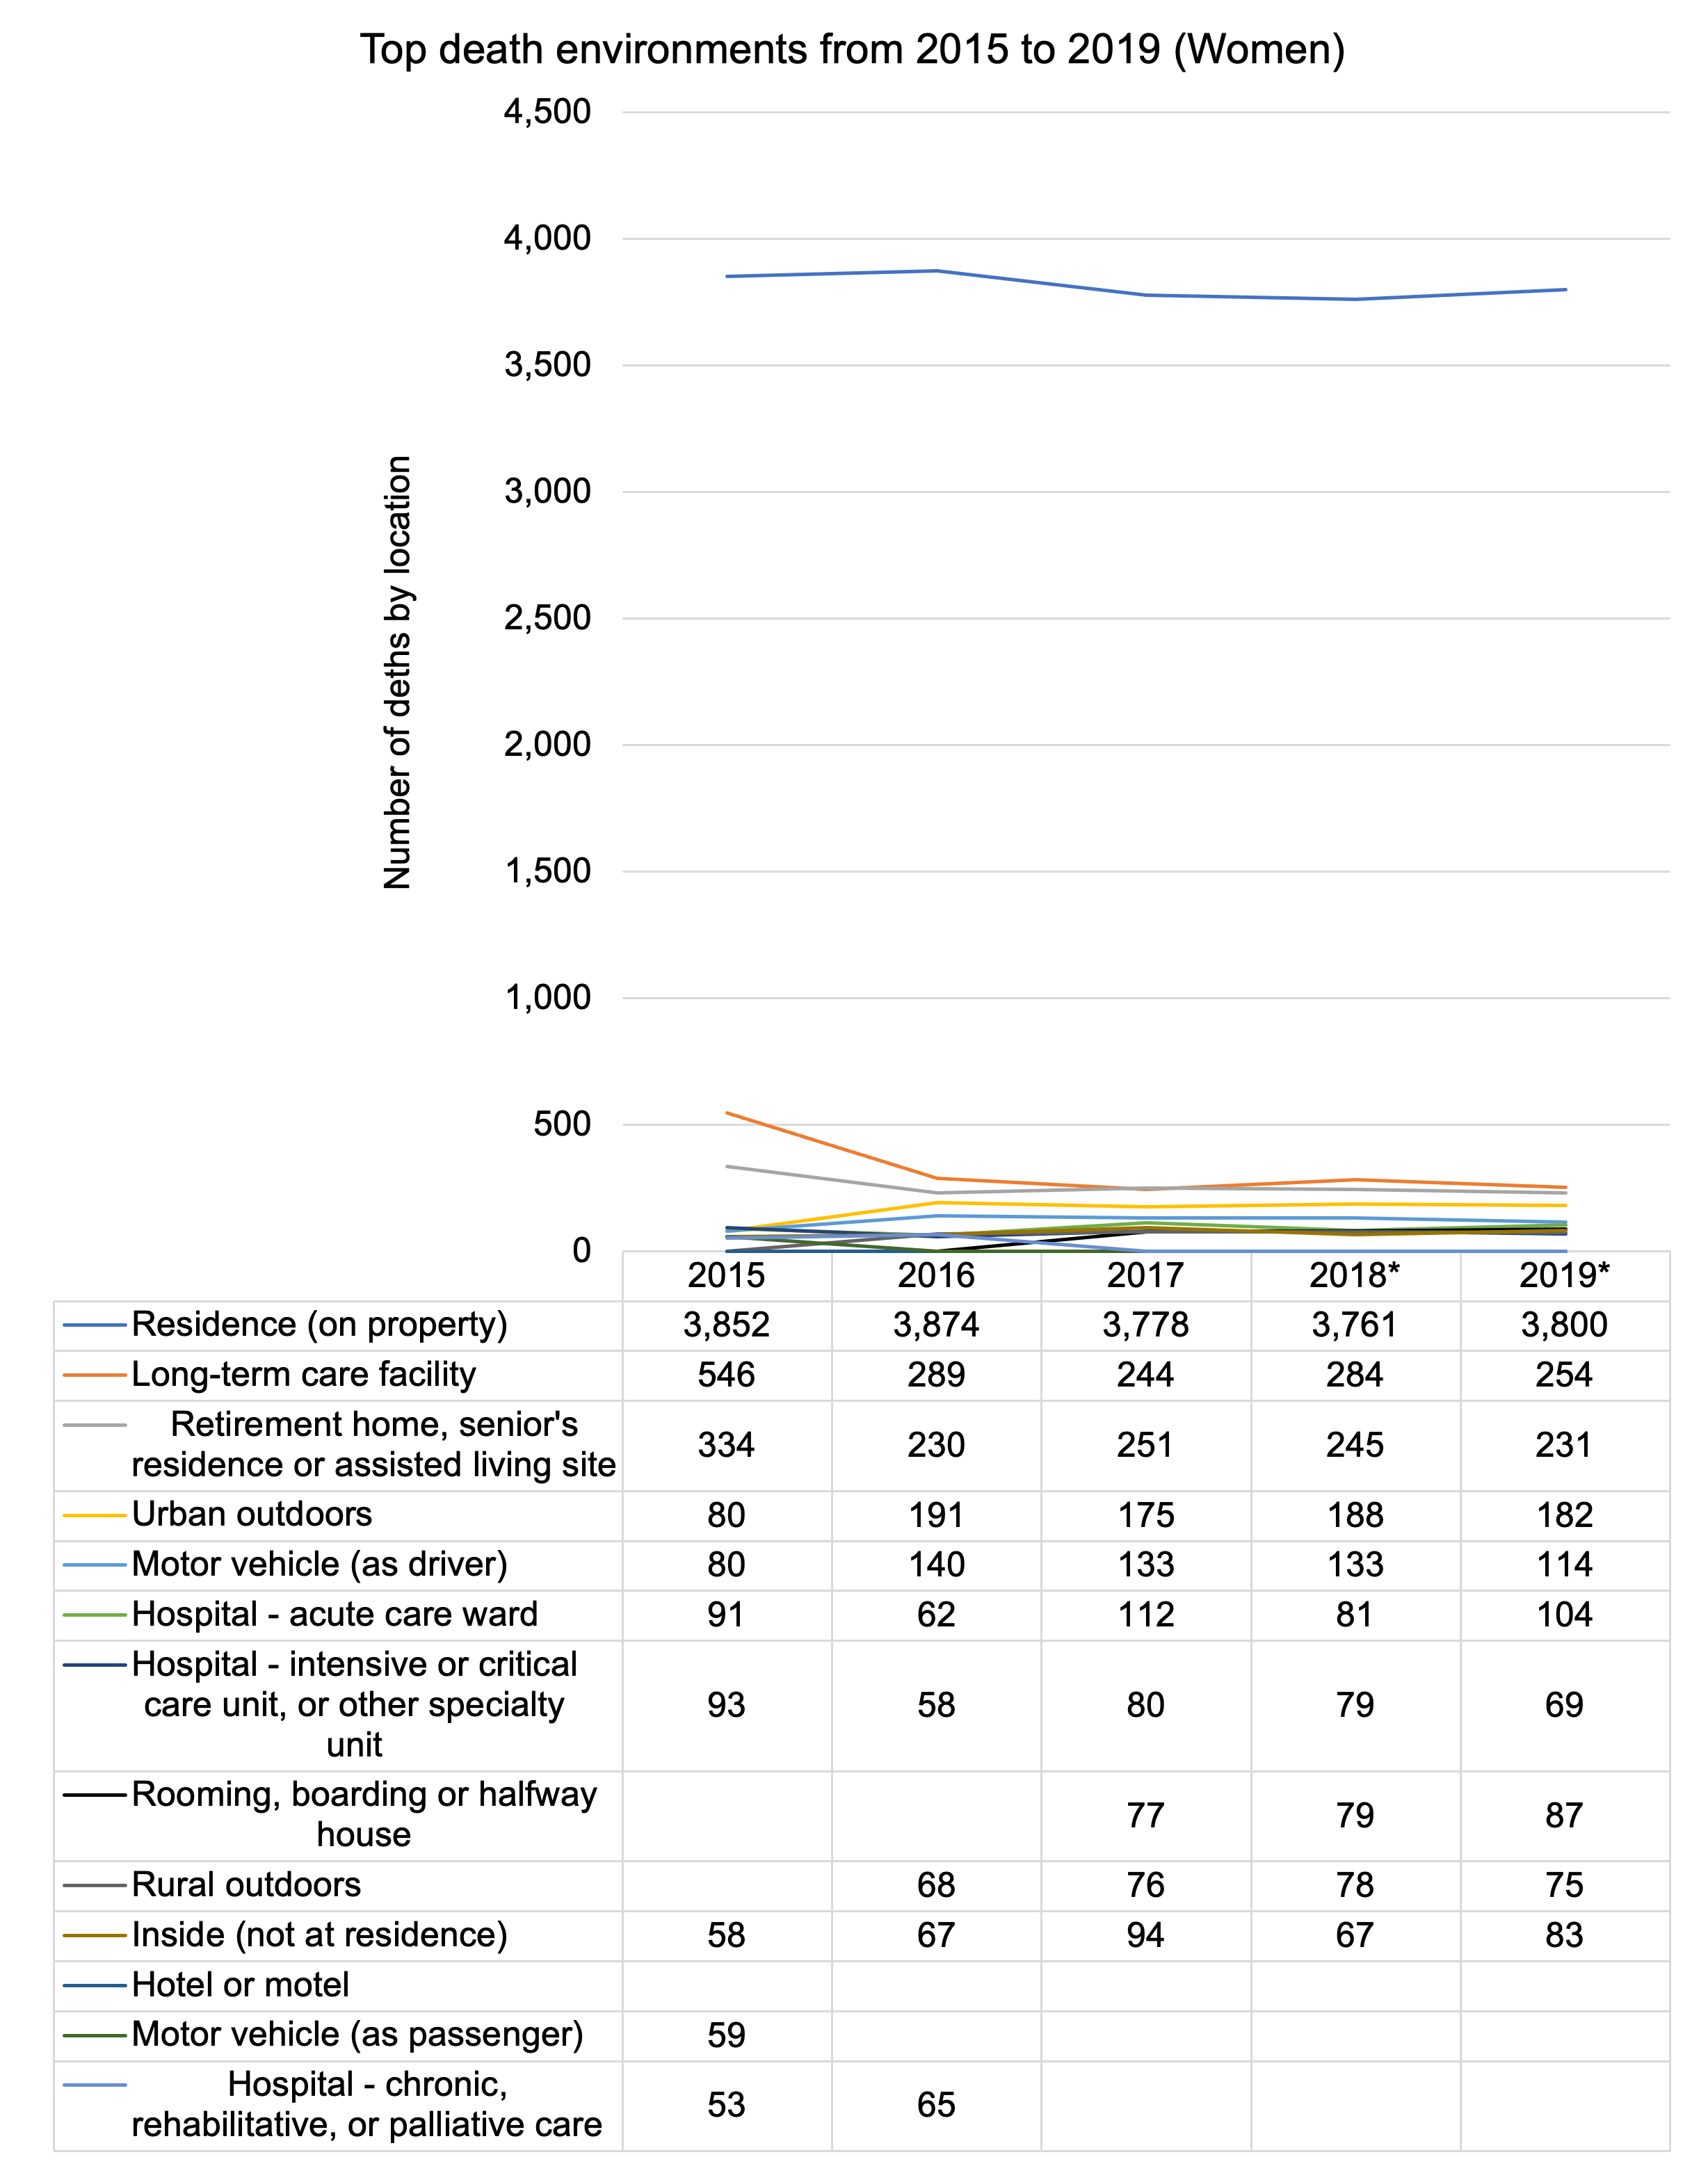
* Statistics from 2018 and 2019 may change once the statistical year has been completed.
Accessible description of Top death environments by year - women
Overall statistics on death inquests in Ontario
An inquest is a public hearing conducted by a coroner before a jury of five community members. Inquests are held to inform the public about the circumstances of a death. Although the jury’s conclusions are not binding, the goal is to present recommendations to prevent deaths in similar circumstances and implement them in the future. Learn more about the inquest process in Ontario.
Inquest statistics for 2015-2019
Between 2015 and 2019, there have been a total of 175 inquests resulting in 2,089 recommendations being made. There were 161 mandatory inquests and 14 were discretionary.
| Year | Number of inquests held | Number of recommendations made | Average number of days to complete inquest | Number of mandatory inquests | Number of discretionary inquests |
|---|---|---|---|---|---|
| 2015 | 32 | 252 | 4.2 | 30 | 2 |
| 2016 | 43 | 658 | 8.4 | 41 | 2 |
| 2017 | 32 | 345 | 4.9 | 30 | 2 |
| 2018 | 35 | 536 | 5.5 | 29 | 6 |
| 2019 | 33 | 298 | 3.9 | 31 | 2 |
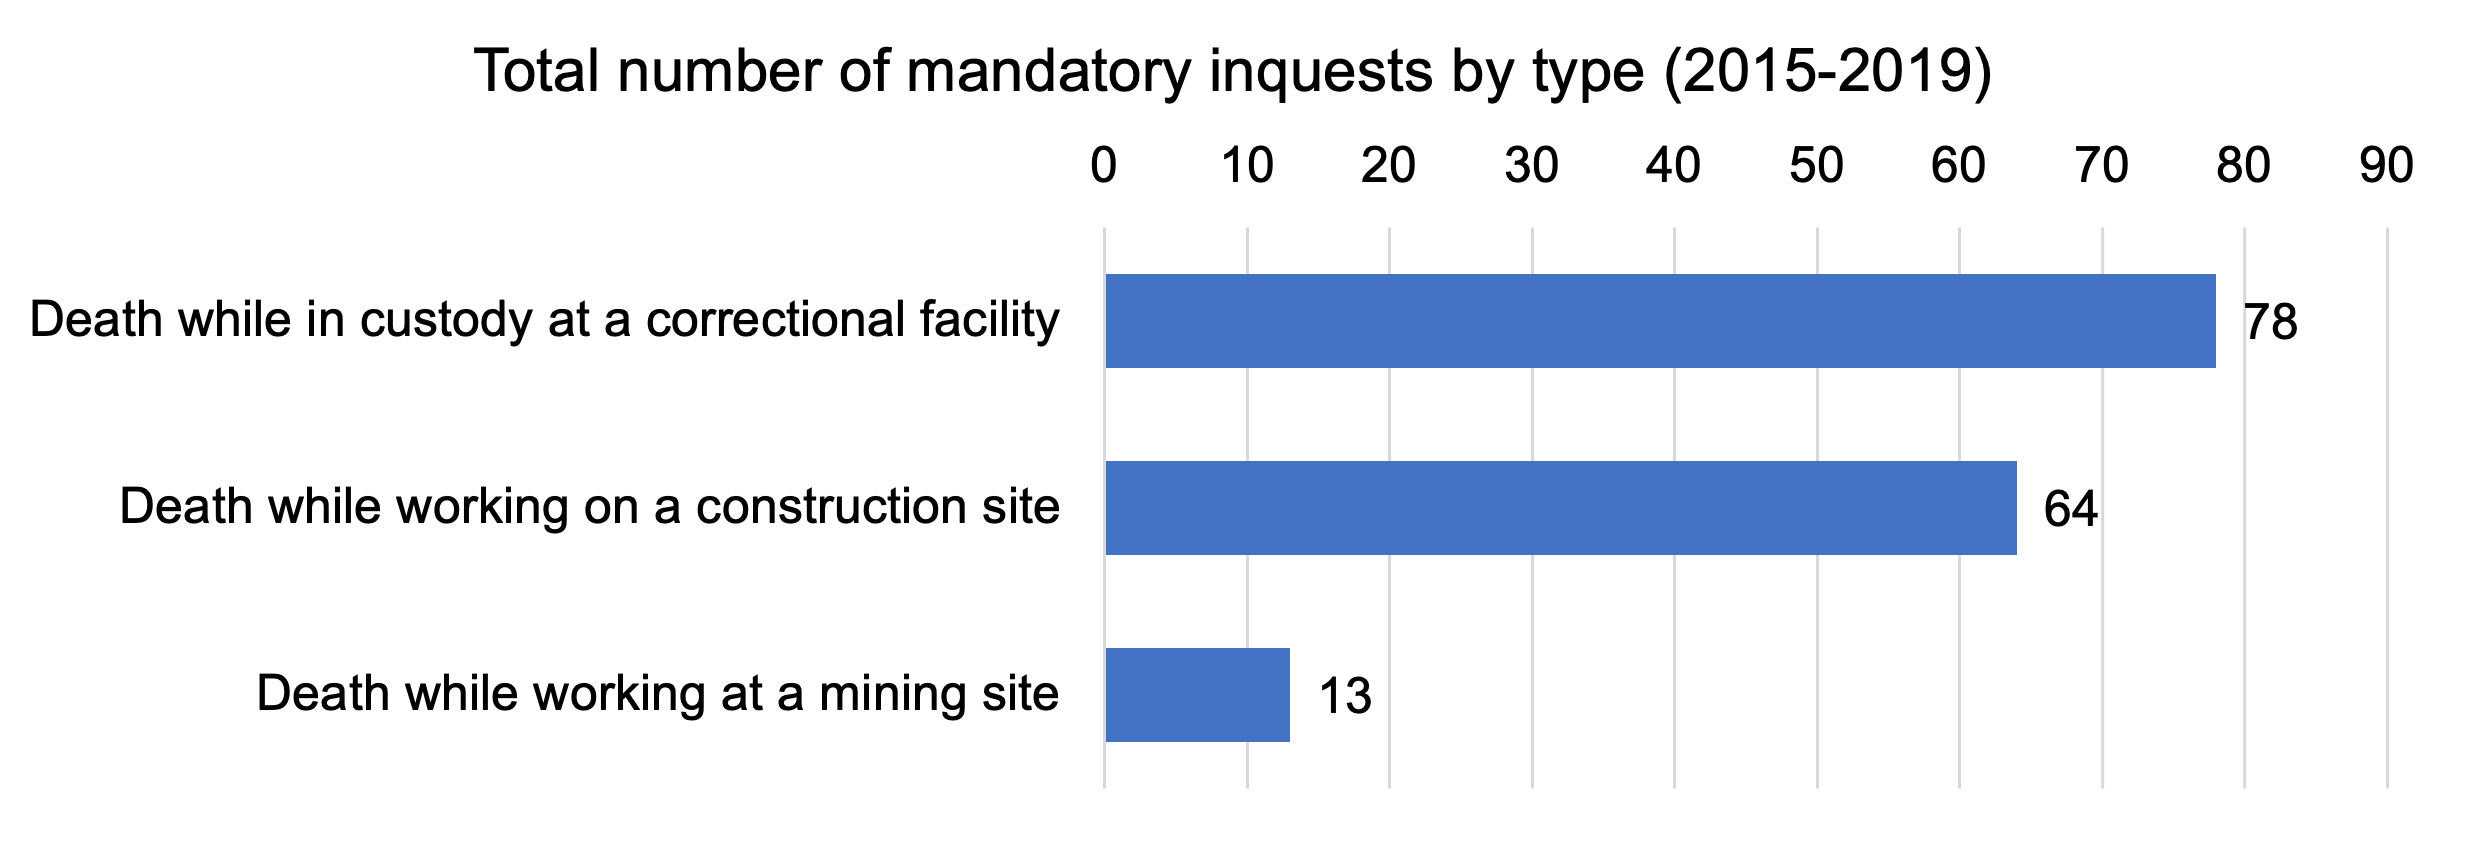
A total of 91 mandatory inquests were workplace-related which includes deaths that occurred at construction and mining sites and 64 were a result of deaths that occurred while in custody at a provincial correctional facility.
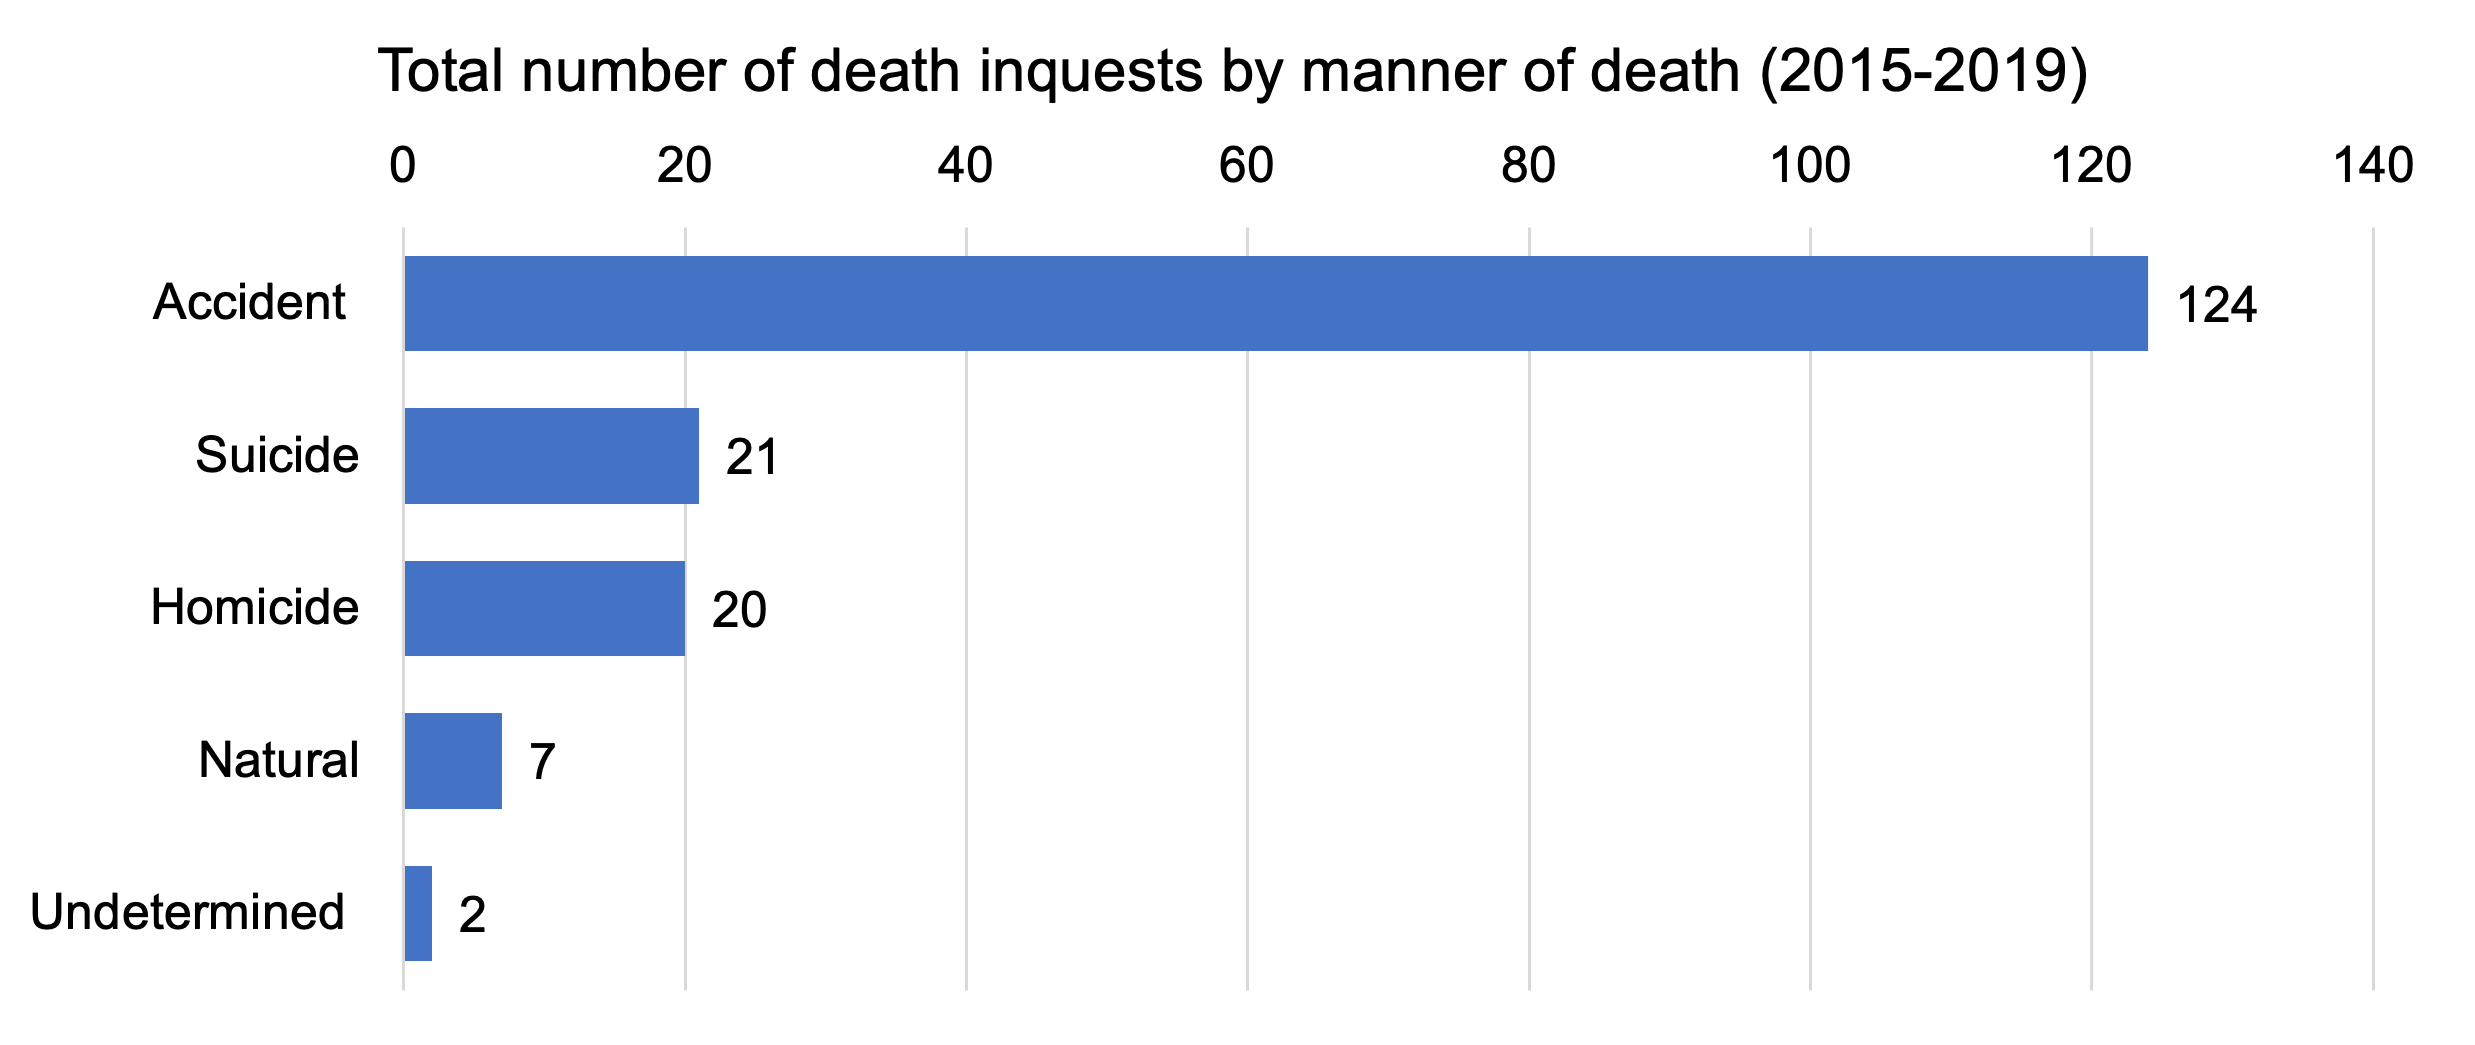
Accidents accounted for a majority of the manner of deaths for all inquests in Ontario between 2015 and 2019, followed by homicide and suicide.
Top death factors from 2015 to 2019 (Men): Chart showing top death factors from 2015 to 2019 for men. In 2015, top factors were: heart attack (2,822), fall or jump from same level (872), acute drug toxicity (544), natural disease related to the lungs (490), hanging (492), motor-vehicle trauma or vehicle-pedestrian collision (451), fall or jump from different level (318), natural gastrointestinal disease (302), chronic use or abuse of alcohol (200), unspecified or other natural disease (198). In 2016, the top factors were: heart attack (2,618), fall or jump from same level (1,196), acute drug toxicity (715), natural disease related to the lungs (563), motor-vehicle trauma or vehicle-pedestrian collision (407), hanging (363), fall or jump from different level or height (309), natural gastrointestinal disease (253), unspecified or other natural disease (196), chronic use or abuse of alcohol (161). In 2017, top factors were: heart attack (2,475), fall or jump from same level (1,184), acute drug toxicity (913), natural disease related to the lungs (542), hanging (387), motor-vehicle trauma or vehicle-pedestrian collision (370), natural gastrointestinal disease (278), fall or jump from different level or height (255), unspecified or other natural disease (195), category undetermined (172). In 2018, top factors were: heart attack (2,192), fall or jump from same level (1,220), acute drug toxicity (854), natural disease relating to the lungs (585), hanging (393), motor-vehicle trauma or vehicle-pedestrian collision (369), natural gastrointestinal disease (264), fall or jump from different level or height (249), unspecified or other natural disease (219), category determined (191). In 2019, top factors were: heart attack (2,175), fall or jump from same level (1,289), acute drug toxicity (901), natural disease relating to the lungs (521), hanging (382), motor-vehicle trauma or vehicle-pedestrian collision (340), fall or jump from different level or height (276), natural gastrointestinal disease (268), unspecified or other natural disease (240), category undetermined (207).
Return to Top death factors from 2015 to 2019 (Men) line graph
Top death factors from 2015 to 2019 (Women): Chart showing top death factors from 2015 to 2019 for women. In 2015, top factors were: heart attack (1,449), fall or jump from same level (1,157), natural disease related to the lungs (389), acute drug toxicity (355), unspecified or other natural disease (197), motor-vehicle trauma or vehicle-pedestrian collision (179), fall or jump from different level or height (164), natural gastrointestinal disease (163), hanging (152), category undetermined (72). In 2016, top factors were: heart attack (1,554), fall or jump from same level (732), acute drug toxicity (447), natural disease related to the lungs (352), motor-vehicle trauma or vehicle-pedestrian collision (256), hanging (240), fall or jump from different level (190), natural gastrointestinal disease (165), unspecified or other natural disease (132), chronic use or abuse of alcohol (104). In 2017, top factors were: heart attack (1,515), fall or jump from same level (719), acute drug toxicity (584), natural disease related to the lungs (339), hanging (237), motor-vehicle trauma or vehicle-pedestrian collision (210), natural gastrointestinal disease (185), fall or jump from different level or height (153), unspecified or other natural disease (122), category undetermined (119). In 2018, top factors were: heart attack (1,369), fall or jump from same level (795), acute drug toxicity (477), natural disease related to the lungs (362), hanging (269), ), motor-vehicle trauma or vehicle-pedestrian collision (223), fall or jump from different level or height (184), natural gastrointestinal disease (163), unspecified or other natural disease (145), category undetermined (104). In 2019, top factors were: heart attack (1,391), fall or jump from same level (791), acute drug toxicity (541), natural disease related to the lungs (331), hanging (214), motor-vehicle trauma or vehicle-pedestrian collision (198), natural gastrointestinal disease (157), fall or jump from different level or height (156), category undetermined (127), unspecified or other natural disease (122).
Return to Top death factors from 2015 to 2019 (Women) line graph
Top death environments from 2015 to 2019 (Men): Chart showing top death environments from 2015 to 2019 for men. In 2015, top environments were: on residential property (6,241), vehicle as driver (321), urban outdoors (308), rural outdoors (167), rooming boarding or halfway house (127), inside not at a residence (121), hospital acute care ward (109), hotel or motel (98). In 2016, top environments were: on residential property (6,094), long-term care facility (482), retirement home, senior’s residence or assisted living site (393), vehicle as driver (226), hospital acute care ward (137), rural outdoors (122), inside not at a residence (120), hospital chronic, rehabilitative or palliative care (98). In 2017, top environments were: on residential property (6,081), long-term care facility (440), retirement home, senior’s residence or assisted living site (385), urban outdoors (310), vehicle as driver (238), hospital acute care ward (137), hospital intensive or critical care unit or other specialty unit (129), rooming, boarding or halfway house (120), inside not at residence (118), rural outdoors (109). In 2018, top environments were: on residential property (6,025), long-term care facility (480), retirement home, senior’s residence or assisted living site (349), urban outdoors (274), vehicle as driver (225), hospital acute care ward (138), inside not at residence (138), rooming, boarding or halfway house (131), rural outdoors (125), hospital intensive or critical care unit or other specialty unit (116). In 2019, top environments were: on residential property (5,986), long-term care facility (437), retirement home, senior’s residence or assisted living site (376), urban outdoors (298), vehicle as driver (205), hospital acute care ward (157), hospital intensive or critical care unit or other specialty unit (144), inside not at a residence (142), rooming, boarding or halfway house (113), hotel or motel (96).
Return to Top death environments from 2015 to 2019 (Men) line graph
Top death environments from 2015 to 2019 (Women): Chart showing top death environments from 2015 to 2019 for women. In 2015, top environments were: on residential property (3,852), long-term care facility (546), retirement home, senior’s residence or assisted living site (334), hospital intensive or critical care unit or other specialty unit (93), hospital acute care ward (91), urban outdoors (80), vehicle as driver (80), vehicle as passenger (59), inside not at residence (58), hospital chronic, rehabilitative or palliative care (53). In 2016, top environments were: on residential property (3,874), long-term care facility (289), retirement home, senior’s residence or assisted living site (230), urban outdoors (191), vehicle as driver (140), rural outdoors (68), inside not at a residence (67), hospital chronic, rehabilitative or palliative care (65), hospital acute care ward (62), hospital intensive or critical care unit or other specialty unit (58). In 2017, top environments were: on residential property (3,778), retirement home, senior’s residence or assisted living site (251), long-term care facility (244), urban outdoors (175), vehicle as driver (133), hospital acute care ward (112), inside not at a residence (94), hospital intensive or critical care unit or other specialty unit (80), rooming, boarding or halfway house (77), rural outdoors (76). In 2018, top environments were: on residential property (3,761), long-term care facility (284), retirement home, senior’s residence or assisted living site (245), urban outdoors (188), vehicle as driver (133), hospital acute care ward (81), hospital intensive or critical care unit or other specialty unit (79), rooming, boarding or halfway house (79), rural outdoors (78), inside not at a residence (67). In 2019, top environments were: on residential property (3,800), long-term care facility (254), retirement home, senior’s residence or assisted living site (231), urban outdoors (182), vehicle as driver (114), hospital acute care ward (104), rooming, boarding or halfway house (87), inside not at a residence (83), rural outdoors (75), hospital intensive or critical care unit or other specialty unit (69).
Return to Top death environments from 2015 to 2019 (Women) line graph