

Public Accounts 2025–26: Annual report
The annual report is a high-level summary of the fiscal year’s results. It includes financial statements, analyzes the state of the Ontario government’s finances and outlines achievements for the fiscal year.
Foreword
I am pleased to present the 2025-26 Public Accounts for the Province of Ontario. The Public Accounts provide a comprehensive record of Ontario's financial position and results, demonstrating how the government is standing up for taxpayers, protecting public resources and delivering on its mandate to protect the people of Ontario.
For the fiscal year ending March 31, 2026, Ontario recorded a deficit of $13 billion, an improvement of $1.6 billion compared to the outlook projected in the 2025 Budget. This result was supported by our strong fiscal approach and financial discipline, including stronger-than-anticipated revenues, increased income from government business enterprises, broader public sector revenues and other non-tax sources.
The Public Accounts highlight the progress our government has made in delivering on the commitments outlined in the 2025 Ontario Budget: A Plan to Protect Ontario. At a time of sustained economic uncertainty caused by increased U.S. tariffs, Ontario remains laser-focused on protecting the province’s economy while investing in the services and infrastructure that families rely on. Since April 2025, the government has announced nearly $30 billion in relief and support measures to protect Ontario workers and businesses impacted by tariffs. These measures include investments to provide training, upskilling and employment services to workers, as well as loan programs to help businesses and communities impacted by trade disruptions diversify their supply chains and trading relationships.
We are strengthening our economic foundations by supporting businesses through cutting taxes, attracting investment in high-growth industries such as artificial intelligence, advanced manufacturing and critical minerals, expanding electricity generation and transmission capacity and fostering innovation across key sectors. These efforts are helping to position Ontario as one of the most competitive jurisdictions in the G7 to invest, create jobs and do business.
Total program spending reached $220.9 billion, representing an increase of $10 billion, or 4.7 per cent, over the previous fiscal year. These investments are supporting economic growth, strengthening vital programs and services and helping Ontario’s workers, businesses and communities navigate the current economic landscape.
Protecting and strengthening public services remains a key priority. Health care spending increased by $6.6 billion, or 7.2 per cent, compared with the previous fiscal year, reflecting growing demand for OHIP-funded services, hospitals, home care, long-term care and social services. Education spending increased by $2.3 billion, or 6.1 per cent, supported by investments in child care and funding for labour agreement commitments. Infrastructure spending rose by $1.9 billion, supporting investments in hospitals, public transit, highways, broadband connectivity and housing.
At the same time, Ontario remains committed to responsible fiscal management. The government continues to carefully manage provincial finances while maintaining the flexibility to respond to emerging challenges and support economic growth. This balanced approach is helping to create the conditions for a stronger and more resilient economy while ensuring the sustainability of public services. The government implemented an agency hiring freeze in 2025 that has avoided nearly $300 million in costs to the public and cut consultant usage by 20 per cent.
We stand behind our record of responsible fiscal management, including nine consecutive clean audit opinions, two independent credit rating upgrades and transforming the Ontario Public Service into the leanest civil service in the country. By maintaining a strong fiscal foundation, we are better positioned to protect Ontario's economy, public services and long-term prosperity, while reducing borrowing costs and enabling greater investment in the infrastructure and programs people rely on every day.
The results presented in the 2025-26 Public Accounts demonstrate Ontario's commitment to building a more competitive, resilient and self-reliant economy while protecting jobs, supporting businesses and delivering the public services that Ontarians depend on.
Original signed by:
The Honourable Kinga Surma
President of the Treasury Board
Introduction
The Annual Report is a key element of the Public Accounts of the Province of Ontario and is central to demonstrating the Province’s transparency and accountability in reporting its financial activities and position. Ontario’s Consolidated Financial Statements present the financial results for the 2025–26 fiscal year against the 2025 Budget released on May 15, 2025, and the financial position of the government as of March 31, 2026. As in previous years, the Annual Report also compares the current year’s results to the prior year’s results and provides a five-year trend analysis for many key financial ratios.
Producing the Public Accounts of Ontario requires the teamwork and collaboration of many stakeholders across Ontario’s public sector. The Office of the Auditor General plays a critical role in auditing and reporting on the Province’s Consolidated Financial Statements, and the Standing Committee on Public Accounts also plays an important role in providing legislative oversight and guidance. I would like to thank everyone for their contributions and collaboration.
We welcome your comments on the Public Accounts. Please share your thoughts by email to infoTBS@ontario.ca.
Original signed by:
Carlene Alexander, CPA, CGA, MBA
Deputy Minister, Treasury Board Secretariat
Secretary of the Treasury Board and Management Board of Cabinet
Statement of Responsibility
The Consolidated Financial Statements are prepared by the Government of Ontario in accordance with the accounting principles for governments issued by the Public Sector Accounting Board (PSAB).
The Consolidated Financial Statements are audited by the Auditor General of Ontario in accordance with the Auditor General Act, and with Canadian generally accepted assurance standards. The Auditor General expresses an independent audit opinion on these Consolidated Financial Statements. Her report, which appears on pages 43-47, provides her audit opinion and the basis for this opinion.
Management prepares the Consolidated Financial Statements in accordance with generally accepted accounting principles for the public sector. Management is also responsible for maintaining systems of financial management and internal controls to provide reasonable assurance that transactions recorded in the Consolidated Financial Statements are within statutory authority, assets are properly safeguarded, and reliable financial information is available for preparation of these Consolidated Financial Statements.
Original signed by:
Carlene Alexander, CPA, CGA, MBA
Deputy Minister,
Treasury Board Secretariat
August 28, 2026
Original signed by:
Gadi Mayman
Acting Deputy Minister,
Ministry of Finance
August 28, 2026
Original signed by:
Beili Wong, FCPA, FCA
Comptroller General,
Office of the Comptroller General
Treasury Board Secretariat
August 28, 2026
Original signed by:
Khalida Noor, CPA, CA
Assistant Deputy Minister and Provincial Controller,
Treasury Board Secretariat
August 28, 2026
The Government of Ontario is responsible for the Consolidated Financial Statements and accepts responsibility for the objectivity and integrity of these Consolidated Financial Statements and the Financial Statement Discussion and Analysis. Those charged with governance are responsible for overseeing the Government of Ontario’s financial reporting process.
Original signed by:
The Honourable Peter Bethlenfalvy
President of the Treasury Board
Minister of Finance
August 28, 2026
Financial Statement Discussion and Analysis
Highlights
Table 1
2025–26 Financial Highlights
($ Billions)
| Item | 2025 Reclassified Budget | 2025–26 Actual | 2024–25 Restated Actual | Change from 2025 Reclassified Budget | Change from 2024–25 Restated Actual |
|---|---|---|---|---|---|
| Total Revenue | 218.6 | 223.3 | 224.9 | 4.7 | (1.6) |
| Expense Programs | 215.0 | 220.9 | 210.9 | 5.8 | 10.0 |
| Interest and Other Debt Servicing Charges | 16.2 | 15.5 | 15.1 | (0.7) | 0.3 |
| Total Expense | 231.2 | 236.3 | 226.0 | 5.1 | 10.3 |
| Reserve | 2.0 | – | – | (2.0) | – |
| Annual Deficit | (14.6) | (13.0) | (1.1) | 1.6 | (11.9) |
| Item | 2025–26 Actual | 2024–25 Restated Actual | Change from 2024–25 Restated Actual |
|---|---|---|---|
| Financial Assets | 144.9 | 144.2 | 0.7 |
| Liabilities | 599.9 | 571.2 | 28.7 |
| Net Debt | (455.0) | (427.1) | (27.9) |
| Non-Financial Assets | 197.0 | 180.0 | 17.0 |
| Accumulated Deficit | (258.0) | (247.1) | (11.0) |
| Item | 2025–26 Actual | 2024–25 Restated Actual | Change from 2024–25 Restated Actual |
|---|---|---|---|
| Accumulated Operating Deficit | (261.9) | (249.2) | (12.7) |
| Accumulated Remeasurement Gains | 3.9 | 2.2 | 1.7 |
Note: Numbers may not add due to rounding.
Financial highlights
Change from 2024–25 Actuals
- The Ontario government recorded a $13.0 billion deficit for the fiscal year ended March 31, 2026, compared to the previous year’s deficit of $1.1 billion. The $11.9 billion increase in annual deficit is mainly due to higher program expenses and lower revenues (see Table 1 above).
- Total revenues were $223.3 billion, a decrease of $1.6 billion or 0.7 per cent from the previous year. The decline was largely attributable to the one-time revenue recognized in 2024–25 from the tobacco legal settlement and lower revenues reported by the broader public sector (BPS). These decreases were partially offset by higher taxation revenues reflecting a growing economy and increased transfers from the Government of Canada. See details on pages 9-10.
- Total program expenses for 2025–26 increased by $10.0 billion or 4.7 per cent, from $210.9 billion in the previous fiscal year to $220.9 billion.
- Health sector, mainly due to increased utilization and costs for health care services, including for the Ontario Health Insurance Plan (OHIP) and operating costs for the delivery of health care through hospitals and home care;
- Education sector, mainly due to the continued implementation of the Canada-wide Early Learning and Child Care Agreement and funding to support commitments consistent with labour agreements;
- Children’s and social services sector, mainly due to growing demand for social assistance and continued investments to support individuals with special needs and survivors of gender-based violence; and
- Justice sector, mainly due to investments in essential service delivery for public safety, including Ontario Provincial Police, First Nations policing, corrections, and Legal Aid Ontario.
- Interest and other debt servicing charges was higher than the previous year by $0.3 billion, or 2.2 per cent, as a result of an increase in the total amount of debt outstanding and a higher effective interest rate. See details on page 21.
- Non-financial assets increased by $17.0 billion from the previous year, mainly due to an increase of $16.7 billion in the net book value of Ontario’s capital assets, such as buildings and transportation infrastructure.
- Total infrastructure expenditure increased by $1.9 billion from the previous year, including increased spending in hospital infrastructure and investments in municipal infrastructure programs. Ontario invested $25.6 billion in assets owned by the government and its consolidated entities, which reflect new capital investments and repairs to existing assets. The government also made $5.5 billion in transfers to non-consolidated partners and other infrastructure expenditures. See details on page 26.
- Total liabilities increased by $28.7 billion and total financial assets increased by $0.7 billion, resulting in an increase of $27.9 billion or 6.5 per cent in net debt from the previous year (see details on page 27). The increase of liabilities is mainly due to an increase in debt. The increase of financial assets is mainly due to an increase in investment in Government Business Enterprises (GBEs) and loans receivable, offset by a decrease in accounts receivable, cash and cash equivalents and derivative assets. The accumulated deficit increased by $11.0 billion, or 4.4 per cent, from the previous year mainly as a result of $12.7 billion increase in operating deficit offset by $1.7 billion increase in accumulated remeasurement gains.
Change from the 2025 Budget
- The Ontario government recorded a $13.0 billion deficit for the fiscal year ended March 31, 2026, compared to a forecasted deficit of $14.6 billion in the 2025 Budget, resulting mainly from higher income from GBEs, higher other non-tax revenue, and lower interest and other debt servicing charges, which is partially offset by higher program expenses due to higher demands and distribution of programs and services. (See Table 1 above).
- Total revenues of $223.3 billion were $4.7 billion or 2.2 per cent higher than planned in the 2025 Budget, mainly due to:
- Stronger-than-expected income from GBEs;
- Higher revenues reported by ministries and consolidated government organizations, as well as the BPS;
- Higher taxation revenue based on updated tax assessment data from the Canada Revenue Agency (CRA), reflecting stronger-than-expected economic growth in 2025; and
- Higher transfers from the Government of Canada.
See details on page 11.
Total program expenses of $220.9 billion were $5.8 billion or 2.7 per cent higher than the 2025 Budget. Program expenses are higher in the:
- Health sector, mainly due to increased physician compensation costs, increased demand in utilization-driven programs and increased hospital spending;
- Postsecondary education sector, mainly due to higher-than-forecasted uptake in student financial assistance;
- Children’s and social services sector, mainly due to higher-than-budgeted demand for social assistance programs, as well as increased supports for children and youth; and
- Justice sector, mainly due to investments in essential service delivery including correctional services, First Nations policing, the Ontario Provincial Police, and courts, as well as legal settlement costs.
These are partially offset by lower program expenses in the Education sector, mainly due to lower-than-projected student enrolment; in alignment with demographic trends.
See details on page 18.
- Interest and other debt servicing charges were lower than the 2025 Budget by $0.7 billion, or 4.6 per cent, due to lower interest costs on debt outstanding, and higher interest income from Ontario’s holdings of its own investments. See details on page 21.
Analysis of 2025–26 Results
Revenue
| Revenue | 2025 Reclassified Budget | 2025–26 Actual | 2024–25 Restated Actual | Change from 2025 Reclassified Budget | Change from 2024–25 Restated Actual |
|---|---|---|---|---|---|
| Personal Income Tax | 57.8 | 57.0 | 55.7 | (0.8) | 1.3 |
| Sales Tax | 40.1 | 39.3 | 39.4 | (0.8) | (0.1) |
| Corporations Tax | 26.0 | 28.3 | 27.8 | 2.3 | 0.5 |
| Employer Health Tax | 8.2 | 8.3 | 7.8 | 0.1 | 0.5 |
| Education Property Tax | 5.9 | 6.0 | 5.9 | 0.1 | 0.1 |
| Ontario Health Premium | 5.4 | 5.2 | 5.2 | (0.2) | (0.1) |
| Gasoline and Fuel Tax | 2.2 | 2.3 | 2.2 | 0.1 | 0.1 |
| Other Taxes | 7.0 | 6.7 | 6.3 | (0.3) | 0.4 |
| Total Taxation Revenue | 152.4 | 153.0 | 150.3 | 0.6 | 2.7 |
| Transfers from Government of Canada | 38.8 | 39.1 | 36.6 | 0.3 | 2.5 |
| Fees, Donations and Other Revenues from Broader Public Sector Organizations | 10.9 | 12.0 | 14.7 | 1.1 | (2.8) |
| Income from Investment in Government Business Enterprises | 6.3 | 7.7 | 7.5 | 1.4 | 0.3 |
| Interest and Investment Income | 2.0 | 2.1 | 2.8 | 0.2 | (0.6) |
| Other Non-Tax Revenue | 8.2 | 9.4 | 13.1 | 1.2 | (3.7) |
| Total Revenue | 218.6 | 223.3 | 224.9 | 4.7 | (1.6) |
Note: Numbers may not add due to rounding.
Change from 2024–25 Actuals
Total revenues for 2025–26 decreased by $1.6 billion or 0.7 per cent from the previous year.
- Taxation revenue increased by $2.7 billion or 1.8 per cent in 2025–26, supported by nominal Gross Domestic Product (GDP) growth of 4.1 per cent in 2025. The increase was primarily driven by higher Personal Income Tax (PIT) and Corporations Tax (CT) revenues, but partially offset by the impact of Bill C-15 (Budget 2025 Implementation Act, No. 1), enacted by the federal government on March 26, 2026, which included several accelerated capital cost allowance measures.
- Transfers from Government of Canada increased by $2.5 billion or 6.8 per cent in 2025–26, mostly reflecting higher transfers from major federal funding programs, including the Canada Health Transfer, Canada Social Transfer, and support for Canada-wide Early Learning and Child Care.
- Fees, donations and other revenues from BPS organizations decreased by $2.8 billion or 18.7 per cent in 2025–26, mainly due to lower third-party revenue from colleges reflecting declines in international student tuition fees and the wind-down of public college-private partnerships.
- Income from GBEs increased by $0.3 billion or 3.4 per cent in 2025–26. This performance was primarily driven by higher net income from Ontario Power Generation (OPG), Hydro One Ltd. (HOL), the Ontario Lottery and Gaming Corporation (OLG) and iGaming Ontario (iGO). These gains were partially offset by a decline in net income from the Liquor Control Board of Ontario (LCBO).
- Interest and investment income decreased by $0.6 billion or 22.9 per cent in 2025–26, mainly due to lower interest rates earned on investments.
- Other non-tax revenue decreased by $3.7 billion or 28.1 per cent in 2025–26, mainly due to one-time revenue from the tobacco legal settlement recognized in 2024–25 and lower recoveries of prior-year expenditures reported by ministries and consolidated government organizations.
Change from the 2025 Budget
Revenues for 2025–26 were $4.7 billion or 2.2 per cent higher than expected in the 2025 Budget.
- Taxation revenues were $0.6 billion or 0.4 per cent higher than forecast in the 2025 Budget, primarily due to stronger-than-expected CT revenues based on updated CRA assessment data for 2025 and prior years. This was partially offset by lower-than-expected PIT and Ontario Health Premium (OHP) revenues, reflecting updated CRA assessment data for 2025 and prior years, as well as weaker Harmonized Sales Tax (HST) revenues resulting from lower federal estimates for 2026 and prior years. Taxation revenues were also moderated by the enactment of Bill C-15 by the federal government on March 26, 2026, which included several accelerated capital cost allowance measures.
- Transfers from the Government of Canada were $0.3 billion or 0.7 per cent higher, mainly due to higher transfers to hospitals and funding for evacuation support services to First Nation communities affected by floods and wildfires. This was partially offset by the reprofiling of funding under the Canada-wide Early Learning and Child Care Agreement.
- Fees, donations, and other revenues from BPS were $1.1 billion or 10.1 per cent higher, mainly due to higher-than-expected third-party revenue from hospitals reflecting higher revenue from fees, ancillary services, donations, research grants, and other miscellaneous revenues.
- Income from GBEs was $1.4 billion or 22.2 per cent higher, mainly reflecting higher-than expected net income from OPG, HOL, iGaming and the Ontario Cannabis Store (OCS). This was partially offset by lower net income from the OLG and the LCBO.
- Interest and investment income was $0.2 billion or 10.0 per cent higher than forecast, mainly due to higher interest and investment income from BPS organizations.
- Other non-tax revenues were higher by $1.2 billion or 14.2 per cent, mainly reflecting higher-than-expected recoveries of prior-year expenditures, revenue from fees, licences, permits, and other miscellaneous revenues reported by ministries and consolidated government organizations.
Revenue trend
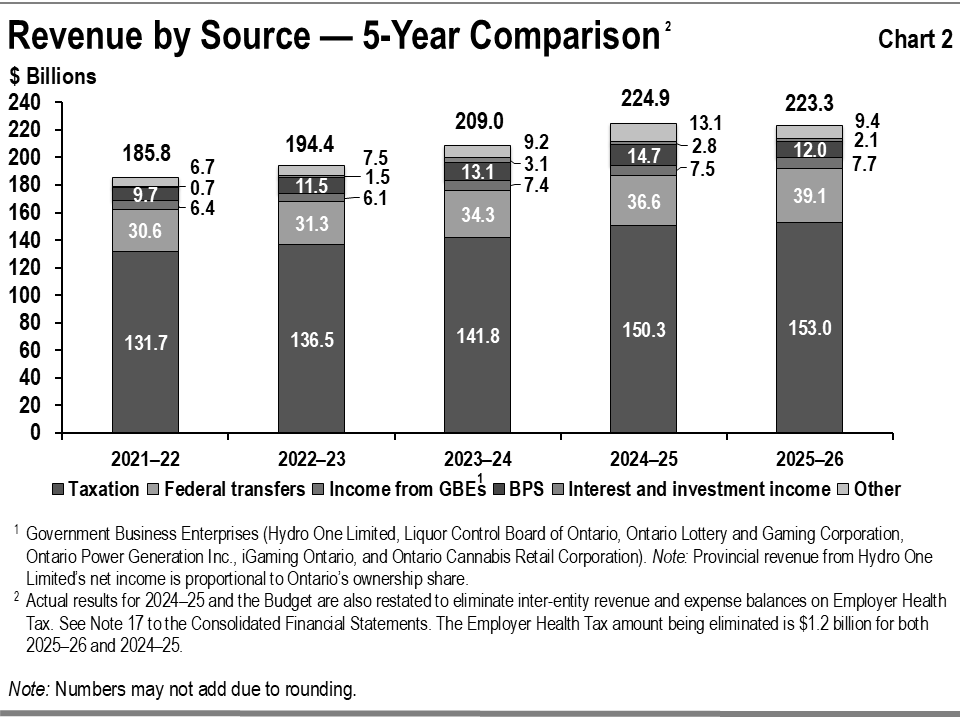
Chart 2 shows the recent trends in revenue for Ontario’s major revenue sources.
Taxation revenue
Between 2021–22 and 2025–26 taxation revenue grew at an average annual rate of 3.8 per cent, lower than the average annual rate of nominal GDP growth of 6.5 per cent.
Although economic growth and taxation revenue growth are closely linked, the relationship is affected by several factors, including but not limited to:
- Growth in some revenue sources, such as CT, which can diverge significantly from economic growth in any given year due to the inherent volatility of business profits, as well as the use of tax provisions, such as the option to carry losses forward or backward;
- The impact of housing completions and resales on HST and Land Transfer Tax revenue, which is proportionately greater than their contribution to GDP; and
- Changes in volume-based gasoline and fuel taxes, which are more closely aligned to growth in real GDP as opposed to nominal GDP since these revenue sources are not directly influenced by price changes.
Federal government transfers
Between 2021–22 and 2025–26, Government of Canada transfers grew at an annual average rate of 6.3 per cent. These include major federal transfers such as the Canada Health Transfer, Canada Social Transfer and Equalization. There are also a number of federal transfers to the Province which are largely program-specific, such as Canada-wide Early Learning and Child Care, Shared Health Priorities, Infrastructure and Labour Market Development. Some transfers are ongoing while others are time-limited.
Fees, donations and other revenues from BPS
Between 2021–22 and 2025–26 revenue from BPS increased at an average annual rate of 5.4 per cent. This increase mainly reflects strong growth in third-party revenue from hospitals and school boards, while third-party revenue from colleges declined sharply in 2025–26 due to lower international student enrolment.
Income from Government Business Enterprises
Income from GBEs includes OPG, HOL, LCBO, OLG, OCS and iGO.
Between 2021–22 and 2025–26, income from GBEs increased at an annual average rate of 4.6 percent.
Interest and investment income
Interest and investment income refers to all interest and investment income earned from third parties.
Interest and investment income increased at an annual average rate of 31.5 per cent from 2021–22 to 2025–26.
Other non-tax revenues
Other non-tax revenues arise from a number of sources, including the sale and rental of goods and services; fees, licences, and permits; reimbursements for provincial expenditures related to specific service delivery; royalties from the use of Crown resources; and recoveries from power supply contracts.
Other non-tax revenues increased at an annual average rate of 8.7 per cent between 2021–22 and 2025–26.
Expense
| Expense | 2025 Reclassified Budget | 2025–26 Actual | 2024–25 Restated Actual | Change from 2025 Reclassified Budget | Change from 2024–25 Restated Actual |
|---|---|---|---|---|---|
| Health sector | 90.6 | 97.5 | 90.9 | 6.9 | 6.6 |
| Education sector | 40.5 | 40.1 | 37.8 | (0.3) | 2.3 |
| Postsecondary education sector | 12.9 | 13.9 | 14.1 | 1.0 | (0.2) |
| Children’s and social services sector | 20.3 | 21.4 | 20.5 | 1.0 | 0.9 |
| Justice sector | 6.7 | 7.2 | 7.1 | 0.6 | 0.1 |
| Other programs | 44.0 | 40.7 | 40.5 | (3.3) | 0.2 |
| Total Program Expense | 215.0 | 220.9 | 210.9 | 5.8 | 10.0 |
| Interest and Other Debt Servicing Charges | 16.2 | 15.5 | 15.1 | (0.7) | 0.3 |
| Total Expense | 231.2 | 236.3 | 226.0 | 5.1 | 10.3 |
| Reserve | 2.0 | – | – | (2.0) | – |
Note: Numbers may not add due to rounding.
Change from 2024–25 Actuals
Total program expenses for 2025–26 increased by $10.0 billion or 4.7 per cent, from $210.9 billion in the previous fiscal year to $220.9 billion.
- Health sector expense increased by $6.6 billion or 7.2 per cent over the previous fiscal year, mainly due to;
- $1.8 billion increase in OHIP services due to increased access, utilization and cost of physician services;
- $1.5 billion increase in spending by hospitals for the delivery of health care services and programming;
- $1.3 billion increase across health programs, including higher utilization of drug programs, growth in cancer services, enhanced municipal ambulance operations, as well as increased investments in training and education programs;
- $1.1 billion increase in the hospital sector due to investments to support hospital operational needs;
- $0.5 billion increase in home care spending due to investments to support increased home care volumes, palliative care and hospital to home programs; and
- $0.3 billion increase in additional long-term care capital development initiatives and staffing to improve quality of care in the long-term care sector.
- Education sector expenses increased by $2.3 billion or 6.1 per cent over the previous fiscal year, mainly due to the continued implementation of the Canada-wide Early Learning and Child Care Agreement and funding to support commitments consistent with labour agreements;
- Postsecondary education sector expenses decreased by $0.2 billion or 1.2 per cent over the previous fiscal year, mainly due to lower college sector spending driven by the federal government cap on international students, partially offset by increased spending on student financial assistance due to higher uptake;
- Children’s and social services sector expenses increased by $0.9 billion or 4.2 per cent over the previous fiscal year, primarily due to growing demand for social assistance, continued investments to expand access to services for individuals with special needs and survivors of gender-based violence, and additional funding to support annual inflationary increases for the Ontario Disability Support Program and the Assistance for Children with Severe Disabilities Program;
- Justice sector expenses increased by $0.1 billion or 2.0 per cent over the previous fiscal year. This is mainly due to investments in essential service delivery for public safety, including Ontario Provincial Police, First Nations policing, corrections, and Legal Aid Ontario; and
- Other programs expenses increased by $0.2 billion or 0.6 per cent over the previous fiscal year, which represents an overall expense consistent with prior year spending. This includes higher spending for various ministry programs such as, Electricity Price Mitigation and the Municipal Housing Infrastructure Program.
See Chart 3 for details of program expenses by sector.
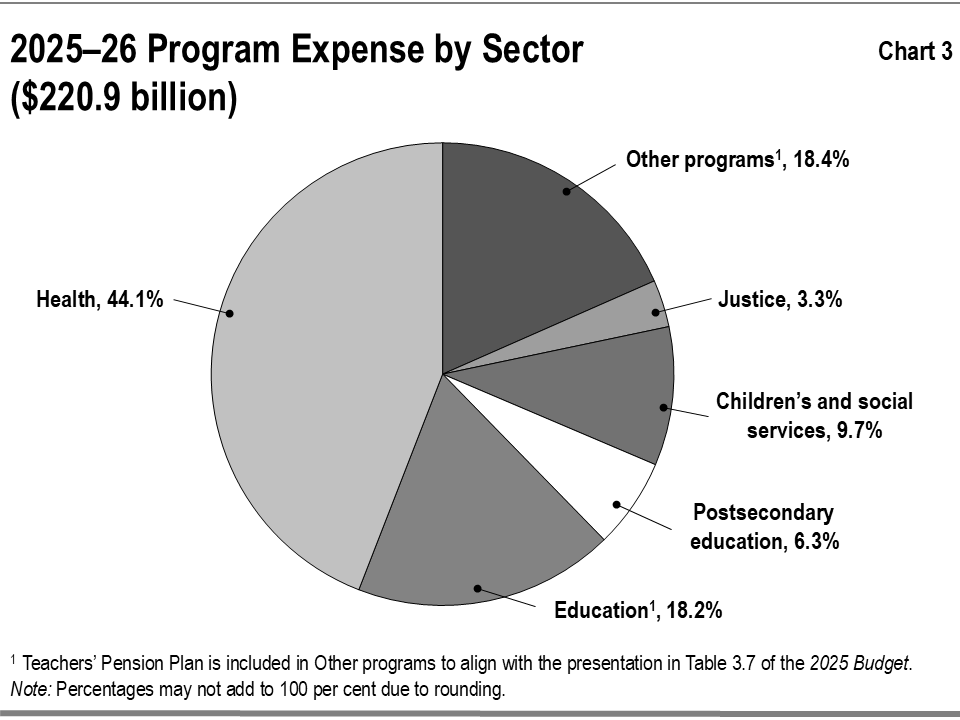
Chart 4 shows spending by type of expense. Government spending related to salaries and benefits includes those expenses for organizations consolidated as part of the government reporting entity, including hospitals, school boards, colleges and children’s aid societies, as well as the Ontario Public Service.
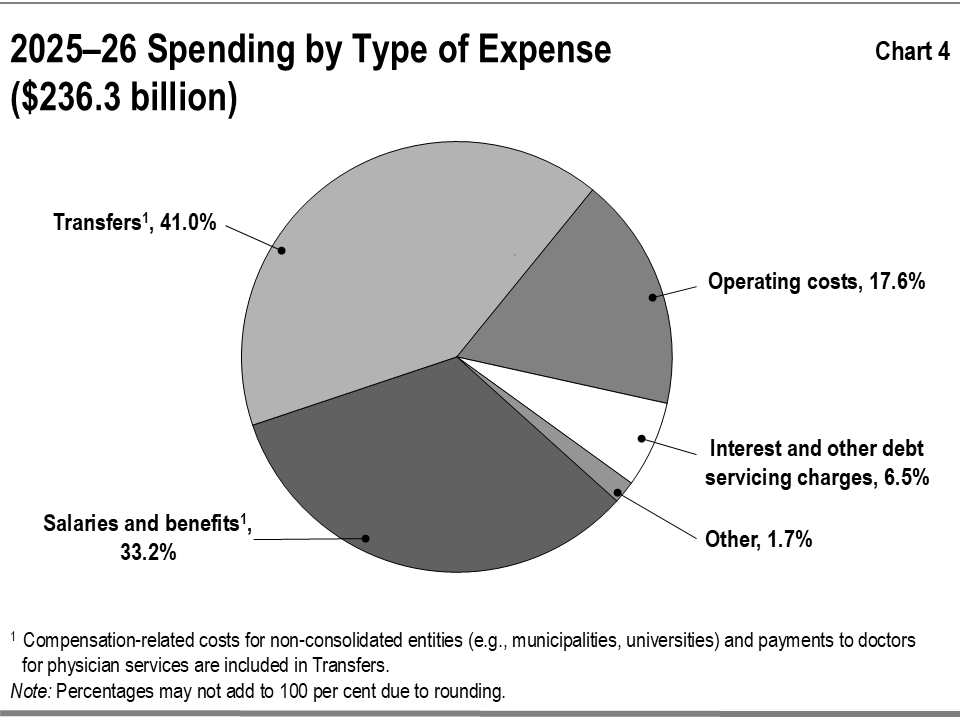
The expense labelled “Transfers” in Chart 4 reflects payments to a variety of service providers that support the delivery of public services. These third-party funding recipients consist of health care professionals including physicians, social service agencies, universities, child care providers and municipalities. As service providers, a large share of the spending of these third parties typically goes to salaries and benefits, i.e., compensation-related costs. Transfers do not include transfers to hospitals, school boards, colleges, and children’s aid societies. These are reflected in expense types such as operating costs and salaries and benefits, as reported by the organizations.
Change from the 2025 Budget
Total program spending for 2025–26 was $220.9 billion, which is $5.8 billion or 2.7 per cent higher than in the 2025 Budget. Higher program spending was primarily attributed to the following factors:
- Health sector expense was $6.9 billion or 7.6 per cent above plan, mainly due to increased physician compensation costs, increased demand in utilization-driven programs including OHIP and Ontario Public Drug Programs, and home care, as well as increased spending primarily by hospitals to address operational pressures;
- Postsecondary education sector expense was $1.0 billion or 7.8 per cent above plan, mainly due to higher-than-forecasted uptake in student financial assistance;
- Children’s and social services sector expense was $1.0 billion or 5.1 per cent above plan, primarily due to increased demand for Ontario Works and the Ontario Disability Support Program, as well as additional investments in child welfare and to support children and youth with special needs; and
- Justice sector expense was $0.6 billion or 8.4 per cent above plan, primarily due to investments in essential service delivery including correctional services, First Nations policing, the Ontario Provincial Police, and courts, as well as legal settlement costs.
These are partially offset by:
- Other programs expense was $3.3 billion or 7.5 per cent below plan, primarily due to updated construction schedules for high-speed internet projects, lower-than-forecasted spending in demand-driven employment and training programs, and updated industrial land development and strategic investment project schedules. This also reflects budgeted allocations of $3.0 billion for the contingency fund that were used during the fiscal year to fund program expenses in various sectors for emerging needs and unforeseen events; and
- Education sector expense was $0.3 billion or 0.9 per cent below plan, primarily due to lower-than-projected student enrolment in alignment with demographic trends.
Expense Trend
Chart 5 shows the recent trends in spending for major program areas.
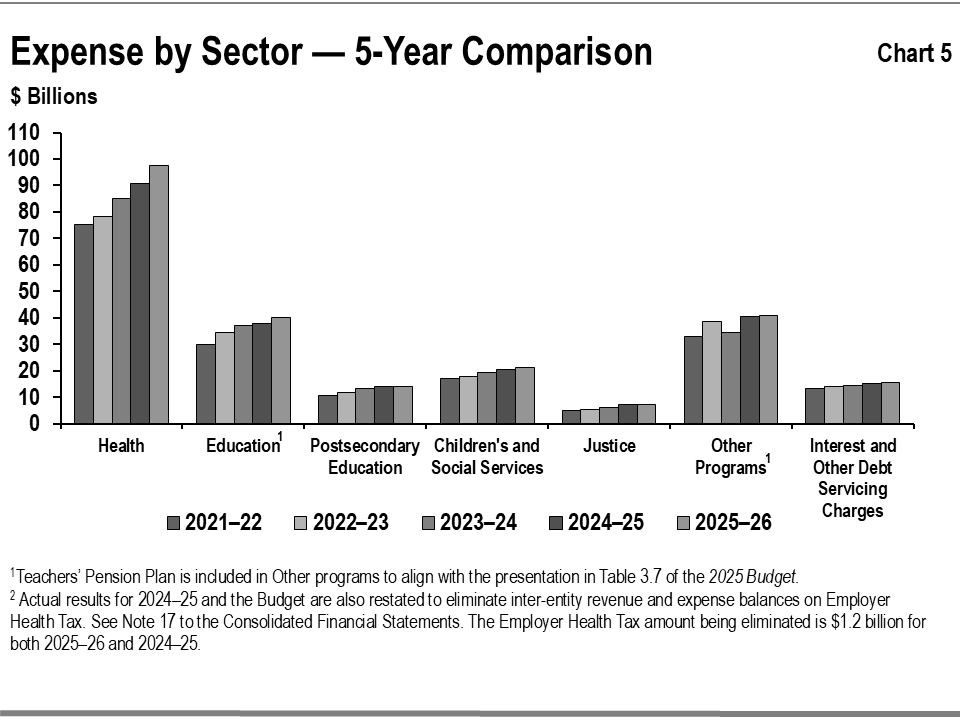
- Health sector expense increased from $75.4 billion in 2021–22 to $97.5 billion in 2025–26, or on average by 6.6 per cent per year. The increase includes:
- Support for Ontario hospitals to address operational and compensation pressures and respond to growing demand for hospitals;
- Investments to address growing demand for physician services through the OHIP, including higher access, utilization and physician compensation costs;
- Utilization growth in the Ontario Drug Benefit Program and New Drug Funding Program to improve access to drug treatments and therapies;
- Increased utilization of home and community care services, demonstrating progress toward a more integrated and efficient healthcare system by bringing care closer to home while freeing hospital capacity;
- Additional funding to improve access to mental health and addictions services, cancer services, and other priority health programs; and
- Support for long-term care homes through increased investments in direct hours of care through staffing, operations, and capital development programs to address sector waitlists and advance construction of new and redeveloped beds.
- Education sector expense increased from $29.9 billion in 2021–22 to $40.1 billion in 2025–26, or on average by 7.6 per cent per year. The increase is mainly due to:
- Implementing the Canada-wide Early Learning and Child Care Agreement;
- Building, expanding and renewing schools to provide students with modern learning spaces; and
- Providing funding to support commitments consistent with labour agreements.
- Postsecondary education sector expense increased from $10.6 billion in 2021–22 to $13.9 billion in 2025–26, or on average by 7.0 per cent per year. This increase is mainly due to higher uptake for student financial assistance, funding to support postsecondary institutions through the Postsecondary Education Sustainability Fund and investments in program seats to improve labour market alignment in priority sectors, such as health human resources and science, technology, engineering and mathematics (STEM).
- Children’s and social services sector expenses increased from $16.9 billion in 2021–22 to $21.4 billion in 2025–26, or on average by 6.1 per cent per year. This increase primarily reflects:
- Higher social assistance funding to address demand;
- Increases to the monthly core allowances for the Ontario Disability Support Program and the maximum monthly amount for the Assistance for Children with Severe Disabilities Program; and
- Increased investments to support children with special needs, adults with developmental disabilities and survivors of gender‑based violence and human trafficking.
- Justice sector expense increased from $4.9 billion in 2021–22 to $7.2 billion in 2025–26, or on average by 10.2 per cent per year. The increase is primarily due to investments in essential service delivery for public safety including First Nations policing, courts, Legal Aid Ontario, correctional institutions, and fire protection services, as well as legal settlement costs.
- Other programs expenses increased from $32.8 billion in 2021–22 to $40.7 billion in 2025–26, or on average by 5.6 per cent per year. This increase primarily reflects spending on transit investments, the Municipal Housing Infrastructure Program, as well as increased emergency evacuation support services for First Nation communities.
Interest and Other Debt Servicing Charges
Interest and other debt servicing charges expense increased from $15.1 billion in 2024–25 to $15.5 billion in 2025–26, primarily as a result of an increase in the total amount of debt outstanding.
Interest and other debt servicing charges expense was $0.7 billion lower than the forecast in the 2025 Budget, due to lower interest costs on debt outstanding and higher interest income from Ontario’s holdings of its own investments.
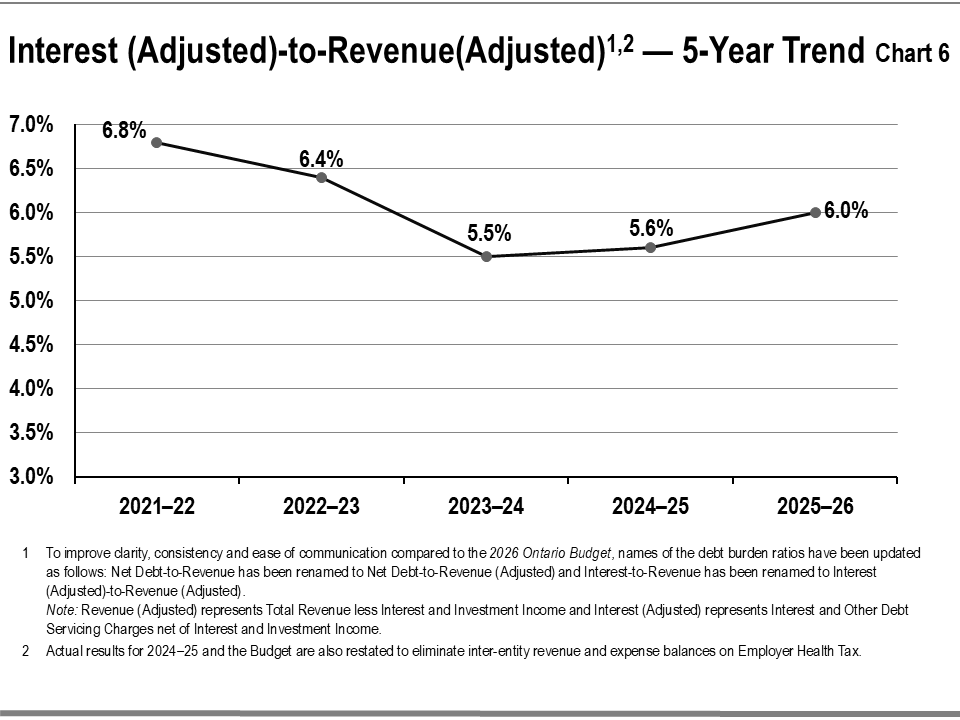
Chart 6 shows that the ratio of Interest (Adjusted)-to-Revenue (Adjusted) has fallen for Ontario over the period between 2021–22 to 2025–26, from a high of 6.8 per cent in 2021–22 to the current level of 6.0 per cent. The increase from 5.6 per cent in 2024–25 to 6.0 per cent in 2025–26 is due to the increase in interest expense resulting from higher total debt outstanding and slightly lower revenue.
Statement of financial position analysis
Financial assets
| Item | 2025–26 Actual | % of Total | 2024–25 Actual | % of Total | Variance Increase (Decrease) |
|---|---|---|---|---|---|
| Cash and cash equivalents | 32.2 | 22.2% | 33.9 | 23.5% | (1.6) |
| Portfolio investments | 31.9 | 22.0% | 32.3 | 22.4% | (0.4) |
| Accounts receivable | 20.7 | 14.3% | 22.8 | 15.8% | (2.2) |
| Loans receivable | 13.4 | 9.3% | 12.1 | 8.4% | 1.4 |
| Derivative assets | 5.2 | 3.6% | 6.1 | 4.2% | (0.9) |
| Other assets | 1.4 | 1.0% | 1.0 | 0.7% | 0.4 |
| Investment in Government Business Enterprises | 40.1 | 27.7% | 36.0 | 25.0% | 4.1 |
| Total Financial Assets | 144.9 | 100.0% | 144.2 | 100% | 0.7 |
Note: Numbers may not add due to rounding.
Financial assets consist of items that include cash and cash equivalents and portfolio investments that are available to the government to meet its expenditure needs; accounts and loans receivable, which are amounts it expects to receive from third parties; and other items including derivative assets and investment in GBEs.
Total financial assets increased by $0.7 billion in 2025–26 over the prior fiscal year (see Table 4). The increase was attributable to a:
- $4.1 billion increase in investment in GBEs, mainly due to a net income increase from OPG and capital contribution from the Province to OPG ; and
- $1.4 billion increase in loans receivable, mainly due to increased loans to students, municipalities, and other public sector entities.
These increases in 2025–26 are partially offset by:
- $2.2 billion decrease in accounts receivable, mainly due to decrease in Harmonized Sales Tax, Personal Income Tax, and Corporate Tax receivables;
- $1.6 billion decrease in cash and cash equivalents, mainly due to higher cash applied to operating, capital and investing transactions than the cash provided by the financing transactions; and
- $0.9 billion decrease in derivative assets, mainly driven by the year-end revaluation of existing contracts.
Chart 7 shows the recent trends in financial assets for the government.
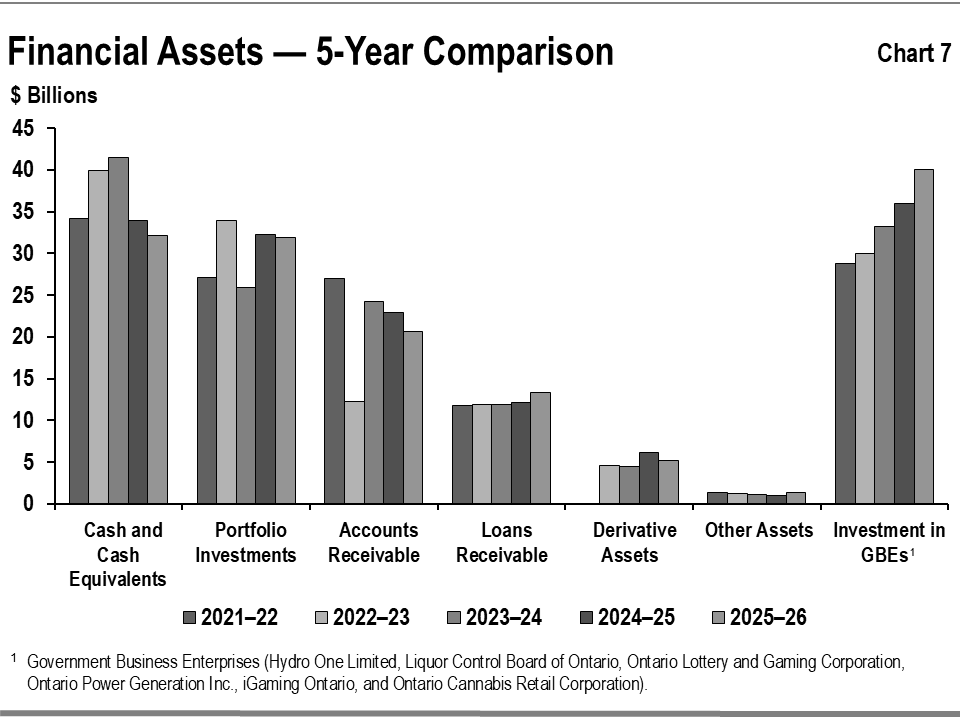
The level of financial assets, including cash, accounts receivable and portfolio investments tends to be more variable, since these assets year-over-year often reflect specific circumstances at the fiscal year-end, such as pre-borrowing for the following period’s needs.
Total investment in GBEs has increased relatively steadily since 2021—22. The net increases were mainly due to the increases in net assets in GBEs, including OPG net income and investment earnings from the Ontario Nuclear Funds for nuclear waste management and decommissioning. The increase in 2025–26 is slightly higher than before due to capital contribution in OPG from the Province.
Tangible capital assets
The government is responsible for a large portfolio of non-financial assets, which is almost entirely made up of tangible capital assets.
Tangible capital assets owned by the government and its consolidated entities represent the largest component of Ontario’s infrastructure investments. These assets include those it owns directly, such as provincial highways, transit systems, as well as the assets of hospitals, school boards, colleges, children’s aid societies, and agencies that are consolidated in its financial statements. The assets of GBEs are reflected in Ontario’s Consolidated Statement of Financial Position as an investment in GBEs under financial assets.
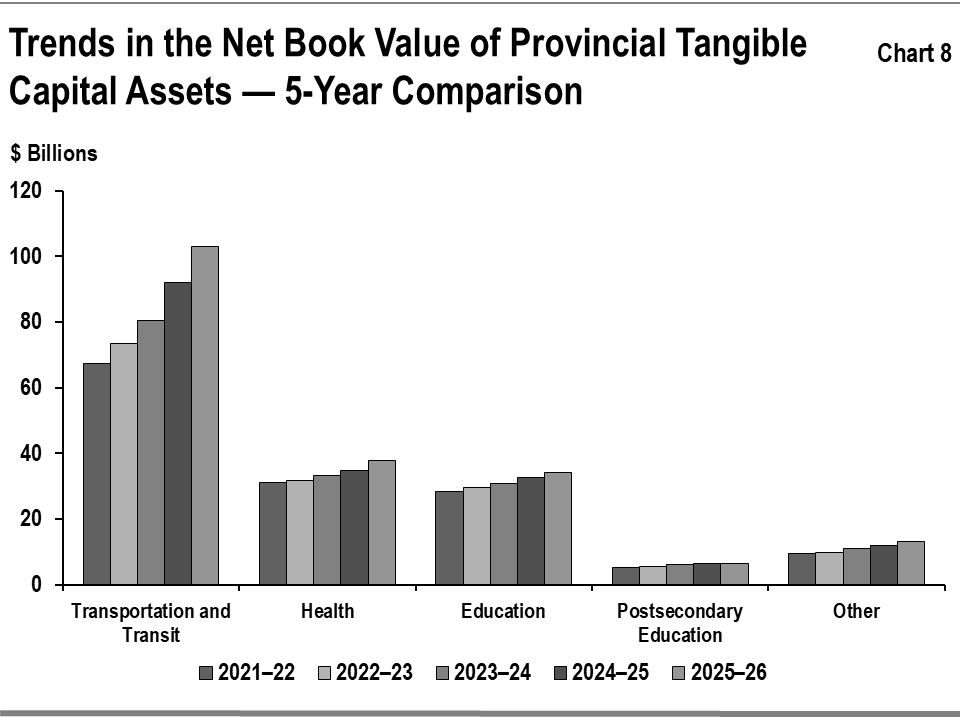
The reported net book value of Ontario’s tangible capital assets was $194.5 billion in 2025–26, increasing by $16.7 billion, or 9.4 per cent over the prior fiscal year. Buildings, including hospitals, schools and college facilities, make up the single largest share at $86.6 billion in aggregate. The total on the Consolidated Statement of Financial Position also includes assets under construction, some of which are being built using the public private partnership (P3) model, in which the private sector finances the assets during construction. The impacts of P3s on liabilities are discussed in the Other Long-term Financing section.
Growth in the net book value of capital assets has averaged 8.3 per cent annually over the period between 2021–22 and 2025–26. Most of the growth has been in new and rehabilitated buildings and transportation infrastructure including provincial highways and bridges, and the transit network owned by Metrolinx, an agency of the government.
See Chart 8 for the recent trends in the net book value of provincial tangible capital assets by sector.
Infrastructure expenditures
Ontario’s infrastructure spending in 2025–26 was $31.1 billion (see Table 5). This includes $25.6 billion invested in assets owned by the government and its consolidated entities as discussed in the Tangible Capital Assets section, and $5.5 billion provided for capital investment to non-consolidated partners such as universities and municipalities, as well as other infrastructure expenditures.
Total infrastructure spending in 2025–26 was $1.9 billion higher than the previous year, driven by increased expenditures in the Health and Other sectors, including increased spending in hospital infrastructure and investments in municipal infrastructure programs, partially offset by lower spending in the Education and Postsecondary education sectors.
Infrastructure expenditure spending was below the $35.0 billion forecast in the 2025 Budget, mainly due to lower expenditures in the Education, Postsecondary education, and Other sectors, primarily due to revised project timelines. This lower spending was partially offset by higher spending on Transportation and transit, and hospital projects.
| Sector | Investment in Capital Assets | Transfers and Other Infrastructure Expenditures | Total Infrastructure Expenditures | 2025 Budget Total Infrastructure Expenditures |
|---|---|---|---|---|
| Transportation and transit | 14.3 | 1.2 | 15.5 | 15.3 |
| Health | 5.5 | 0.5 | 6.0 | 5.2 |
| Education | 3.6 | 0.2 | 3.8 | 4.2 |
| Postsecondary education | 0.6 | 0.2 | 0.8 | 0.9 |
| Other sectors | 1.7 | 3.3 | 5.0 | 9.4 |
| Totals | 25.6 | 5.5 | 31.1 | 35.0 |
Note: Numbers may not add due to rounding.
Liabilities
Ontario’s liabilities consist of debt and other financial obligations, such as accounts payable and the estimated cost of future payments, including pensions and other employee future benefits liability (see Table 6).
| Item | 2025–26 Actual | % of Total | 2024–25 Actual | % of Total | Variance Increase (Decrease) |
|---|---|---|---|---|---|
| Accounts payable and accrued liabilities | 44.7 | 7.5% | 44.9 | 7.9% | (0.2) |
| Debt | 494.4 | 82.4% | 462.0 | 80.9% | 32.3 |
| Other long-term financing | 18.4 | 3.1% | 19.2 | 3.4% | (0.8) |
| Deferred revenue and capital contributions | 15.6 | 2.6% | 16.7 | 2.9% | (1.1) |
| Pensions and other employee future benefits liability | 13.7 | 2.3% | 13.7 | 2.4% | – |
| Derivative liabilities | 3.6 | 0.6% | 5.2 | 0.9% | (1.6) |
| Other liabilities | 9.5 | 1.6% | 9.4 | 1.6% | 0.1 |
| Total Liabilities | 599.9 | 100.0% | 571.2 | 100.0% | 28.7 |
Note: Numbers may not add due to rounding.
Debt
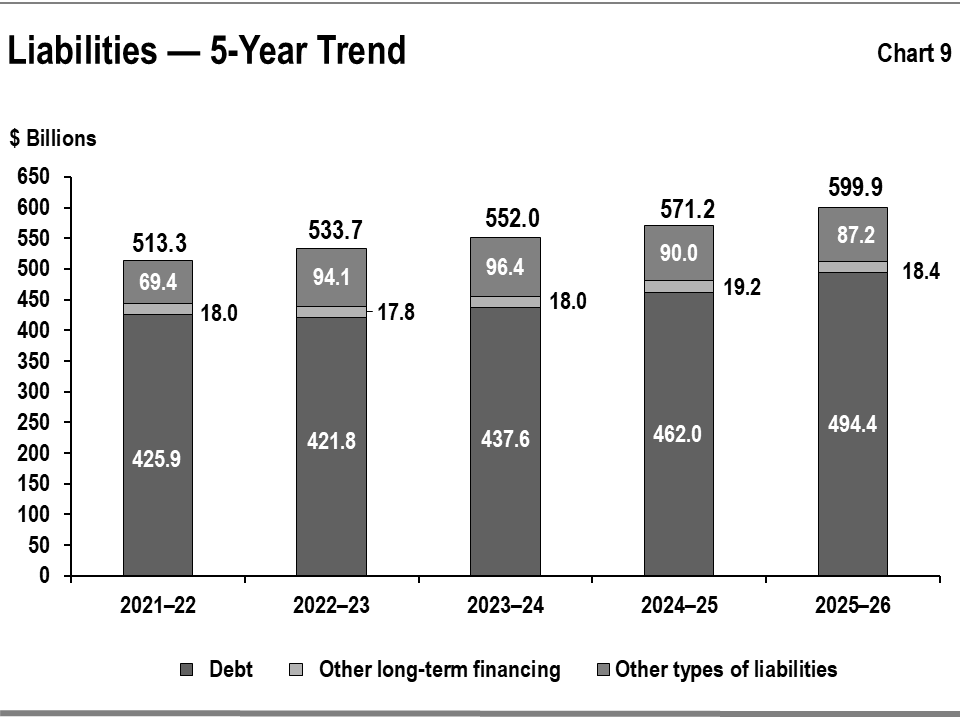
Debt makes up the largest share of liabilities. From 2024–25 to 2025–26, debt increased by $32.3 billion to $494.4 billion at fiscal year-end, primarily to finance the deficit and investment in infrastructure to support critical public services such as health care, education, transportation and transit.
Table 7 summarizes the government’s financing in 2025–26.
| Item | Amount |
|---|---|
| Operating deficit and other transactions | 6.4 |
| Investment in capital assets owned by the government and its consolidated organizations, including hospitals, school boards, colleges and children’s aid societies | 22.6 |
| Decrease in the government’s cash and investments funded by cash holdings | (1.0) |
| Subtotal | 28.0 |
| Decrease in other long-term financing, tangible capital assets financed by public private partnership (P3) | 4.3 |
| Net new financing | 32.3 |
Note: Numbers may not add due to rounding.
The government completed an annual borrowing program of $58.6 billion in 2025–26, compared to the $49.5 billion borrowed in 2024–25.
Other long-term financing
This category includes obligations to finance construction of public assets including those procured through the P3 model and total debt of BPS. All assets that are owned by the Ontario government and its consolidated entities, and the associated financing liabilities, are reflected on Ontario’s Consolidated Statement of Financial Position during construction and as the liabilities are incurred. For information on asset investments, see the Tangible Capital Assets section.
Other types of liabilities
Other types of liabilities include accounts payable, pensions and other employee future benefits, unspent transfers received from the federal government representing deferred revenues, derivative liabilities, and other liabilities.
Chart 9 shows the recent trends in liabilities for Ontario. This trend over the period between 2021–22 and 2025–26 shows public debt rising, mainly to fund capital investments and the annual deficits. Other types of liabilities, including accounts payable and deferred revenue, tend to be more variable since they often reflect specific circumstances at the fiscal year-end, such as accrued liabilities for goods and services.
Risks and risk management
Ontario’s financial results and financial reporting are subject to various risks and uncertainties over which the provincial government may have limited or no control.
A majority of Ontario’s taxation revenue is administered and collected by the federal government through various tax collection agreements. Actual tax assessments from the CRA for the current tax year and prior years are provided to the Ontario Ministry of Finance well after the tax year has ended. In the absence of actual tax data from the federal government, the Ministry of Finance uses economic driven models to produce the forecasts for federally administered taxes. Ontario manages risks to the revenue forecast by consulting with private-sector economists to inform the government’s planning assumptions. For prudent fiscal planning, the Ontario Ministry of Finance’s GDP growth projections are typically set slightly below the average private-sector forecast. Ontario’s revenues rely heavily on the level and pace of economic activity in the province.
The ongoing monitoring of revenues allows the government to assess potential risks to its finances. Collaboration with the CRA, which administers approximately 80 per cent of Ontario’s taxation revenues, is essential to achieving this. As well, Ontario continues to explore ways to enhance its tax revenue forecasting and monitoring.
There are also risks arising from other sources of revenue, such as federal transfers and income from GBEs. Since these represent a smaller share of total revenue compared to larger revenue sources such as tax revenue — the risks they present are relatively less significant to the fiscal plan. In addition, these risks are difficult to predict and quantify; for example, federal transfers are subject to federal policy changes while GBE net incomes are subject to regulatory decisions and market conditions. Note 1 to the Consolidated Financial Statements provides additional details on measurement of uncertainty.
Additionally, given the current pace of change and the interconnected nature of the external and emerging risk environment, the Province needs to consider potential threats and opportunities as it sets priorities. Rapidly evolving technologies, such as artificial intelligence, combined with geopolitical and macroeconomic uncertainty (e.g., tariffs and trade), can introduce new risks or amplify existing risks for the government such as risks tied to cyber security, infrastructure, supply chain management, operational resilience and workforce capacity, which require coordinated and targeted responses and mitigation to support the government’s ability to achieve its priorities.
Other risk management tools the government utilized include contingency funds to address risks that materialized. In the 2025 Budget, the government committed a total of $3.0 billion ($2.8 billion for operating and $0.2 billion for capital) for the standard contingency fund. After the release of the 2025 Budget, an additional top-up of $2.0 billion to the standard contingency fund was made to support the implementation of initiatives announced as part of the 2025 Ontario Economic Outlook and Fiscal Review. Funds from the standard contingency fund were used to address pressure or support initiatives such as:
- Investing in home care services and to expand and sustain the Hospital to Home program
- Higher demand for social assistance programs;
- Investments in essential service delivery, including courts, coroner and forensic pathology services, and the Fire Protection Grant;
- Ice Storm Financial Assistance for Municipalities, Small Businesses, Small Farms and Not-for-Profit Organizations;
- Requirements for wildfire management and suppression activities for the 2025 fire season, which saw a 300 per cent increase in hectares burned compared to the 10-year average;
- Introduction of the Road Safety Initiatives Fund, to support traffic-calming measures in school zones and community safety zones that previously deployed municipal speed cameras;
As required under the Fiscal Sustainability, Transparency and Accountability Act, 2019, a reserve is included in the projected surplus/deficit each year to guard against unforeseen revenue and expense changes that could have a negative impact on the government’s fiscal performance. The 2025 Budget included a $2.0 billion reserve for 2025–26. Excluding this reserve, the projected deficit for 2025–26 in the 2025 Budget was $12.6 billion.
Provisions for losses that are likely to occur as a result of contingent liabilities, such as ongoing litigation and land claims, and that can be reasonably estimated, are expensed and reported as liabilities. Note 1 to the Consolidated Financial Statements provides further details.
Note 3 to the Consolidated Financial Statements explains the government’s risk management strategies, which are intended to ensure that exposure to borrowing-related risk is managed in a prudent and cost-effective manner.
Changes in the Canadian generally accepted accounting principles (GAAP) for the public sector issued by the Public Sector Accounting Board (PSAB) can have an impact on Ontario’s budgets, estimates and actual results. The Office of the Comptroller General, Treasury Board Secretariat actively monitors proposed changes and provides input to standard setters to support the development of standards that support sound public policy decision-making, transparency and accountability in reporting.
Key Financial Ratios
In this section of the Annual Report, the use of key measures of financial position is used to assess Ontario’s financial position. The levels and trends of these measures indicate the impacts of economic and other events on the Ontario government’s finances. The ratio and level of each over the past five fiscal years are outlined in Table 8.
| Item | 2021–22 | 2022–23 | 2023–24 | 2024–25 | 2025–26 |
|---|---|---|---|---|---|
| Sustainability - Net Debt-to-GDP (%) | 39.5% | 37.5% | 36.0% | 35.7% | 36.5% |
| Sustainability - Net Debt-to-Revenue (Adjusted) (%) | 206.8% | 207.3% | 199.0% | 192.2% | 205.7% |
| Sustainability - Net Debt per Capita ($) | $25,794 | $26,380 | $26,212 | $26,451 | $27,985 |
| Flexibility - Interest (Adjusted)-to-Revenue (Adjusted) (%) | 6.8% | 6.4% | 5.5% | 5.6% | 6.0% |
| Flexibility - Own-Source Revenue (Adjusted) to GDP (%) | 15.9% | 15.2% | 15.1% | 15.5% | 14.6% |
| Vulnerability - Federal Transfers to Revenue (Adjusted) (%) | 16.5% | 16.2% | 16.7% | 16.5% | 17.7% |
| Vulnerability - Foreign Currency Debt to Total Debt (%) | 16.1% | 14.0% | 12.9% | 14.5% | 17.8% |
| Vulnerability - Unhedged Foreign Currency Debt (%) | 0.1% | 0.1% | 0.1% | 0.1% | 0.1% |
Notes:
- Beginning in 2020–21, Ontario is presenting public debt less of any investments in its own bonds and treasury bills.
- The forecasts of net debt and related ratios in the annual Budget are based on a calculation that includes the reserve.
- Actual results for 2024–25 and the Budget are restated to eliminate inter-entity revenue and expense balances on Employer Health Tax. See Note 17 to the Consolidated Financial Statements.
- “Revenue (Adjusted)” represents Total Revenue less Interest and Investment Income. “Interest (Adjusted)” represents Interest and Other Debt Servicing Charges net of Interest and Investment Income.
Sources: Nominal GDP is based on Ontario Economic Accounts, First Quarter 2026, released by the Ontario Ministry of Finance. Population estimates are from Statistics Canada.
Measures of sustainability
Net debt provides a measure of the future government revenues that will be required to pay for the government’s past transactions. Net debt as a percentage of Ontario’s GDP shows the financial demands on the economy resulting from the government’s spending and taxation policies. A lower ratio of Net Debt-to-GDP generally indicates higher sustainability.
The government’s Net Debt-to-GDP ratio was 36.5 per cent at the end of fiscal year 2025–26, lower than the 37.9 per cent forecast in the 2025 Budget. As shown in Table 8, this ratio has increased by 0.8 percentage points over the prior year, largely due to net debt increasing at a faster rate than GDP.
The ratio of Net Debt-to-Revenue (Adjusted) is another key measure of sustainability, since net debt reflects the future revenue that is required to pay for past transactions and events. A lower Net Debt-to-Revenue (adjusted) ratio generally indicates higher sustainability. This ratio was 205.7 per cent at the end of fiscal year 2025–26, lower than the 211.4 per cent forecast in the 2025 Budget. The ratio increased by 13.5 percentage points from the prior year primarily due to higher net debt.
Measures of flexibility
The ratio of Interest (Adjusted)-to-Revenue (Adjusted) shows the share of provincial revenue that is being used to pay interest and other debt servicing charges. Revenue (Adjusted) is calculated as total revenue net of interest and investment income. A lower ratio generally indicates that a government has more flexibility to direct its revenues to programs. The ratio has fallen for Ontario over the past five years, from a high of 6.8 per cent in 2021–22 to the current level of 6.0 per cent.
Own-Source Revenue (Adjusted) as a share of Ontario’s GDP shows the extent to which the government is leveraging funds from the provincial economy collected through taxation, user fees and other revenue sources it controls. A high taxation burden may make a jurisdiction less competitive, therefore increases in this ratio may reduce future revenue flexibility.
Measures of vulnerability
Transfers from the federal government as a percentage of Revenue (Adjusted) is an indicator of the degree to which Ontario relies on the federal government for revenue. A higher ratio may imply that a provincial government is more reliant on federal transfers. Provinces may have limited control over the value of these transfers, and changes in federal policies can result in shifts in federal revenues to provinces.
Ontario’s share of revenue from federal transfers, including direct transfers to the BPS is 17.7 per cent in 2025–26. This is slightly higher than shares observed in recent years.
Foreign currency debt to total debt is a measure of vulnerability to changes in foreign currency exchange rates. Accessing borrowing opportunities in foreign currencies allows Ontario to diversify its investor and funding base. It also ensures that the government will continue to have adequate access to capital in the event that domestic market conditions become more challenging. Ontario manages foreign currency risk by hedging its exposure to foreign currencies through the use of financial instruments. Effective hedging has allowed the government to consistently limit its exposure to foreign currency fluctuations to 0.1 per cent of debt issued for provincial purposes in 2021–22, remaining unchanged from 2022–23 to 2025–26.
Fiscal Management
Use of taxpayer dollars
To support long-term economic growth and sustainable public finances, the government remains committed to ensuring taxpayer dollars are managed appropriately. This includes an emphasis on evidence-based decision-making and performance measurement to identify opportunities for modernization and to improve the effectiveness and efficiency of public programs and services.
To further support this approach, the government continues to advance an outcomes management strategy to promote greater alignment between performance measurement and strategic objectives across the public sector. This work aims to strengthen accountability, inform decision-making, and support the delivery of effective and efficient programs and services while maintaining fiscal sustainability.
The Audit and Accountability Committee (AAC) plays an important role in supporting the government’s efforts to ensure the effectiveness and efficiency of operations, and sound stewardship of public funds through effective risk management, governance and internal control practices. The AAC supports enhanced governance by providing input and direction to ensure internal audit services continue to align with emerging risks and government priorities, based on independent strategic advice provided by the Ontario Internal Audit Committee (OIAC), an advisory audit committee of the AAC.
Non-Financial Activities
This section discusses key non-financial results of major sectors. The purpose is to provide highlights of Ontario government spending and the related activities in these sectors.
Health sector
Ontario’s health care system is connecting Ontarians to the care they need, when and where they need it during all stages of life. Ontario is building a patient-centred, equitable, results-driven, and sustainable public health care system in Ontario.
Results reported in 2025–26 include, but are not limited to:
- Creating the Primary Care Act, 2025, that received Royal Assent on June 5, 2025, making Ontario the first jurisdiction in Canada to establish a legislative framework for its publicly funded primary care system.
- Connecting more than 340,000 people to primary care in 2025–26.
- Expanding five primary care teams led by Francophone providers and 13 new or expanded Indigenous Primary Health Care Organizations, with more to be funded in 2026–2027.
- Launching a competitive procurement process to support the creation of a new provincewide Primary Care Medical Record system that will securely integrate patient records, reduce paperwork for primary care providers and support the quality and continuity of care for patients.
- Opening the new Northpine Diagnostic Imaging Department at Scarborough Health Network's General Hospital in April 2025, expanding access to diagnostic imaging services and helping more people receive care closer to home.
- Launching the Funding Accelerated for Specific Treatments (FAST) program, making Ontario the first jurisdiction in Canada to fast-track access to new cancer drugs and helping connect patients to life-saving cancer treatments sooner.
- Introducing new measures in June 2025 to enable qualified U.S.-licensed physicians and nurses to begin practising in Ontario more quickly, helping strengthen the province’s health-care workforce and connect more people to care.
- Opening 28 Homelessness and Addiction Recovery Treatment (HART) Hubs across Ontario to connect people to mental health and addictions services and supports, as well as social services, employment support, and supportive housing.
- Expanding access to community-based mental health services for youth through the opening of four new Youth Wellness Hubs, helping young people connect to integrated mental health, addictions and wellness supports closer to home.
- Continuing to expand long-term care capacity by starting construction on 25 homes, which will add 3,027 new beds and redevelop 1,497 existing beds, and opening 23 newly completed homes that delivered 2,108 new beds and 1,150 redeveloped beds.
- Launching a new Capital Funding Program to provide long-term care operators with additional flexibility and support for the construction and redevelopment of long-term care homes.
- Continuing investments in long-term care staffing to maintain long-term care system level average targets of four hours of care for residents, along with 36 minutes of care from allied health professionals.
- Strengthening workforce capacity through increasing nursing education investments to support the training of approximately 2,200 additional nurse practitioners, registered nurses, and registered practical nurses, as well as expanding skin and wound care training for up to 1,100 long-term care staff.
- Enhancing access to long-term care services and resident-centred supports through the launch of the Community Access to Long-Term Care program at three sites and the expansion of culturally, linguistically, and religiously appropriate care to residents in 32 additional long-term care homes.
Education sector
Ontario’s publicly funded early years and education system is focused on preparing Ontario’s children and students for success, and ensuring that young people develop in-demand skills that can be applied to the labour market. The government is committed to ensuring Ontario continues to have a leading education system, both in English and French, that focuses on important foundational skills like reading, writing and math.
Results reported in 2025–26 include:
- Continuing to modernize curriculum to ensure students have foundational skills in reading, writing, and STEM to better prepare them for the jobs of tomorrow. This includes:
- A new kindergarten curriculum, with a focus on foundational skills in literacy and STEM.
- New mandatory curriculum content in grades 7, 8, and 10 about the experiences, history, and contributions of Black Canadians, the Holocaust, and the Holodomor famine in Ukraine.
- A financial literacy graduation requirement that students must complete to earn their Ontario Secondary School Diploma.
- Continuing to develop and implement policies and programs that support students in their education and career/life planning, including job skills programs such as Dual Credits and Specialist High Skills Major.
- Establishing Student and Family Support Offices, providing parents and guardians with a clear and effective way to get help with their child’s education and find solutions faster.
- Improving access to child care with 532,525 licensed child care spaces for children aged 0 to 12, an increase of 16,070 more spaces since March 31, 2024.
Postsecondary education sector
Ontario’s postsecondary system prepares students and job seekers with the high-quality education, skills and opportunities needed to get good jobs and provides Ontario’s employers with the skilled workforce and talent they need to thrive, prosper and strengthen our economy.
Results reported in 2025–26 include:
- The postsecondary education attainment rate in 2025–26 is approximately 75 per cent, consistent with 2024–25.
- Providing financial assistance through the Ontario Student Assistance Program to approximately 530,000 full-time students in the 2025–26 fiscal year.
- Supporting 9,700 students through the Ontario Learn and Stay Grant with over $78 million in grant funding issued in the 2025–26 academic year to date.
- Announced 357 research projects for ground-breaking work at leading research institutes and organizations across the province, including at colleges, universities, and research hospitals, through the Ontario Research Fund and Early Researcher Awards.
- Supporting the training of more doctors with an expansion of 340 undergraduate seats and 551 postgraduate positions in medical schools by 2033.
- Supporting the delivery of nursing education through the ongoing expansion of 3,000 additional enrolment spaces in Practical Nursing and Bachelor of Science in Nursing programs.
- Supporting commercialization through Intellectual Property Ontario (IPON), which onboarded over 600 new small-medium enterprise clients in 2025–26, totalling more than 1,400 clients by the end of March 2026.
- Supporting about 6,500 high-quality research internships through Mitacs, an organization that builds research partnerships between postsecondary institutions and industry, with $32.4 million over three years.
Children’s and social services sector
The Ministry of Children, Community and Social Services funds, designs and delivers programs and services, working with community partners, to protect and support people in Ontario during times of need. The Ministry works to improve outcomes for children, youth, families and individuals who need support, and advance social and economic opportunities for women across Ontario.
Results reported in 2025–26 include:
- Exempting the Canada Disability Benefit as income, to strengthen social assistance and ensure recipients of the Ontario Disability Support Program, Ontario Works and the Assistance for Children with Severe Disabilities program can receive the federal benefit without a reduction in their provincial social assistance payments or entitlements.
- Continuing to support children with autism and their families by enrolling thousands of children and youth into the Ontario Autism Program, including core clinical services, foundational family services, urgent response services, caregiver-mediated early years and entry to school programs for young children.
- Supporting the construction of the new Children’s Hospital of Eastern Ontario’s Integrated Treatment Centre, a modern, fully accessible children’s treatment centre that will deliver enhanced care to more than 13,700 children and youth with special needs and their families across eastern Ontario upon its opening in 2028.
- Investing in the new Women’s Economic Leadership and Legacy Fund to help more women access jobs and leadership opportunities, while helping survivors of human trafficking access education, training and employment pathways and supporting women’s leadership in high-demand sectors, through 12 new projects in its first year.
- Introducing legislative changes to strengthen protections for children in private and international adoptions through enhanced oversight, stronger enforcement tools and improved safeguards to prevent bad actors from entering the system.
- Renewing Ontario’s Anti-Human Trafficking Strategy, which has trained more than 1,000 front-line workers, supported tens of thousands of survivors, as well as children who were being or at risk of being trafficked, leading to hundreds of charges and arrests since 2020.
- Launching a new Children at Risk of Exploitation (CARE) Unit in Kenora to strengthen efforts to protect children and youth from sex trafficking and support survivors by bringing together child protection workers, police officers and Indigenous liaisons to identify and support children and youth at risk of exploitation, connect them to services, and help hold offenders accountable.
- Strengthening supports for survivors of gender-based violence through investments in shelter spaces and enhancing the Family Court Support Worker program by improving access to emergency shelters across Ontario and helping victims navigate the family court system.
- Continuing to support the Student Nutrition Program and the First Nations Student Nutrition Program by delivering more than 140 million healthy meals and snacks to over 800,000 students in 2025–26, including more than 1 million provided to students in Indigenous communities.
Justice sector
The justice sector supports the administration and delivery of justice services, including the administration of courts, prosecution of offences, provision of legal services and supports to victims and vulnerable persons, as well as administering the public safety, policing and correctional systems to ensure that Ontario’s diverse communities are supported and protected.
Results reported in 2025–26 include:
- Continuing to address long-standing challenges in Ontario’s justice system through digital initiatives to improve access to justice across Ontario, including rural, Northern and First Nation communities. This includes:
- Launching the first phase of the Ontario Courts Public Portal initiative in Toronto, enabling users to file court documents, access case information, pay fees and receive court decisions through a fully integrated online platform;
- Extending the availability of video and audio court hearings across the province, with 250 courtrooms now equipped with technology to enable hybrid hearings.
- Helping the courts keep pace with a growing number of complex cases by increasing the capacity to hear cases, including appointing 45 new judges to the Ontario Court of Justice.
- Maintaining and improving courthouse security with upgrades such as security surveillance systems, single points of entry and card access systems at courthouses across the province.
- Opening the expanded London Justice Centre to increase access to justice for at-risk young adults. The justice centre combines enforcement and prosecution efforts with prevention and intervention initiatives to effectively reduce violence and increase public safety in high-needs neighbourhoods.
- Building safer communities through the Community Safety and Policing Grant, which is supporting 127 projects across Ontario to combat gun and gang violence, human trafficking, mental health and addictions, and hate-motivated crime-related policing challenges.
- Strengthening the province’s public safety mandate by passing the Protect Ontario Through Safer Streets and Stronger Communities Act, 2025 and the Keeping Criminals Behind Bars Act, 2025 to enhance victim protections, combat auto theft, strengthen bail measures, increase offender accountability and improve animal welfare protections.
- Modernizing and improving Ontario’s emergency communications through investments to help municipalities and emergency response centres transition to the Next Generation 9-1-1 system.
- Protecting firefighters and communities through the Fire Protection Grant, which is supporting 380 municipal fire departments in cancer prevention initiatives and lithium-ion battery fire response, while advancing fire safety through Fire Code updates and provincewide public awareness campaigns.
- Improving safety at correctional facilities by expanding canine searches, which is resulting in contraband interceptions, including drugs and inmate-made weapons.
- Expanding mental health supports for public safety personnel through employer-based programs and free online resources available.
Condition and capacity of provincial tangible capital assets
Infrastructure investments should be made using an evidence-based approach. This includes a focus on asset management to ensure the delivery of high-quality public services, while efficiently managing the costs.
- The Province compiled its first infrastructure asset inventory in 2016 as a key step in managing provincial assets more effectively. The infrastructure asset inventory is now updated annually and currently contains information such as the location, age, condition and value of over 15,000 tangible capital assets, including buildings and Ontario’s entire road and bridge network. This covers the majority of the infrastructure assets owned or consolidated (i.e., certain BPS organizations) by the Ontario government.
- The Province uses the infrastructure asset inventory to track, monitor and report on the physical condition of assets. For example, the infrastructure asset inventory contains indicators such as Facility Condition Indexes (FCIs), Bridge Condition Indexes (BCIs) and Pavement Condition Indexes (PCIs), which help to inform the state of infrastructure assets.
- Ontario has expanded its infrastructure asset data to include other relevant data and analysis, such as the current and projected capacity and utilization of assets. This integrated data provides a base to support evidence-based infrastructure planning decisions which help ensure that infrastructure investments provide value for money and are made at the right time and the right place.
Transparency and Accountability
Ontario continues to take steps that enhance government transparency and fiscal accountability in its financial reporting. Throughout the fiscal year, the government provides regular updates on Ontario’s finances. The Annual Report and Consolidated Financial Statements, along with supplementary information, are central to demonstrating the government’s transparency and accountability in reporting its financial activities and its position at the end of the fiscal year.
Recent developments in public sector accounting standards
The Ontario government’s financial reports are prepared in accordance with the accounting standards for governments set by the Public Sector Accounting Board (PSAB) and contained in the Chartered Professional Accountants of Canada (CPA Canada) Public Sector Accounting Handbook.
As described in Note 1 to the Consolidated Financial Statements, future changes in both public-sector and private-sector accounting standards may affect how assets, liabilities, revenues and expenses are reported in Ontario’s consolidated financial reports. Other current projects that are being closely monitored by Ontario include projects on intangible assets, employee benefits, cloud computing arrangements, impairment of assets held for service potential, the government not-for-profit strategy, amendments to Section PS 2120, Accounting Changes, and annual improvement projects.
The C.D. Howe Institute Fiscal Accountability Report
Annually, the C.D. Howe Institute issues its commentary on the fiscal reporting transparency of senior Canadian governments, with a focus on the relevance, accessibility, timeliness and reliability of these government financial reports, including the Public Accounts. Each government is assigned a letter grade based on the quality of the numbers presented in these reports, access and user friendliness, and the ability to use them for various decision-making purposes.
In the 2025 report, Ontario had improved its grade.
At the time of the Auditor General opinion date for the 2025–26 Public Accounts, the 2026 Fiscal Accountability Report covering the Public Accounts of Ontario 2024–2025 had not been issued.
Chart Descriptions
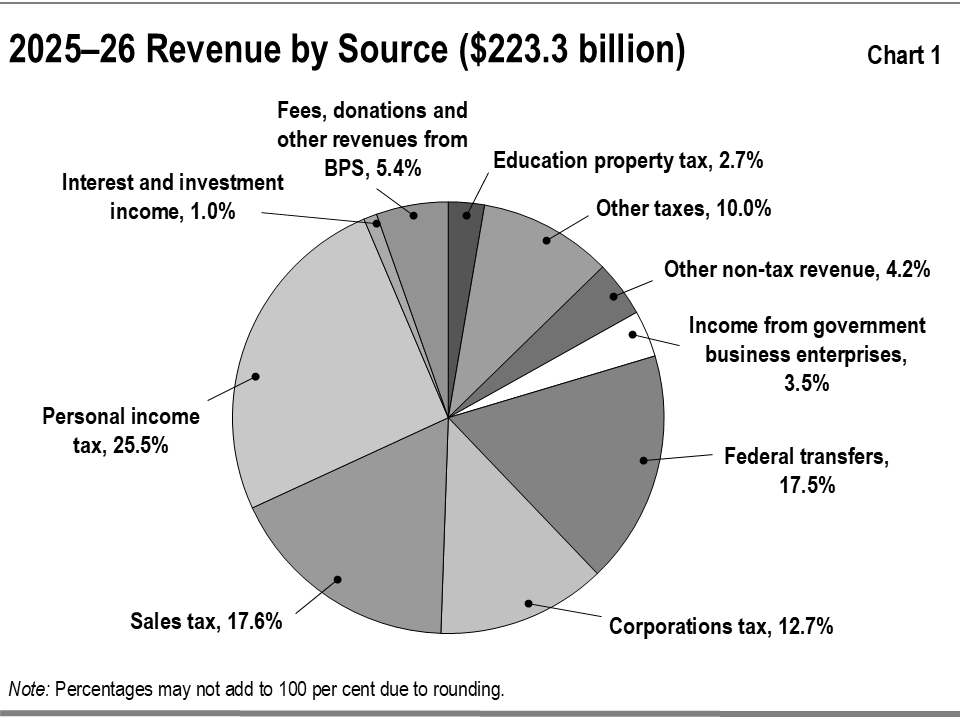
Chart 1: 2025–26 Revenue by Source
This chart shows the percentage composition of Ontario’s Total Revenues in 2025–26 by source. Total revenue is $223.3 billion.
Personal Income Tax accounts for 25.5 per cent. Sales Tax accounts for 17.6 per cent. Corporations Tax accounts for 12.7 per cent. Education Property Tax accounts for 2.7 per cent. Other taxes account for 10.0 per cent. Federal Transfers account for 17.5 per cent. Income from Government Business Enterprises accounts for 3.5 per cent. Fees, donations and other revenues from BPS account for 5.4 per cent. Other non-tax revenue accounts for 4.2 per cent. Interest and investment income accounts for 1.0 per cent.
Note: Percentages may not add to 100 per cent due to rounding.
Chart 2: Revenue by Source—5-year Comparison
This bar graph shows recent trends in revenue for Ontario’s major revenue sources. The source categories include taxation, federal transfers, income from Government Business Enterprises, fees, donations and other revenue from hospitals, school boards and colleges, children’s aid societies, and other revenues for the period between 2021–22 to 2025–26.
Notes: Government Business Enterprises are: Hydro One Limited, Liquor Control Board of Ontario, Ontario Lottery and Gaming Corporation, Ontario Power Generation Inc., iGaming Ontario and Ontario Cannabis Retail Corporation. Provincial revenue from Hydro One Limited’s net income is proportional to the government’s ownership share.
Chart 3: 2025–26 Program Expense by Sector
This chart shows the percentage composition of Ontario’s program expenses in 2025–26 by sector. Program expense equals total expense minus interest and other debt servicing charges expense. Total program expense in 2025–26 was $220.9 billion.
The details of the program expenses by sector are as follows: Health accounts for 44.1 per cent; Education accounts for 18.2 per cent; Other programs account for 18.4 per cent; Children’s and social services account for 9.7 per cent; Postsecondary education accounts for 6.3 per cent; and Justice accounts for 3.3 per cent.
Notes: The Teachers’ Pension Plan expense is included in Other programs and aligns with the presentation in Table 3.7 of the 2025 Budget. Percentages may not add to 100 per cent due to rounding.
Chart 4: 2025–26 Spending by Type of Expense
This chart shows the percentage composition of Ontario’s total expenses in 2025–26 by type of expense. Total expense is $236.3 billion.
Transfers account for 41.0 per cent. Salaries and benefits account for 33.2 per cent. Operating costs account for 17.6 per cent. Interest and other debt servicing charges account for 6.5 per cent. Other expenses account for 1.7 per cent.
Notes: Compensation related costs for non-consolidated entities (e.g., municipalities, universities) and payments to doctors for physician services are included in Transfers. Percentages may not add to 100 per cent due to rounding.
Chart 5: Expense by Sector — 5-year Comparison
This bar graph shows the trend in total spending for major program areas: Health, Education, Children’s and social services, Postsecondary education, Justice, Other programs, and Interest and other debt servicing charges for the period between 2021–22 to 2025–26.
Note: The Teachers’ Pension Plan is included in Other programs to align with the presentation in Table 3.7 of the 2025 Budget.
Chart 6: Interest (Adjusted)-to-Revenue (Adjusted) — 5-year Trend
This graph shows the trend in Interest (Adjusted)-to-Revenue (Adjusted) from 6.8 per cent in 2021–22 to 6.0 per cent in 2025–26.
This graph shows that although for the most part, interest costs have grown in absolute terms, they have steadily fallen as a percentage of the Ontario government’s revenues since 2021–22. This is mainly due to prevailing low interest rates coupled with cost-effective debt management.
Chart 7: Financial Assets — 5-year Comparison
This bar graph shows the trend in Ontario’s financial assets by category: cash, investments, accounts receivable, loans receivable, derivative assets, other assets, and investment in Government Business Enterprises from 2021–22 to 2025–26.
Note: Government Business Enterprises include: Hydro One Limited, Liquor Control Board of Ontario, Ontario Lottery and Gaming Corporation, Ontario Power Generation Inc., iGaming Ontario and Ontario Cannabis Retail Corporation.
Chart 8: Chart 8: Trends in the Net Book Value of Provincial Tangible Capital Assets — 5-year Comparison
This bar graph shows the trends in net book value of provincial tangible capital assets by sector: Transportation and transit, Health, Education, Postsecondary education and Other for the period between 2021–22 to 2025–26.
Chart 9: Liabilities — 5-year Trend
This bar graph shows the recent trends in total liabilities for Ontario by type: debt, other long-term financing and other types of liabilities from 2021–22 to 2025–26.
Footnotes
- footnote[1] Back to paragraph Comparatives on Budget and prior year Actuals have been reclassified to be reflected on the same basis as that used to report the Actual current year balances. Actual results for 2024–25 and the Budget are also restated to eliminate inter-entity revenue and expense balances on Employer Health Tax. This change does not affect the Province’s annual deficit or accumulated deficit. See Note 17 to the Consolidated Financial Statements.
- footnote[2] Back to paragraph Comparatives on Budget and prior year Actuals have been reclassified to be reflected on the same basis as that used to report the Actual current year balances. Actual results for 2024–25 and the Budget are also restated to eliminate inter-entity revenue and expense balances on Employer Health Tax. See Note 17 to the Consolidated Financial Statements.
- footnote[3] Back to paragraph Ontario Teachers’ Pension Plan impact is included in Other programs to align with the presentation in Table 3.7 of the 2025 Budget. In the Consolidated Financial Statements, this item appears under the Education sector. Schedule 4 to the Consolidated Financial Statements provides details.
- footnote[4] Back to paragraph Includes adjustments for the net book value of assets disposed during the year, as well as changes in valuation.
- footnote[5] Back to paragraph Mainly transfers for capital purposes to municipalities and universities and expenditure for capital repairs.
- footnote[6] Back to paragraph Includes social and justice sectors, high-speed internet, government administration, natural resources, and the culture and tourism industries.
- footnote[7] Back to paragraph Includes other partner funding, which refers to third-party investments primarily in consolidated entities such as hospitals, colleges, school boards and children’s aid societies.
- footnote[8] Back to paragraph Includes federal and municipal contributions to provincial infrastructure investments.
- footnote[9] Back to paragraph An operating deficit of $13.0 billion net of a $6.6 billion increase in cash from changes to assets and liabilities related to other operating transactions. See the Consolidated Statement of Cash Flow.
- footnote[10] Back to paragraph New Tangible Capital Asset investments of $22.9 billion, less proceeds of $0.3 billion from the sale of tangible capital assets.
- footnote[11] Back to paragraph $0.4 billion increase in cash due to investment retirements in excess of purchases; $1.6 billion spending of cash reserve; net of $1.0 billion capital injection to Ontario Power Generation.
- footnote[12] Back to paragraph Including $3.6 billion net increase in financing of capital projects through P3 and $0.7 billion net increase from changes to derivative assets and liabilities.