Report on Forest Management 2014 and 2015
Read this report to see how we've been managing publicly owned (Crown) forests.
Executive summary
Key forest management statistics within the Area of the Undertaking for fiscal years 2014 and 2015.
| Metric | 2014 | 2015 |
|---|---|---|
| Area of natural disturbance (hectares) | 488,150 | 709,645 |
| Volume loss from natural disturbance (cubic metres) | 157,934 | 116,373 |
| Area harvested (hectares) | 117,180 | 131,688 |
| Volume of wood harvested (cubic metres) | 12,997,339 | 13,037,565 |
| Area regenerated (hectares) | 120,080 | 112,138 |
| Area regenerated artificially: tree planting and seeding (hectares) | 61,207 | 50,617 |
| Area regenerated naturally (hectares) | 58,872 | 61,521 |
| Proportion of area successfully regenerated (%) | 93% | 90% |
| Expenditures from the Forest Renewal Trust ($ CDN millions) | 50.4 | 55.1 |
| Contributions to the Forest Renewal Trust ($ CDN millions) | 43.8 | 47.2 |
| Forest industry revenues ($ CDN billions) | 12.6 | 13.4 |
| Crown charge payments for wood harvested ($ CDN millions) | 94.0 | 103.2 |
| Forest industry employment (number of direct jobs) | 63,175 | 57,617 |
| Forest access roads constructed (kilometres) | 3,897 | 4,338 |
| Forest access roads decommissioned (kilometres) | 1,514 | 1,480 |
| Number of forest operations inspection reports | 2,413 | 2,502 |
| Compliance rate of forest operations inspections (%) | 98% | 98% |
| Forest audits conducted | 5 | 6 |
| Proportion of audits recommending licence extensions (excludes Crown units) (%) | 100% | 100% |
| Forest management plans approved | 9 | 13 |
| Forest management plan amendments approved | 150 | 135 |
Introduction
The Crown Forest Sustainability Act regulates the harvest and renewal of Ontario's forests. The purpose of the act is to ensure the long-term health of Crown forests while meeting the social, economic and environmental needs of present and future generations (e.g. timber and commercial products, wildlife habitat and recreational opportunities, water filtration and carbon storage).
Forest management in Ontario is also subject to the Environmental Assessment Act. MNRF has authorization under this act (Declaration Order MNR-75) to conduct forest management on Crown lands in central and northern Ontario.
This report addresses the legal requirements outlined in the Environmental Assessment Requirements for Forest Management on Crown Lands in Ontario (Declaration Order MNR-75). It is also prepared consistent with the principles and intent of the Crown Forest Sustainability Act.
Since 1994 these reports have been prepared annually; however all future reports will be prepared every 2 years. Although this is the first report prepared on a biennial basis, it is the twentieth provincial report on forest management in Ontario.
The Area of the Undertaking is divided into administrative areas known as forest management units. There were 41 units in this reporting period.
Forest management activities on each unit are planned and approved through forest management plans. Forest managers report each year on the activities conducted in a management unit.
The data from management unit reports is consolidated into province wide statistics and presented in this report covering activities that occurred during the 2 year period April 1, 2014 to March 31, 2016. It does not include private land or provincial parks.
View the official management unit annual reports on the Find a Forest Management Plan website at ontario.ca/forestplans. Find more information on Ontario’s forest programs at ontario.ca/forests.
Ontario’s managed Crown forest area
Ontario is 107.6 million hectares in size.
- 93.2 million hectares or 87% of the province is publicly owned.
- 71.1 million hectares or 66% of the province is forest.
Forest management on Crown land is practiced within the Area of the Undertaking, as defined by Declaration Order MNR-75.
The Area of the Undertaking stretches across central and northern Ontario from Kemptville to Red Lake and includes 45 million hectares of forest, water, wetland and other land categories. It encompasses:
- 42% of the province’s area
- 37.4 million hectares of forest which is 53% of the province’s forest
- 27.8 million hectares of Crown forest that is productive for forest management
- 41 administrative forest management units that range in size from 300 thousand to 3.6 million hectares
For trend information on the area, age and types of forest in the Area of the Undertaking read the forest indicator on ecosystem composition and structure at ontario.ca/forestindicators.
View maps and detailed statistics on the area and volume of common tree species in the Forest Resources of Ontario report at ontario.ca/forestreporting.
The Area of the Undertaking
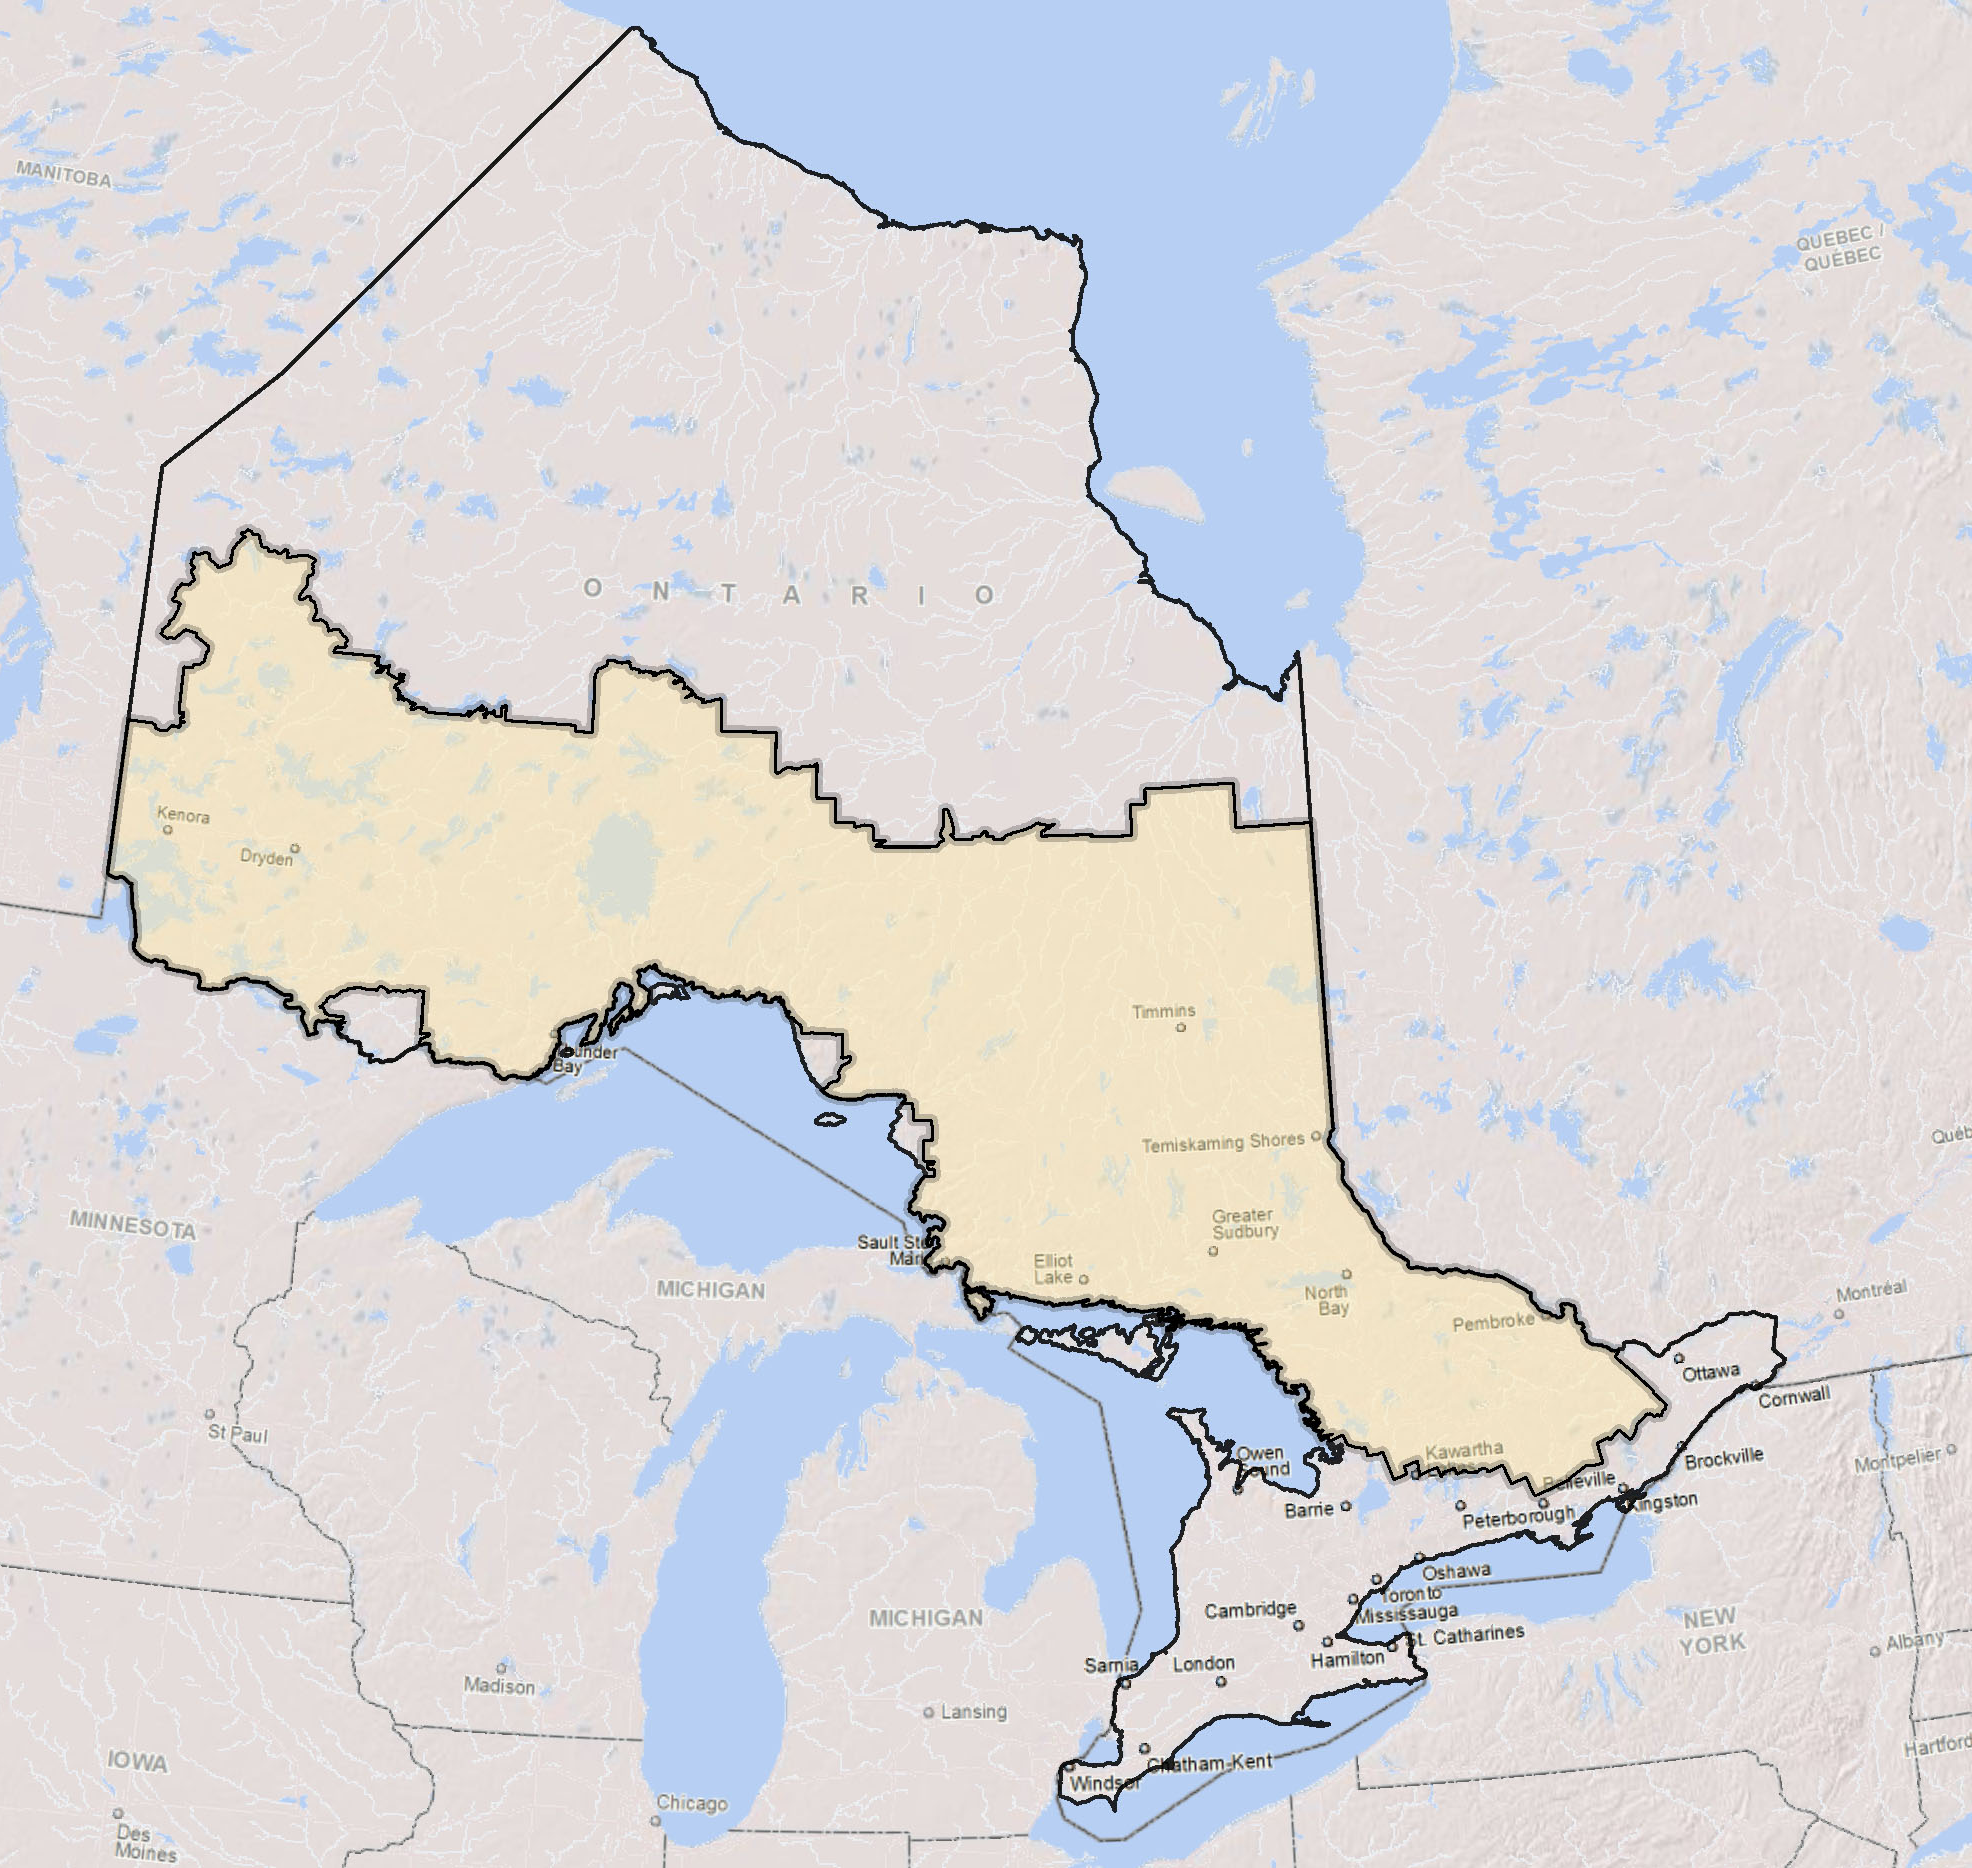
Map of Ontario showing the boundary of the Area of the Undertaking.
Area of land categories and ownerships within the Area of the Undertaking (hectares)
| Land category | Crown | Protected areas | Other | Total |
|---|---|---|---|---|
| Water | 4,623,644 | 964,341 | 276,275 | 5,864,260 |
| Wetland | 296,676 | 73,119 | 97,938 | 467,734 |
| Field/Agriculture | 13,725 | 1,777 | 580,291 | 595,793 |
| Other | 282,800 | 83,247 | 290,591 | 656,638 |
| Forest (Treed Wetland) | 1,403,805 | 190,239 | 182,483 | 1,776,527 |
| Forest (Productive) | 27,793,559 | 3,245,657 | 4,578,838 | 35,618,055 |
| Total: | 34,414,209 | 4,558,380 | 6,006,416 | 44,979,007 |
Table note: the protected areas category includes area within proposed and existing federal and provincial protected areas except for the utilization zone of Algonquin Park. The other category includes private, federal and Indigenous land.
Land categories in the Area of the Undertaking
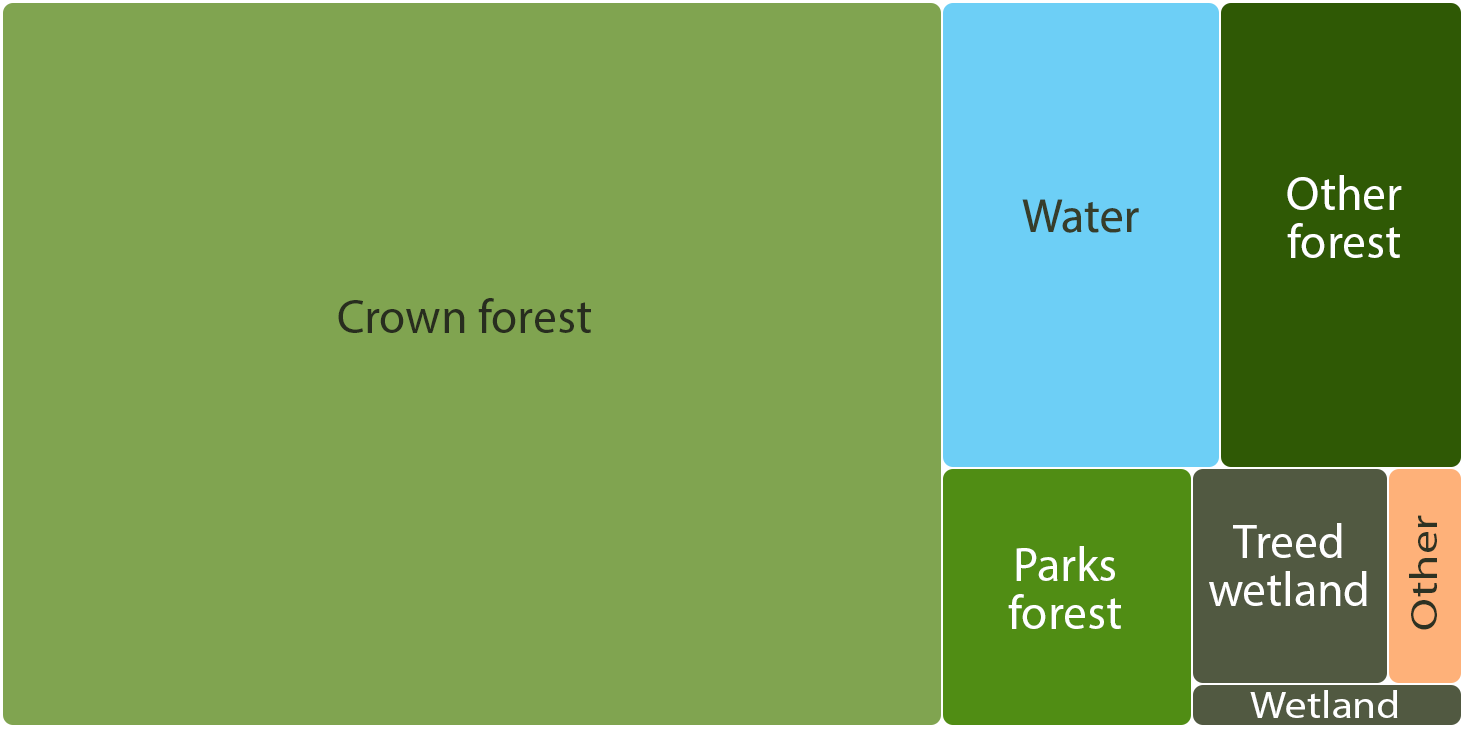
Comparing relative size of Ontario's land categories of forest, wetland, water and other.
Natural disturbances
Natural disturbances such as forest fires, insect outbreaks, tree diseases and severe weather occur throughout the life cycle of the forest. In any given year, these disturbances may affect and alter areas of the forest.
The tables and charts below summarize the natural disturbances that occurred within Area of the Undertaking including the area of forest where disturbance occurred, the area of Crown forest where mortality occurred and the resulting volume loss.
- Natural disturbances from wildfire and weather remained low across the Area of the Undertaking.
- Wildfires in 2015 occurred in areas with young forest or minimal forest cover resulting in low volume loss.
- While the area disturbed by forest tent caterpillar increased to over half a million hectares, it did not result in volume loss in 2014 or 2015.
- Jack pine budworm levels also remained low with no volume losses.
- Spruce budworm levels increased substantially but volume losses were minimal at 1,905 hectares in 2015.
For province wide trend information on natural disturbances, read the forest indicators on wildland fire, weather, native insects and disease and invasive insects and disease at ontario.ca/forestindicators.
Read the annual Forest Health Conditions report at ontario.ca/forestreporting for more detail on specific forest insects and diseases. Find current forest fire conditions in Ontario at ontario.ca/forestfire.
Area of forest where disturbance occurred within the Area of the Undertaking (hectares)
| Disturbance type | Area of disturbance in 2014 | Area of disturbance in 2015 |
|---|---|---|
| Spruce budworm | 41,536 | 147,953 |
| Jack pine budworm | 0 | 3,654 |
| Forest tent caterpillar | 419,774 | 550,344 |
| Poplar/birch complex | 0 | 0 |
| Other insects | 22,956 | 0 |
| Other diseases | 0 | 0 |
| Wildfire | 1,230 | 5,472 |
| Weather | 2,653 | 2,221 |
| Total | 488,150 | 709,645 |
Table note: the area of disturbance is the gross area within which disturbance occurred including all forest and ownership categories within the Area of the Undertaking. It includes all severities of disturbance. The weather disturbance type includes drought, blowdown, frost, and winter browning.
Area of Crown forest where mortality occurred and resulting volume loss within the Area of the Undertaking
| Disturbance Type | Area of mortality in 2014 (hectares) | Volume loss from mortality in 2014 (cubic metres) | Area of mortality in 2015 (hectares) | Volume loss from mortality in 2015 (cubic metres) |
|---|---|---|---|---|
| Spruce budworm | 0 | 0 | 168 | 1,905 |
| Jack pine budworm | 0 | 0 | 0 | 0 |
| Forest tent caterpillar | 0 | 0 | 0 | 0 |
| Poplar/birch complex | 0 | 0 | 0 | 0 |
| Other insects | 5,785 | 9,295 | 0 | 0 |
| Other diseases | 0 | 0 | 0 | 0 |
| Wildfire | 1,011 | 82,400 | 4,867 | 50,156 |
| Weather | 1,024 | 66,239 | 1,237 | 64,313 |
| Total | 7,820 | 157,934 | 6,272 | 116,373 |
Table note: the area of mortality and volume loss are within the Area of the Undertaking from the Crown forest category only.
Forest area where natural disturbance occurred within the Area of the Undertaking from 2006-2015
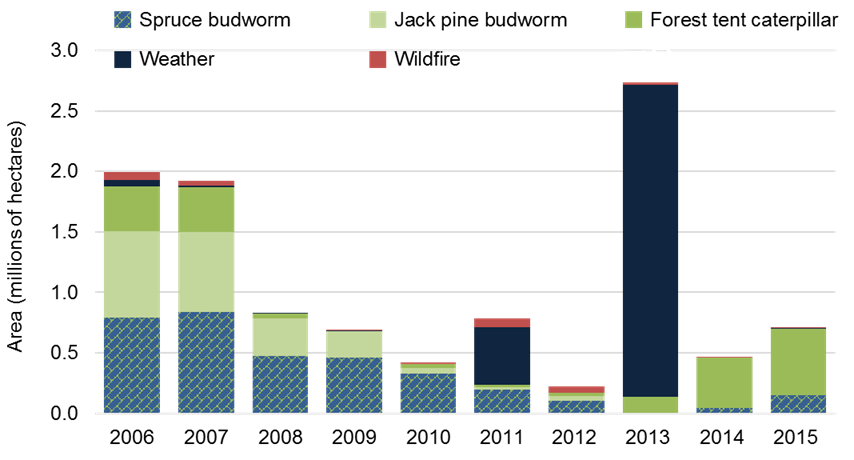
Column chart showing the forest area where natural disturbances occurred within the Area of the Undertaking over time from 2006-2015.
Volume loss from mortality caused by natural disturbance in the Area of the Undertaking from 2006-2015
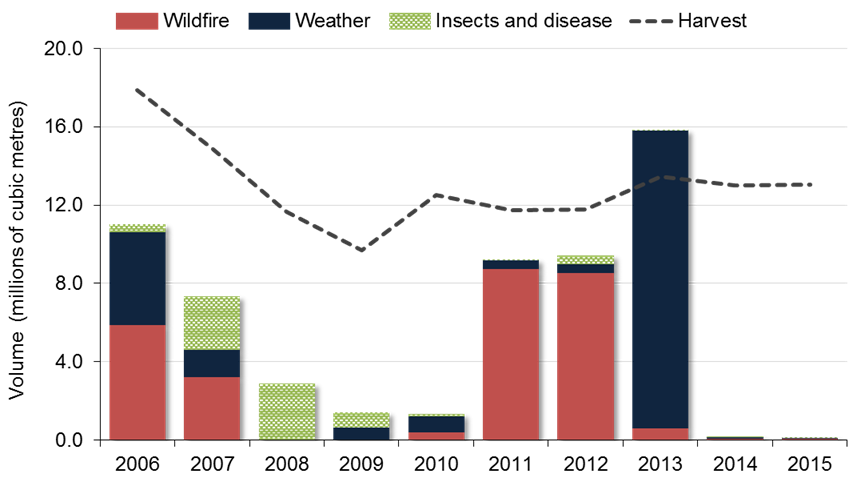
Column chart showing the volume lost from significant natural disturbances within the Area of the Undertaking over time from 2006-2015.
Harvest area and volume
The sustainable harvest of our forests provides renewable resources including lumber, structural board, pulp, paper, newsprint, bio‐fuel and textiles. Forest managers report on the area and volume harvested each year.
The tables and charts below summarize the available and actual area and volume harvested within the Area of the Undertaking. The available harvest area and volume are prescribed in approved forest management plans.
- Area and volume harvested remained consistent with the previous 5 year average but still well below historic levels.
- 45% of the available area and 43% of the available volume was harvested (2 year average).
- 86% of the area was harvested under the clearcut silviculture system, 8% under the shelterwood system; and 6% was harvested using selection system (2 year averages).
- The majority of wood harvested was jack pine and spruce.
- Most of the volume flowed to sawmill, pulp and composite sectors, however the pulp sector volume declined by over half a million cubic metres in 2014.
- This decline in pulp volume can be tied to an improvement in sawmill volumes that began in 2013. Pulp and paper manufacturers prefer to purchase wood chips to supply their mills rather than harvest pulpwood. The increase in sawmill volume provided a greater supply of wood chips. There was also a loss of demand for pulp from a general slow-down in Ontario’s paper manufacturing industry including the 2014 closure of Resolute Forest Product’s paper mill located in Iroquois Falls.
- The volume harvested for bioproducts showed a steady increase from 2013 reaching over half a million cubic metres in 2015.
For provincial trend information, read the forest indicator on harvest area and the forest indicator on harvest volume at ontario.ca/forestindicators.
Read more about the silviculture systems used to harvest and renew forests at ontario.ca/page/forest-renewal.
Area available and harvested
| Measure | 2014 | 2015 |
|---|---|---|
| Available harvest area (hectares) | 279,218 | 279,218 |
| Area harvested (hectares) | 117,180 | 131,688 |
| Proportion of available area harvested (%) | 42% | 47% |
Area harvested by silviculture system (hectares)
| Silviculture system | Area harvested in 2014 | Area harvested in 2015 |
|---|---|---|
| Clearcut | 99,984 | 113,828 |
| Selection | 7,524 | 7,121 |
| Shelterwood | 9,672 | 10,739 |
| Total all systems | 117,180 | 131,688 |
Volume available and harvested
| Measure | 2014 | 2015 |
|---|---|---|
| Available harvest volume (cubic metres) | 30,050,863 | 30,050,863 |
| Volume harvested (cubic metres) | 12,997,339 | 13,037,565 |
| Proportion of available volume harvested (%) | 43% | 43% |
Volume harvested by tree species group (cubic metres)
| Species | Volume harvested in 2014 | Volume harvested in 2015 |
|---|---|---|
| Softwoods | 9,778,166 | 9,659,046 |
| Hardwoods | 2,817,551 | 2,803,847 |
| Mixedwood | 401,623 | 574,672 |
| Total volume | 12,997,339 | 13,037,565 |
Volume harvested by tree species (cubic metres)
| Tree Species | Volume harvested in 2014 | Volume harvested in 2015 |
|---|---|---|
| White pine | 302,642 | 325,255 |
| Red pine | 187,430 | 191,606 |
| Jack pine | 3,346,700 | 3,570,185 |
| Spruce | 5,461,410 | 5,157,627 |
| Balsam fir | 437,483 | 378,568 |
| Other softwood | 42,501 | 35,805 |
| Poplar | 1,981,541 | 2,011,004 |
| White birch | 285,011 | 270,870 |
| Maple | 429,419 | 431,093 |
| Oak | 32,202 | 20,953 |
| Yellow birch | 43,284 | 33,947 |
| Other hardwood | 46,095 | 35,982 |
| Mixedwood | 401,623 | 574,672 |
Volume harvested by product sector (cubic metres)
| Product Type | Volume harvested in 2014 | Volume harvested in 2015 |
|---|---|---|
| Paper | 282,246 | 226,305 |
| Pulp | 3,036,173 | 3,011,744 |
| Sawmill | 7,377,881 | 7,450,826 |
| Veneer | 201,898 | 250,392 |
| Composite | 1,487,256 | 1,371,600 |
| Bioproduct | 401,666 | 574,715 |
| Commercial fuelwood | 205,772 | 149,850 |
| Other | 4,447 | 2,133 |
Area available and area harvested by silviculture system from 2006-2015
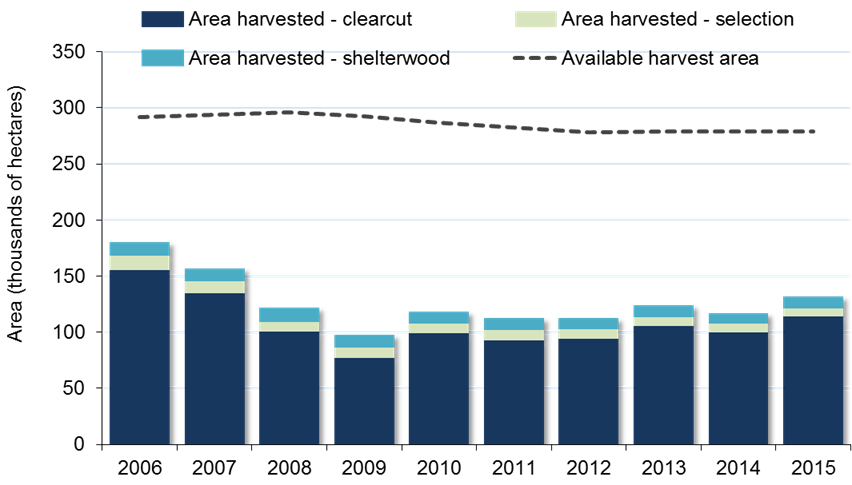
Column chart showing the area available for harvest and the actual area harvested by silviculture system from 2006-2015.
Volume available and volume harvested by tree species group from 2006-2015
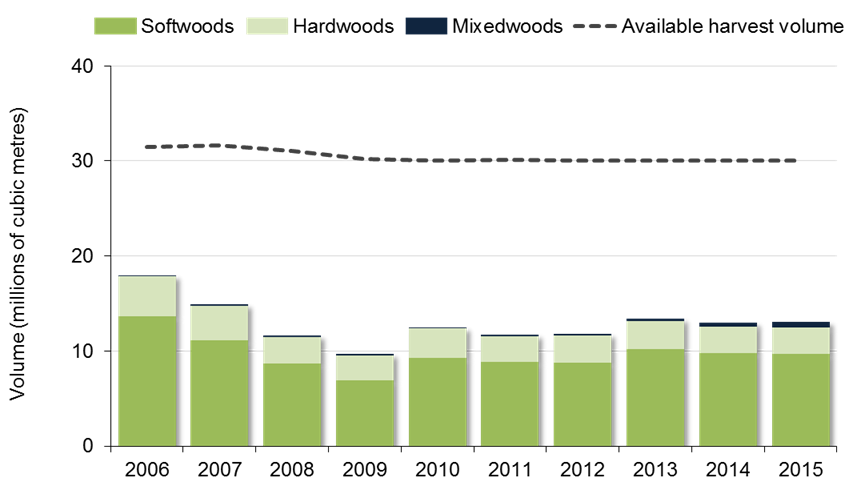
Column chart showing the volume available for harvest and the actual volume harvested by species group over time from 2006-2015.
Forest renewal
Forest renewal includes the silviculture operations used to establish and grow back the forest after harvesting. Renewal activities include site preparation, natural or assisted regeneration and tending.
Tending activities may be required to improve the survival, growth and quality of a regenerating forest. Protection operations manage or prevent damage from forest insects and disease.
For every cubic metre of wood harvested, forest managers contribute money to the Forest Renewal Trust to ensure there are sufficient funds available to regenerate harvested areas.
The tables and charts below summarize the planned and actual level of renewal activities within the Area of the Undertaking. Planned levels are based on projected activities in approved forest management plans and reflect planned levels of harvest.
The amount of area actually renewed is based on the amount of area that is harvested. This means that planned renewal levels cannot be directly compared to the actual renewal. In 2014 and 2015 both the area harvested and renewed were less than planned (see chart Area of planned and actual regeneration and harvest from 2006-2015).
- The level of renewal and tending activity was consistent with the previous 5 year average.
- Regeneration, site preparation and tending activity was 45% of planned levels (2 year average). This is consistent with the level of area harvested which was also 45% of the available area.
- Natural regeneration was used for 52% of the area renewed (2 year average).
- Assisted regeneration was used for 48% of the area renewed (2 year average).
- Tree planting was the main method of assisted regeneration. 51% of the trees planted were spruce and 41% were jack pine (2 year average).
- There were no protection operations (also known as forest pest management programs).
- Each year forest managers spent over $52 million per year renewing forests across the province (2 year average).
- Forest managers contributed $3.37 per cubic metre to the Forest Renewal Trust in 2014 and $3.62 per cubic metre in 2015.
Read more about forest renewal, methods of natural and assisted regeneration, and the silviculture systems used to renew forests at ontario.ca/page/forest-renewal.
Area renewed, tended and protected (hectares)
| Activity | Area in 2014 | Area in 2015 |
|---|---|---|
| Regeneration | 120,080 | 112,138 |
| Site Preparation | 40,157 | 42,072 |
| Tending | 58,798 | 61,540 |
| Protection (pest control) | 0 | 0 |
Area of actual and planned renewal and tending (hectares)
| Measure | Regeneration | Site Preparation | Tending |
|---|---|---|---|
| Planned area in 2014 (hectares) | 260,348 | 105,459 | 114,190 |
| Area treated in 2014 (hectares) | 120,080 | 40,157 | 58,798 |
| Proportion of planned in 2014 (%) | 46% | 38% | 51% |
| Planned area in 2015 (hectares) | 260,348 | 105,459 | 114,190 |
| Area treated in 2015 (hectares) | 112,138 | 42,072 | 61,540 |
| Proportion of planned in 2015 (%) | 43% | 40% | 54% |
Expenditures on renewal, tending and protection ($ CDN millions)
| Activity | Expenditures in 2014 | Expenditures in 2015 |
|---|---|---|
| Assisted regeneration | 18.0 | 20.0 |
| Natural regeneration | 1.6 | 1.4 |
| Site Preparation | 9.4 | 8.8 |
| Tending | 8.0 | 11.3 |
| Protection (insect pest control) | 0 | 0 |
| Renewal Support | 12.1 | 12.4 |
| Other Eligible Activities | 6.39 | 5.74 |
Table note: renewal support includes activities like cone collection, seed extraction and seedling purchases. Other eligible activities include silviculture surveys. Reported expenditures may include costs for some activities conducted in previous years.
Area regenerated - natural regeneration (hectares)
| Method | Area renewed in 2014 | Area renewed in 2015 |
|---|---|---|
| Clearcut silviculture system | 47,449 | 49,709 |
| Shelterwood silviculture system | 3,922 | 4,691 |
| Selection silviculture system | 7,501 | 7,121 |
| Total natural regeneration | 58,872 | 61,521 |
Area regenerated - assisted regeneration (hectares)
| Method | Area renewed in 2014 | Area renewed in 2015 |
|---|---|---|
| Tree planting | 50,095 | 43,676 |
| Seeding | 11,113 | 6,941 |
| Total assisted regeneration | 61,208 | 50,617 |
Number of trees and seeds used (millions)
| Type | Number in 2014 | Number in 2015 |
|---|---|---|
| Trees | 75.5 | 71.9 |
| Seeds | 506.0 | 289.4 |
Number of trees planted by species (millions)
| Species | Number in 2014 | Number in 2015 |
|---|---|---|
| Spruce | 37.6 | 37.1 |
| Jack Pine | 29.9 | 30.0 |
| Red Pine | 6.1 | 2.5 |
| White Pine | 1.9 | 2.3 |
| Other | 0.025 | 0.002 |
| Total trees planted | 75.5 | 71.9 |
Contributions and expenditures to forest trusts ($ CDN millions)
| Fund | Contributions in 2014 | Expenditures in 2014 | Contributions in 2015 | Expenditures in 2015 |
|---|---|---|---|---|
| Forest Renewal Trust Fund | 43.8 | 50.4 | 47.2 | 55.1 |
| Forestry Futures Trust Fund | 18.5 | 13.9 | 21.4 | 17.7 |
Area of renewal activities from 2006-2015
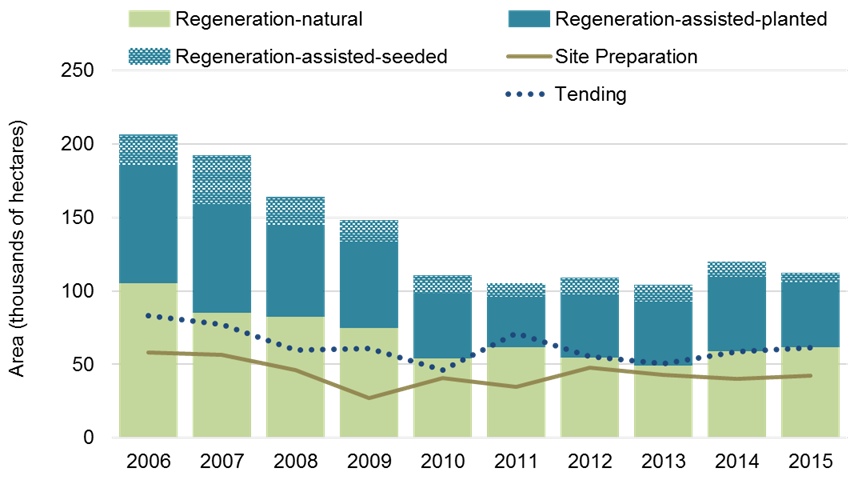
Column chart showing the area of renewal activities from 2006-2015.
Area regenerated by silviculture system from 2006-2015
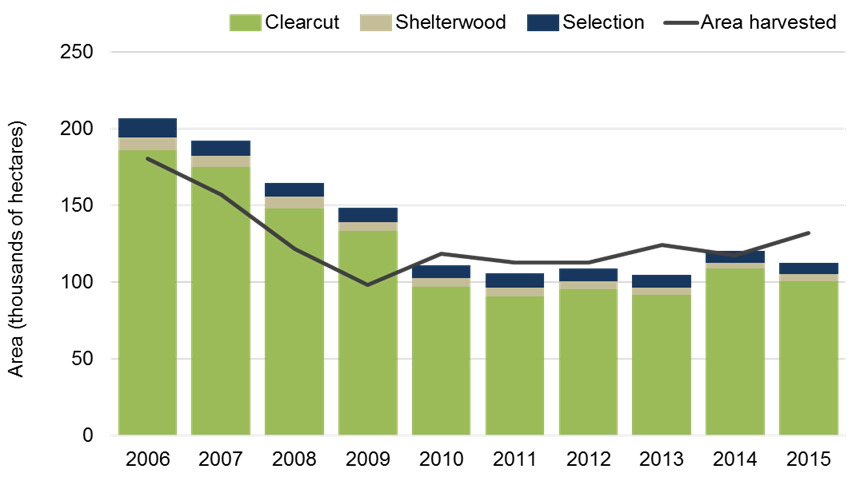
Column chart showing the area renewed by silviculture system from 2006-2015.
Tree species planted from 2006-2015
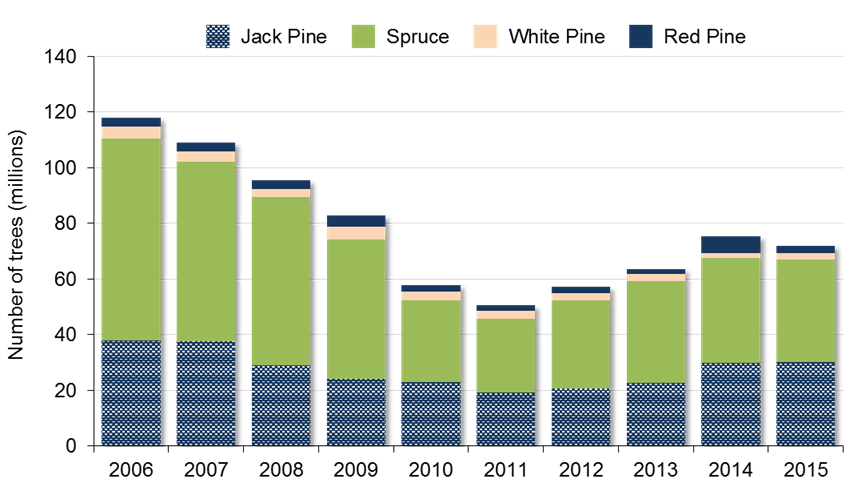
Column chart showing the number of trees planted by species over time from 2006 to 2015.
Area of planned and actual regeneration and harvest from 2006-2015
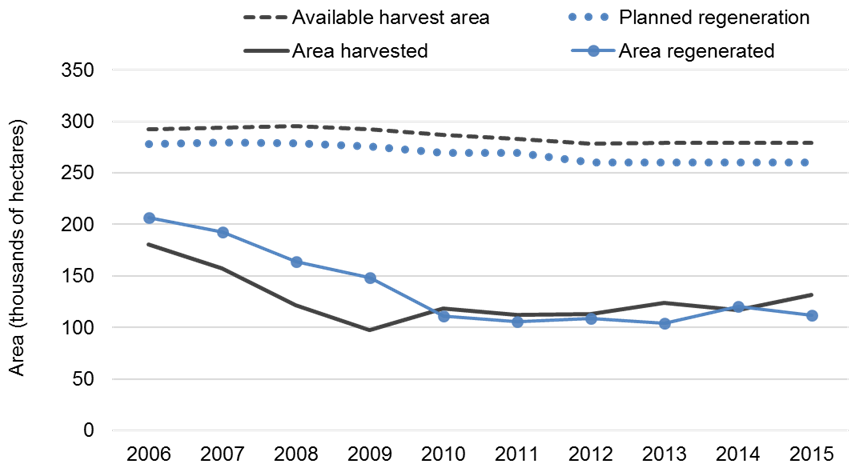
Line chart showing the planned and actual levels of harvest and regeneration from 2006-2015.
Proportion of renewal activities in 2014 and 2015 (average)
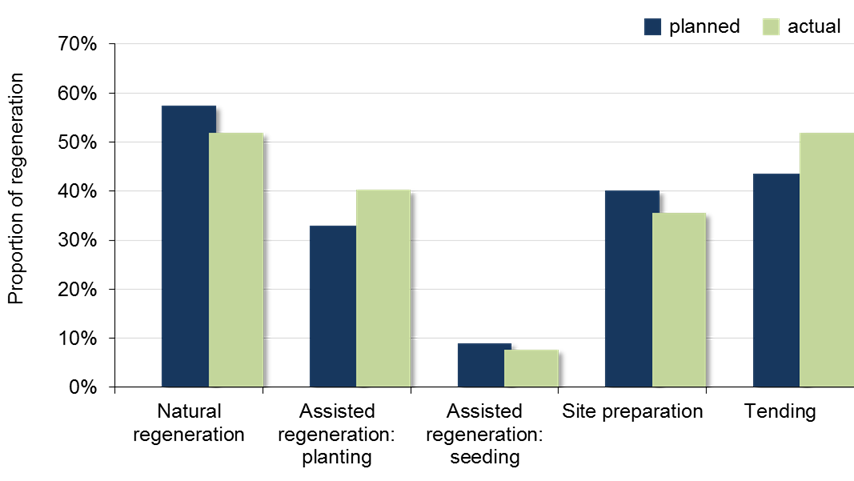
Column chart showing the proportion of renewal activity implemented in 2014 and 2015 (2 year average).
Contributions and expenditures to the Forest Renewal Trust from 2006-2015
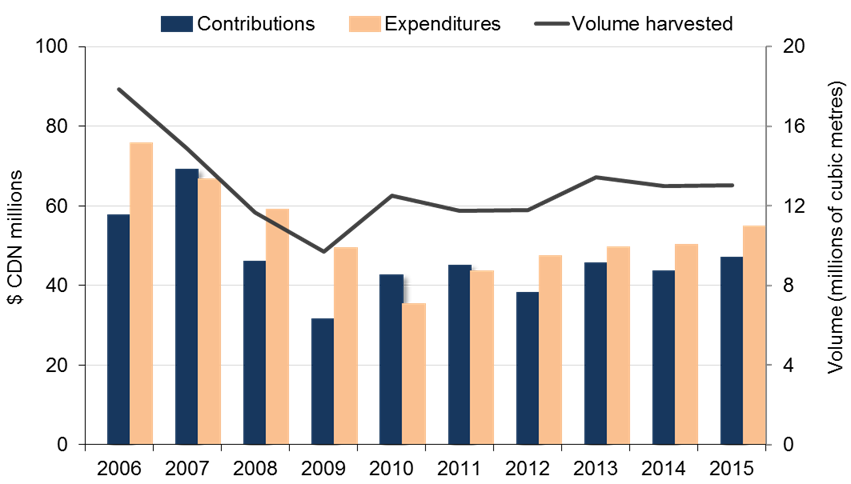
Column chart showing Forest Renewal Trust contributions and expenditures along with the trend in provincial harvest volume from 2006-2015.
Monitoring forest renewal
Ontario’s forest managers conduct surveys to assess the status of regenerating forest areas.
If an area has regenerated successfully, it is classified as free-to-grow. This means that the regenerating trees meet the stocking, height and growth rate targets and are deemed to be healthy and free from competing vegetation.
However, it does not mean that the area has met its targeted forest type. Areas that also achieve the planned forest type are classified as a silviculture success.
It can take 15 years or more after harvest for renewed areas to be successfully regenerated. Forest managers may determine that additional tending, treatment or time is required before some surveyed areas are considered free-to-grow.
The table and chart below summarize the survey results within the Area of the Undertaking. Percentages compare regeneration and silviculture success to the total area surveyed for that year.
- Results showed that 91% of the area surveyed was regenerated successfully (2 year average), which is consistent with the five-year average.
- Forest managers determined that 65% of the area surveyed was a silviculture success (2 year average), an increase from the five-year average.
Updated planning requirements will change how regeneration is monitored beginning with year 2020 forest management plans. This may alter how the status of regenerating areas is reported in the future.
For provincial trend information, read the forest indicator on forest regeneration at ontario.ca/forestindicators.
Status of regenerating areas surveyed
| Measure | 2014 | 2015 |
|---|---|---|
| Total area surveyed (hectares) | 85,894 | 124,065 |
| Area free-to-grow (hectares) | 79,589 | 111,634 |
| Proportion free-to-grow (%) | 93% | 90% |
| Area free-to-grow to target forest type: silviculture success (hectares) | 55,062 | 81,291 |
| Proportion free-to-grow to target forest type: silviculture success (%) | 64% | 66% |
Table note: percentages compare regeneration and silviculture success to the total area surveyed for that year.
Status of regenerating areas surveyed from 2006-2015
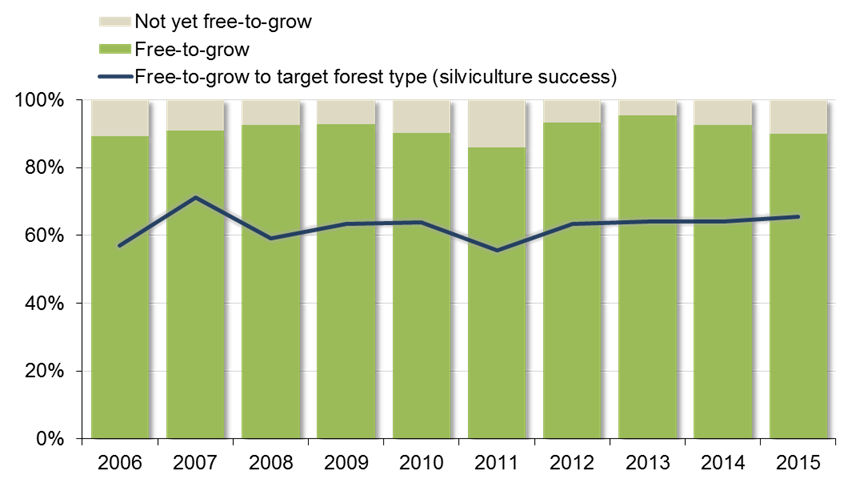
Column chart showing the proportion of successful regeneration and silviculture success from 2006-2015.
Forest industry
The sustainable harvest of renewable forest products by the forest industry provides social and economic benefits to Ontarians.
Harvesting trees from Crown forests requires a licence and payment of fees (Crown timber charges) for every cubic metre of wood harvested.
The tables and charts below summarize the forest industry statistics for employment, Crown timber charges, and active forest licences.
- The decline in jobs from 2014 to 2015 is a result of lower employment in the wood products manufacturing industry.
- The forest sector’s total revenue from manufacturing increased steadily reaching $13.4 billion in 2015.
- Licence levels remained steady.
- Crown timber charge payments averaged $98.6 million per year.
For provincial trend information, read the forest indicators on forest employment and stumpage at ontario.ca/forestindicators.
Read more about the different types of forest licences at ontario.ca/page/using-trees-crown-forests-commercial-purposes.
Forest sector employment and revenue
| Measure | 2014 | 2015 |
|---|---|---|
| Direct employment (number of jobs) | 63,175 | 57,617 |
| Revenue from goods manufactured ($ CDN billions) | 12.6 | 13.4 |
Table note: the data source for direct employment has changed. This may create inconsistencies if comparing the levels from this report to previous reports.
Forest sector total revenue from goods manufactured from 2006-2015
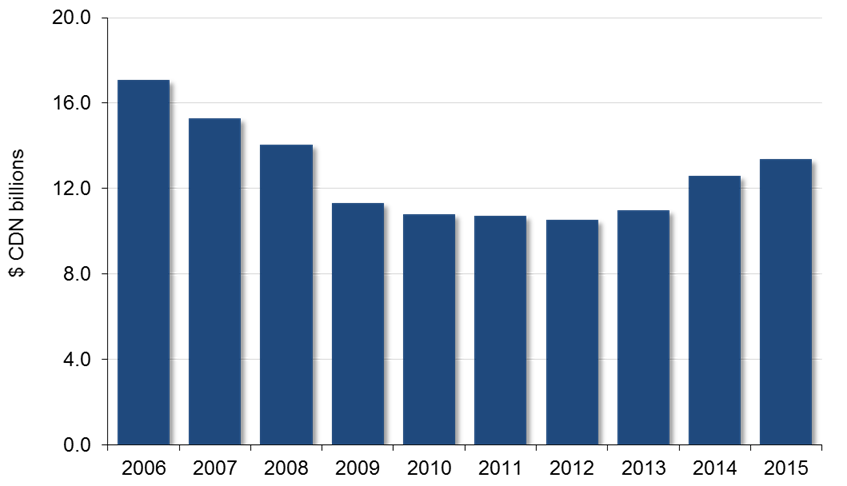
Column chart showing the forest sector’s total revenue from goods manufactured from 2006-2015.
Number of forest licences
| Type of licence | Number in 2014 | Number in 2015 |
|---|---|---|
| Sustainable forest licences | 31 | 31 |
| Commercial forest resource licences | 589 | 616 |
| Non-commercial forest resource licences | 3,173 | 3,142 |
| Total | 3,793 | 3,789 |
Crown timber charges paid ($ CDN millions)
| Crown timber charge type | 2014 | 2015 |
|---|---|---|
| Forestry futures charge paid into the Forestry Futures Trust | 18.5 | 21.4 |
| Forest renewal charge paid into the Forest Renewal Trust | 43.8 | 47.2 |
| Stumpage paid into the Consolidated Revenue Fund | 31.7 | 34.6 |
| Total charges paid | 94.0 | 103.2 |
Forest access roads
Forest managers report annually on forest access road construction, maintenance, abandonment, and controls. The tables and charts below summarize the amount of forest roads subject to each activity within the Area of the Undertaking.
- Consistent with the long term trend, the majority of road construction was for operational roads while the majority of road maintenance was for primary roads.
- More access controls were established using signage than gates or barriers.
- Road decommissioning was mainly through natural methods.
For provincial trend information, read the forest indicator on access roads at ontario.ca/forestindicators.
Read more about forest roads funding at ontario.ca/page/forest-roads-funding-program.
Length of forest roads constructed (kilometres)
| Road class | Length in 2014 | Length in 2015 |
|---|---|---|
| Primary | 111 | 191 |
| Branch | 340 | 296 |
| Operational | 3,447 | 3,852 |
| Total | 3,897 | 4,338 |
Length of forest roads maintained (kilometres)
| Road Class | Length in 2014 | Length in 2015 |
|---|---|---|
| Primary | 15,855 | 14,676 |
| Branch | 5,183 | 5,780 |
| Operational and Existing | 5,844 | 6,212 |
| Total | 26,882 | 26,668 |
Length of forest roads with access controls established (kilometres)
| Control method | Length in 2014 | Length in 2015 |
|---|---|---|
| Signage | 1,044 | 1,819 |
| Gate/Barrier | 847 | 1,077 |
| Total | 1,890 | 2,896 |
Length of forest roads decommissioned (kilometres)
| Decommission method | Length in 2014 | Length in 2015 |
|---|---|---|
| Physical | 283 | 512 |
| Natural | 1,231 | 968 |
| Total | 1,514 | 1,480 |
Forest road construction by road class from 2006-2015
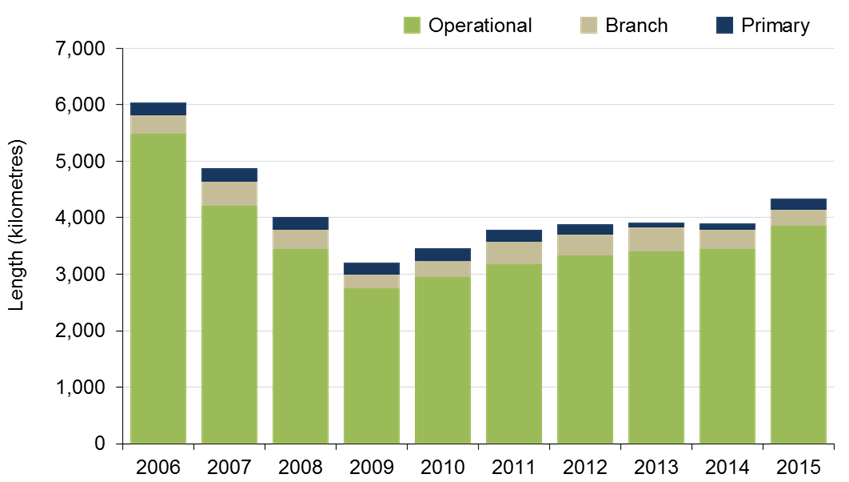
Column chart showing the length of forest access roads constructed by road category from 2006-2015.
Forest operations compliance
Compliance inspections determine if forest operations on Crown lands are following applicable rules and approved plans. Forest operations monitored for compliance include timber harvesting, road construction, water crossings and forest renewal.
Compliance monitoring occurs in partnership between the Ministry of Natural Resources and Forestry and the forest industry.
The tables and charts below summarize the results of compliance monitoring within the Area of the Undertaking.
- Inspections by the ministry and industry across all operations had an average compliance rate of 98% for 2014 and 2015.
- The proportion of inspections undertaken by industry and the ministry was consistent with previous years.
- Most inspection were related to access and harvesting and operations.
- The ministry implemented a risk based approach to conducing its compliance inspections in 2014.
- The majority of remedy and enforcement actions applied were written warnings.
For provincial trend information, read the forest indicator on operations compliance at ontario.ca/forestindicators.
Number of compliance inspections
| Inspector type | Number of inspections in 2014 | Number of inspections in 2015 |
|---|---|---|
| Ministry | 468 | 606 |
| Forest industry | 1,945 | 1,896 |
| Total | 2,413 | 2,502 |
Compliance inspection results
| Inspector type and result | Number of inspections in 2014 | Number of inspections in 2015 |
|---|---|---|
| Ministry: compliant | 441 | 582 |
| Ministry: non-compliant | 27 | 24 |
| Forest industry: compliant | 1914 | 1871 |
| Forest industry: non-compliant | 31 | 25 |
Compliance inspections results by type of operation
| Type of operations | Compliant inspections in 2014 | Non-compliant inspections in 2014 | Compliant inspections in 2015 | Non-compliant inspections in 2015 |
|---|---|---|---|---|
| Access | 697 | 13 | 727 | 14 |
| Harvest | 1,480 | 45 | 1,545 | 33 |
| Renewal | 142 | - | 138 | 1 |
| Maintenance | 36 | - | 43 | 1 |
| Total | 2,355 | 58 | 2,453 | 49 |
Remedy and enforcement actions
| Action type | Number of actions in 2014 | Value of actions in 2014 (dollars) | Number of actions in 2015 | Value of actions in 2015 (dollars) |
|---|---|---|---|---|
| Written warning | 35 | - | 45 | - |
| Order - stop/limit/amend | 0 | - | 0 | - |
| Order - repair | 2 | - | 4 | - |
| Order - compliance | 25 | - | 3 | - |
| Administrative penalty (paid into the Forestry Futures Trust) |
7 | 14,667 | 22 | 71,200 |
| Offence charge (paid into the Consolidated Revenue Fund) |
1 | 500 | 0 | 0 |
| License suspension and cancellation | 0 | - | 0 | - |
| Total | 70 | 15,167 | 74 | 71,200 |
Compliance inspections by operation type in 2014 and 2015 (average)
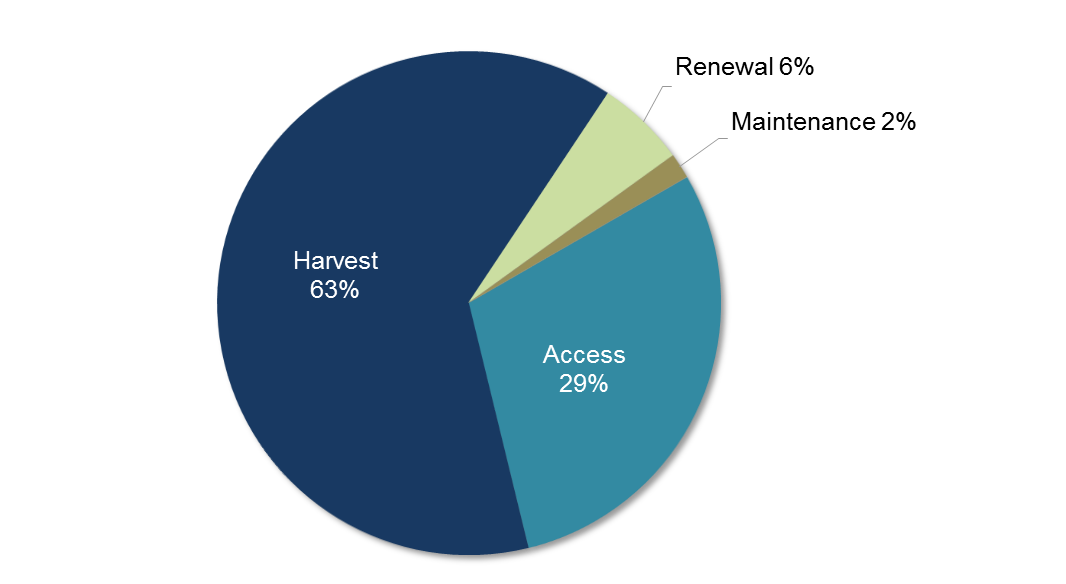
Pie chart showing the proportion of inspections by type of forest operations: 2 year average for 2014 and 2015.
Compliance inspection results from 2006-2015
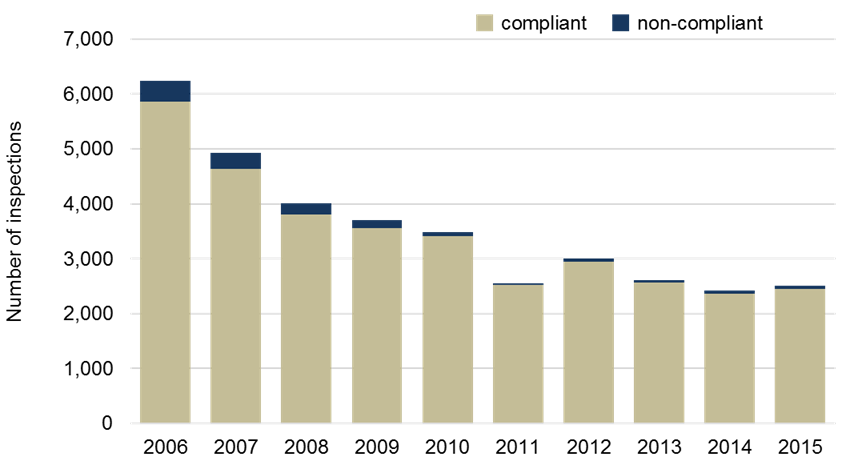
Column chart showing compliant and non-compliant inspections over time from 2006-2015.
Independent forest audits
Independent forest audits are conducted on all Crown forests at least once every 5-7 years. An independent auditor assesses the performance of both the sustainable forest licence holder and the Ministry of Natural Resources and Forestry in meeting their forest management responsibilities.
Audits may conclude that a forest is being managed:
- In compliance with the legislation, policies and the principles of sustainable forest management
- In compliance but with critical noted exceptions or conditions
- Not in compliance
Forest managers must address any exceptions or conditions to bring management of the forest into full compliance with all requirements.
The table below summarizes the results of the independent forest audits conducted in 2014 and 2015 by management unit.
- Results were generally positive with 10 of 11 audits concluding that the forests were managed in compliance with legislation and policy requirements, licence requirements, and with the principles of sustainable forest management.
- The sustainable forest licence holder’s bankruptcy and the transition of management responsibility to the ministry disrupted the delivery of the forest management program on the remaining unit.
- 8 forests received licence extension recommendations. The remaining 3 units had no sustainable forest licence holder therefore the licence extension recommendation did not apply.
- The exceptions and conditions noted in 2014 and 2015 audits included: confirming that planned objectives are consistent with the land base available for operations; ensuring that the level of conifer renewal is consistent with the planned future forest condition; creating a more robust and integrated information management system; demonstrating that the license holder is able to continue meeting forest management responsibilities into the future; resolving issues with the submission and review of planning documents and forest information products.
For provincial trend information, read the forest indicator on independent forest audits at ontario.ca/forestindicators.
View the audit reports for each management unit at ontario.ca/page/independent-forest-audits.
Independent forest audit results
| Year of audit | Management unit | In compliance | Sustainable Forest Licence extension recommended by auditor |
|---|---|---|---|
| 2014 | Big Pic Forest | No | not applicable - Crown unit |
| 2014 | Caribou Forest | Yes | Yes |
| 2014 | Lakehead Forest | Yes | Yes |
| 2014 | Whiskey Jack Forest | Yes with exceptions | not applicable - Crown unit |
| 2014 | White River Forest | Yes | Yes |
| 2015 | Dog-River Matawin Forest | Yes | Yes |
| 2015 | English River Forest | Yes | Yes |
| 2015 | Kenogami Forest | Yes | not applicable - Crown unit |
| 2015 | Red Lake Forest | Yes with exceptions | Yes with conditions |
| 2015 | Trout Lake Forest | Yes | Yes |
| 2015 | Wabigoon Forest | Yes with exceptions | Yes with conditions |
Table note: in compliance means generally managed in compliance with the legislation and policies that were in effect during the audit period, as well as with the principles of sustainable forest management.
Forest management planning implementation
Before any forestry activities can take place, a forest management plan must be in place. Preparing and implementing a forest management plan is a rigorous process that engages the public, stakeholders, and Indigenous communities at various stages.
Forest managers report each year on the forest management activities conducted in a management unit.
The tables and charts below summarize the implementation of the forest management planning in 2014 and 2015 including plan approvals, amendments, issues raised during planning, and annual report submissions.
- All of the forest management plans approved were phase II operational plans.
- Approved amendments were mostly administrative (96%) and the majority related to forest access roads and harvest areas.
- There were no contingency plans or contingency plan amendments approved.
- The issues raised during public and indigenous consultation included: values protection, access, new roads, wildlife habitat, harvest, and access management.
- The issue resolution process was initiated for half of the forest management plans.
- Interested parties submitted 8 individual environmental assessment requests to the Ministry of Environment, Conservation and Parks for 6 forest management plans. No requests were granted; however, additional conditions were imposed on the Sudbury, Nagagami, and Bancroft-Minden plans.
- In both 2014 and 2015, 40 of 41 management unit annual reports were submitted. The remaining report was for a Crown managed unit with little to no forest management activity.
Read more about forest management planning at ontario.ca/page/forest-management-planning.
View the forest management unit map and the renewal schedule for forest management plans at ontario.ca/page/management-units-and-forest-management-plan-renewal-schedules.
Find the official forest management plans on the Find a Forest Management Plan website at ontario.ca/forestplans.
Number of forest management plans approved
| Plan type | Number in 2014 | Number in 2015 |
|---|---|---|
| Forest management plans | 9 | 13 |
| Contingency plans | 0 | 0 |
| Total | 9 | 13 |
Number of forest management plan amendments approved
| Category of amendment | Number in 2014 | Number in 2015 |
|---|---|---|
| Administrative | 145 | 129 |
| Major | 1 | 1 |
| Minor | 4 | 5 |
| Total | 150 | 135 |
Individual environmental assessment requests
| Year of request | Forest management plan | Number of requests | Number granted | Nature of the request |
|---|---|---|---|---|
| 2014 | Spanish Forest | 1 | 0 | cottagers concern regarding wildlife, viewscapes and values collection |
| 2014 | Sudbury Forest | 2 | 0 | environmental group concern regarding harvesting adjacent to waterway park and canoe route buffers |
| 2014 | Nagagami Forest major amendment | 2 | 0 | tourism concerns regarding a new road |
| 2015 | Bancroft-Minden Forest | 1 | 0 | cottagers concern regarding effects on water quality |
| 2015 | Black Spruce Forest | 1 | 0 | harvest effects on brook trout |
| 2015 | Kenogami Forest | 1 | 0 | Indigenous community concern regarding protection of fish spawning areas |
Table note: The individual environmental assessment requests for the Sudbury, Nagagami and Bancroft-Minden plans were denied with conditions.
Indigenous people’s participation in the benefits from forest management
Declaration Oder MNR-75 requires district managers to conduct negotiations at the local level with Indigenous communities. These negotiations identify and implement ways of achieving more equal participation by Indigenous peoples in the benefits provided through forest management.
Forest management activities can provide local opportunities for employment and business development. The involvement and participation of Indigenous communities, the forest industry, and other government bodies is critical to the success in providing these opportunities.
Arrangements and agreements take different forms to meet the unique needs, capacities, and situations of individual Indigenous communities. They may involve entire communities, individual community members or businesses. Local forest-based economic opportunities may include:
- Forest harvesting licenses or contracts
- Silviculture contracts for growing nursery stock, planting trees, seeding, thinning, and site preparation
- Contracts for other forest management activities such as wood hauling and road maintenance or construction
- Forestry related training and development
In 2014, some of the results of ministry and Indigenous communities’ discussions included:
- Sault Ste. Marie District: contracts for producing 400,000 seedlings, collecting 500 hectolitres of cones, and tending 980 hectares
- Sudbury district: licence for harvesting 91,650 cubic metres, sponsorship for community members to attend compliance training courses
- Hearst district: licence for harvesting 24,850 cubic metres
- Dryden district: licence for community harvesting 43,000 cubic metres
- North Bay district: licence for community harvesting 18,000 cubic metres
In 2015, some of the results of ministry and Indigenous communities’ discussions included:
- Bancroft district: contract for tree marking 39 ha, and training provided to the community for tree planting
- Algonquin park: contract for harvesting 56,220 cubic metres and tree marking 901 hectares
- Nipigon district: license for harvesting 485,542 cubic metres
- Kenora district: license for harvesting 82,348 cubic metres and a contract for monitoring forest roads and controlling beaver
- Red Lake district: licence for harvesting 39,236 cubic metres
Indigenous people have been active participants and are increasingly interested in being involved in forest management and the forest sector.
For provincial trend information, read the forest indicator on forest harvest by Indigenous people at ontario.ca/forestindicators.
Conclusion
This report has provided key information on sustainable forest management activities within the Area of the Undertaking.
The next report will be prepared in 2019 covering activities from April 1, 2016 to March 31, 2018.
Your feedback is appreciated. Provide comments on this report, or find out more about forestry and forest management in Ontario visit our forestry webpage.
ISSN 1485-743X (Print) – English
ISSN 1703-8332 (Online) – English