The content on this page is no longer up to date. It will remain on ontario.ca for a limited time before it moves to the Archives of Ontario.
Module 1: Additional information about fuels and supply
Module 1 - Additional information about fuels and supply
This module provides additional information about the different fuels discussed in the body of the FTR and their respective supply chains:
- Natural Gas;
- Propane;
- Oil Products;
- Wood and biomass; and
- Alternative fuels.
Each section of the module contains a discussion of fuel group-specific:
- Supply and production sources;
- Delivery;
- Trends; and
- Capacity sufficiency.
The level of detail and discussion varies for each fuel group, reflecting the variability in the characteristics of the fuels and the supply chains for each of the different fuels.
1.1 Natural Gas
1.1.1 Supply Sources
Historically, natural gas supplies to Ontario have been sourced primarily from the Western Canadian Sedimentary Basin (WCSB) located in Alberta, Saskatchewan and British Columbia. Over the last five years however, Ontario has been increasingly supplied by natural gas basins located in the US. Recent developments in shale gas extraction have led to conventional supplies being displaced by natural gas moving north from shale resources in the Appalachian Basin (i.e., extending over the states of New York, Pennsylvania, Maryland, Ohio, West Virginia, Virginia, Kentucky, Tennessee and Alabama) in the US.
Figure 1 below illustrates this shift.
Figure 1: Ontario Natural Gas Supply by Source
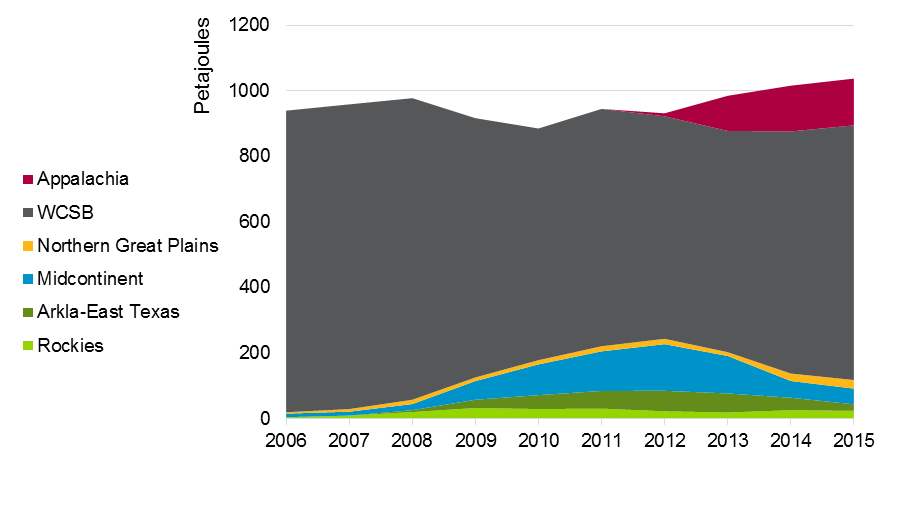
Source: Navigant’s North America Natural Gas Market Outlook, Spring 2016; RBAC Inc.
| Source | 2006 | 2007 | 2008 | 2009 | 2010 | 2011 | 2012 | 2013 | 2014 | 2015 |
|---|---|---|---|---|---|---|---|---|---|---|
| Rockies | 4476150.69 | 9303406.445 | 20308900.13 | 32775109.35 | 29602148.87 | 30798350.01 | 22741479.07 | 19114017.87 | 26033138.15 | 23943925.73 |
| Arkla-East Texas | 202396.7706 | 367198.756 | 5795696.873 | 25079643.34 | 42379426.56 | 53928195.28 | 62364713.67 | 58017665.67 | 38060581.27 | 20101605.08 |
| Midcontinent | 10983011.19 | 11782006.77 | 18737114.86 | 57053613.09 | 93849802.07 | 120672124.4 | 142313343.3 | 114181274.2 | 51001432.17 | 47794533.36 |
| Northern Great Plains | 4180638.234 | 7993205.847 | 13109010.63 | 11004596.54 | 12626887.97 | 15673072.74 | 16227513.27 | 11565771.97 | 22745879.23 | 26255355.86 |
| WCSB | 919325076.7 | 929089951.7 | 919370126.5 | 790361823.4 | 706498379.7 | 723497862.9 | 678398445.6 | 674597099.1 | 738120169.8 | 776297050.4 |
| Appalachia | 0 | 0 | 0 | 0 | 0 | 0 | 9165403.019 | 107109535.2 | 139498675.9 | 142600931.9 |
As discussed further in the delivery section below, Ontario has pipeline connections to multiple North American natural gas supply basins.
Natural gas imports from the Appalachian Basin (which includes the Utica and Marcellus shales) tend to be concentrated at Niagara Falls, which was converted into an import point in November 2012. Interest in accessing Appalachian Basin supplies is driven by economics. Since the Appalachian Basin is closer to Ontario than is Western Canada, supply from the Appalachian Basin can have a lower delivered cost into Ontario than Western Canadian supply, leading to increased viable competition.
Of note, the total natural gas energy supplied to Ontario in 2015 (over 1,000 petajoules) is equivalent to approximately twice the amount of electric energy consumed by the province in that year.
1.1.2 Delivery
Natural gas is moved across Canada and between Canada and the US along a complex system of pipelines.
Natural gas is transported from its source (producing wellheads) along gathering pipelines to processing facilities. Processing facilities remove impurities from the natural gas to ensure the product meets pipeline specifications; some processing plants also extract natural gas liquids (e.g., ethane, propane, butane) for resale. From here, the processed product may move long distances via transmission pipelines. For Canadian pipelines, the National Energy Board (NEB) regulates companies that own and/or operate interprovincial or international pipelines (both natural gas and liquids pipelines).
Often, natural gas is placed into underground storage so it can be delivered regionally to market during periods of peak demand (e.g., winter heating season).
Once closer to its destination, product is transferred to distribution lines, which are operated by local distribution companies. Ontario local distribution companies are regulated by the Ontario Energy Board (OEB). It is these distribution lines (and feeder lines) that move the gas from the transmission system to the customer burner tip. Compressors, located at stations spaced at regular intervals along the pipeline, are used to regulate the pipeline pressure that transports the natural gas. Figure 2 illustrates the natural gas delivery network.
Figure 2: Natural Gas Delivery
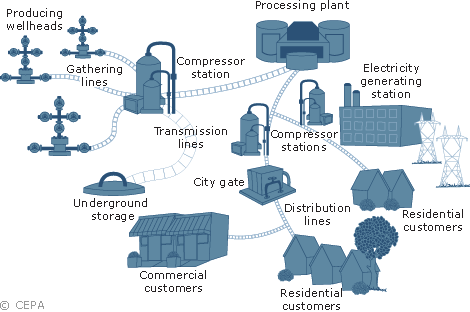
Source: Canadian Energy Pipeline Association (CEPA), 2016.
Transmission (Pipelines)
As discussed earlier in the report, Ontario relies on natural gas produced outside of the province to meet its needs.
The longest natural gas pipeline system in Canada is the TransCanada Mainline which extends from the Prairies across Canada, passing north of the Great Lakes and into Southern Ontario. This system transports natural gas from the Alberta/Saskatchewan border and the Ontario/US border to serve eastern Canada and the US. The TransCanada Mainline consists of multiple lines along its route. The “Eastern Triangle” segment of the Mainline extends from North Bay, to the southeast and southwest, supplying the Ontario, Quebec, and export markets. The TransCanada Mainline, the Eastern Triangle, and other major pipelines are illustrated in Figure 3 below. The Ontario “Eastern Triangle” is highlighted in this map with a red dashed line.
Figure 3: Natural Gas Pipelines
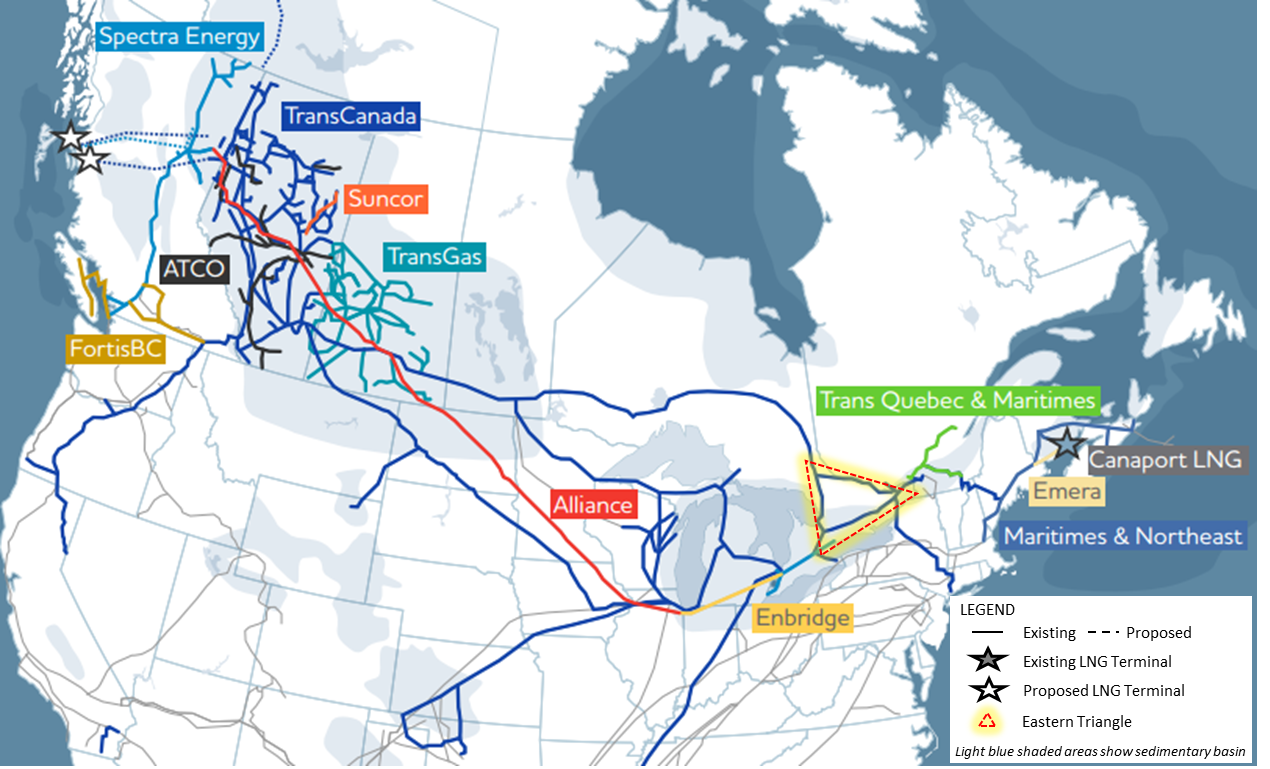
Source: Canadian Energy Pipeline Association, 2016.
While TransCanada owns the Eastern Triangle, Union Gas Ltd owns the transmission pipeline between the Dawn Hub (near Sarnia) and Parkway (a delivery point that connects with TransCanada’s Eastern Triangle). This pipeline connects the key gas pricing hub and storage at Dawn with the TransCanada pipeline to the northeast, and US markets to the south. This Union Gas transmission pipeline is located entirely within Ontario and is regulated by the Ontario Energy Board.
Distribution
Ontario’s regulated local distribution companies have franchise agreements with municipalities across the province. A franchise agreement allows a local distribution company to provide service and must be approved by the OEB. Investor owned local distribution companies are regulated by the OEB in Ontario (Note: Two municipalities, Kitchener and Kingston, provide gas service in their own service territory and are not regulated by the OEB).
Municipalities with franchise agreements are generally located adjacent to major natural gas transmission infrastructure. Coverage in southern Ontario, the GTA and eastern Ontario (near Ottawa) is quite good.
Similarly, communities in northern Ontario located near the TransCanada pipeline system also have franchise agreements (Note: that not all areas in a municipality with a franchise agreement would necessarily have gas service. For instance, it may not be economically viable for a distribution company to connect to some customers in rural and remote areas).
Figure 4: Ontario Gas Distribution Franchise Areas
Source: Union Gas
Communities without a franchise agreement do not currently have natural gas access. These communities are typically rural or remote communities located some distance from natural gas transmission infrastructure.
The Government of Ontario has publicly announced its intention to support the expansion of natural gas access to more areas of the province
On February 17, 2015, the Minister of Energy wrote the OEB requesting it move forward on a timely basis to examine opportunities to facilitate access to natural gas services to more communities and to ensure the rational expansion of the natural gas transmission and distribution system in Ontario.
Storage
The Dawn Hub is the major trading hub in Ontario, and in Canada, providing direct access to major supply basins in North America. Western Canadian natural gas can access Dawn using the TransCanada system to the Manitoba/US border and then the Great Lakes Gas Transmission line to southwestern Ontario. Dawn is also supplied by the Alliance-Vector pipeline system, which originates in northeastern BC and passes through Chicago. Other, smaller, U.S. pipeline systems also connect to Dawn.
Over 100 companies actively trade at Dawn, and it is located near the largest natural gas storage facilities in Canada. Storage capacity at the Dawn Hub is 272 billion cubic feet (bcf), split between Enbridge (112 bcf
1.1.3 Supply Sources
Starting in 2008, North American natural gas supply prospects changed dramatically, from impending scarcity to an era of growing production and supply abundance. The high prices and volatility of the preceding decade encouraged the development of shale gas resources. Prior to that development, shale gas was known to exist in many areas, but was largely uneconomic to develop. The effectiveness and cost of horizontal drilling and hydraulic fracturing, two previously known technologies that had not yet been employed together, improved to the point where unconventional production could be grown to unprecedented levels.
As discussed earlier, significant increases in shale gas production have occurred in the Marcellus and Utica shale. The development of shale gas has spurred interest in increasing Ontario’s access to this resource. As shown below, these resources are located in the Appalachian region proximate to Ontario. At this time, there does not appear to be commercially exploitable shale gas resources in Ontario.
Figure 5: North American Shale Gas and Shale Oil Resources

Source: US Energy Information Administration based in data from various published studies. Canada and Mexico plays from ARI.
Another trend in Ontario is interest from rural and remote communities to access natural gas. The OEB recently conducted a Generic Hearing to review the regulatory options to increase access to natural gas.
1.1.4 Capacity Sufficiency
Current natural gas supply and delivery capacity is sufficient to meet peak demand. Substantial amounts of shale gas remain unextracted. The large storage facilities at Dawn increase flexibility and ensure gas is supplied year round and during peak seasons stabilizing prices throughout the year.
1.2 Propane
Although not consumed in the same volume as natural gas or refined petroleum products such as motor gasoline and diesel fuel, propane is a key part of Ontario’s combustible fuel mix. Propane consumption is niche-driven, often serving as a stable, economically transportable alternative to natural gas in rural and remote areas.
1.2.1 Supply Sources
Ontario demand for propane and other natural gas liquids was over 50 PJ in 2015.
Since propane is extracted from natural gas, significant quantities are imported into Ontario from Western Canada and other continental sources by rail.
Only 1% of propane used in Canada in 2013 was imported
However, unlike natural gas, Ontario does have domestic propane production sources. Ontario’s four petroleum refineries produce propane and an industrial facility in Sarnia-Lambton (called a "fractionator") processes a pipeline delivered NGL-mix into products such as propane, butane and ethane for the Ontario and regional market.
1.2.2 Delivery
Propane reaches end-users by a complex distribution network.
Propane is a natural gas liquid (NGL) that is extracted at natural gas processing facilities. Propane is also a by-product of the petroleum refining process.
Propane produced in Western Canada can be delivered to Ontario distribution terminals by rail.
Alternatively, propane can be produced at Ontario petroleum refineries. This production method uses the infrastructure in the oil products supply chain. Similarly, the fractionator facility in Sarnia that produces propane is supplied with NGL that are transported using part of the pipeline infrastructure that supplies Ontario’s refineries.
Within Ontario, propane is delivered to end users by truck. About 140 large propane distribution facilities are located in Ontario. These facilities may be supplied by truck or (for larger facilities) by rail and have above-ground propane storage tanks.
Propane can also be stored underground in salt caverns and depleted production wells. Typically, propane is injected into storage in summer months and withdrawn from storage in winter months. Ontario uses storage infrastructure in the Sarnia-area to manage seasonal demand. The Sarnia area is a key propane storage hub in eastern North America and is used to manage propane demand by end-users in Ontario, Quebec and the eastern U.S.
The propane delivery network and supply chain is illustrated below:
Figure 6: Propane Delivery Network
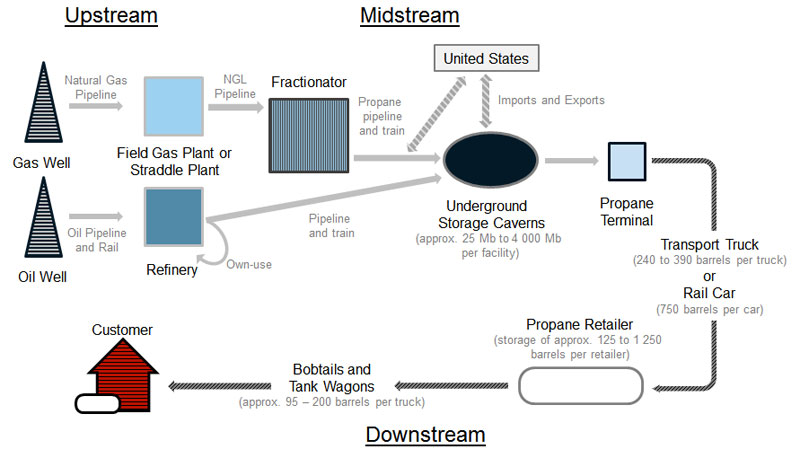
Source: NRCan
1.2.3 Trends
Propane demand in Canada has grown in recent years, partly driven by the growing use of propane for residential heating in Ontario. Ontario consumes more propane for home heating than the rest of Canada combined, and residential propane consumption for heating has grown steadily since 2005.
1.2.4 Capacity Sufficiency
As primarily a by-product of natural gas, propane availability in North America is closely tied to North American natural gas production.
Consequently, U.S. propane supply is expected to grow significantly; while this surplus is expected to mostly flow overseas as exports, the growing U.S. surplus may provide some additional relief in times of very high demand in Canada and the U.S.
1.3 Oil Products
Unlike natural gas, the oil products supply chain contains an additional intermediate step- petroleum refining. Petroleum refineries process crude oil into finished oil products such as gasoline, diesel and jet fuel.
This sub-section discusses supply chain considerations for both crude oil and oil products.
1.3.1 Supply Sources
Crude Oil
Ontario produces only minor amounts of crude oil – less than 0.08% of total Canadian production in 2015
Figure 7: Ontario Crude Oil Supply by Source
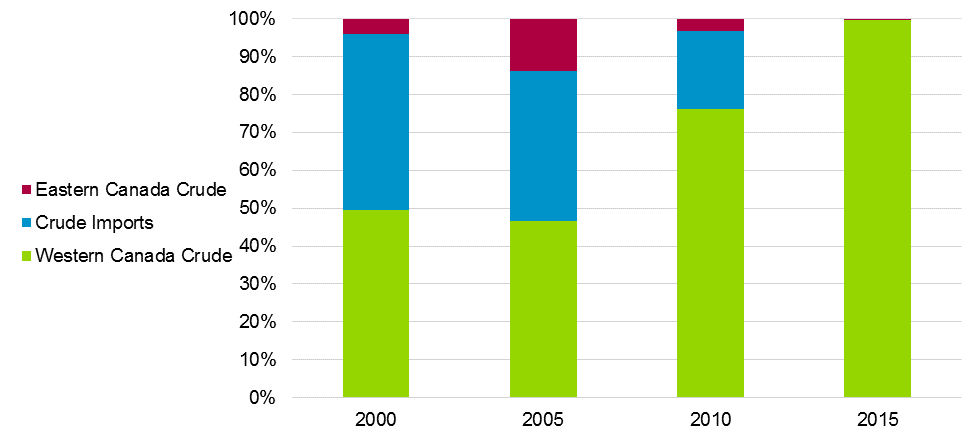
Source: Statistics Canada
| Source | 2000 | 2005 | 2010 | 2015 |
|---|---|---|---|---|
| Western Canada Crude | 13571581 | 10859032 | 16036770 | 20400831 |
| Eastern Canada Crude | 1123755 | 3200576 | 689409 | 57277 |
| Crude Imports | 12639115 | 9175527 | 4311270 | 0 |
Oil Products
The provincial demand for the primary oil products used as fuels: (i.e., excluding petrochemical feedstocks and asphalt) is illustrated in Figure 8. Similar to natural gas, Ontario’s total use of oil products as fuels is close to 1,000 PJ annually. (i.e., roughly equivalent to approximately twice the amount of electric energy consumed by the province in a year).
Gasoline, diesel and jet fuel are common transportation fuels. Light fuel oil incorporates fuels used for home heating as defined by Statistics Canada – this category includes all distillate fuels for power burners, heating oil number 2, heating oil number 3, furnace fuel oil, gas oil and light industrial fuel. Heavy fuel oil would primarily relate to fuels used in industrial processes – as defined by Statistics Canada it includes fuel oils numbers 4/5/6 and residual fuel oil.
Figure 8: Oil Product Provincial Demand, 2011 - 2014
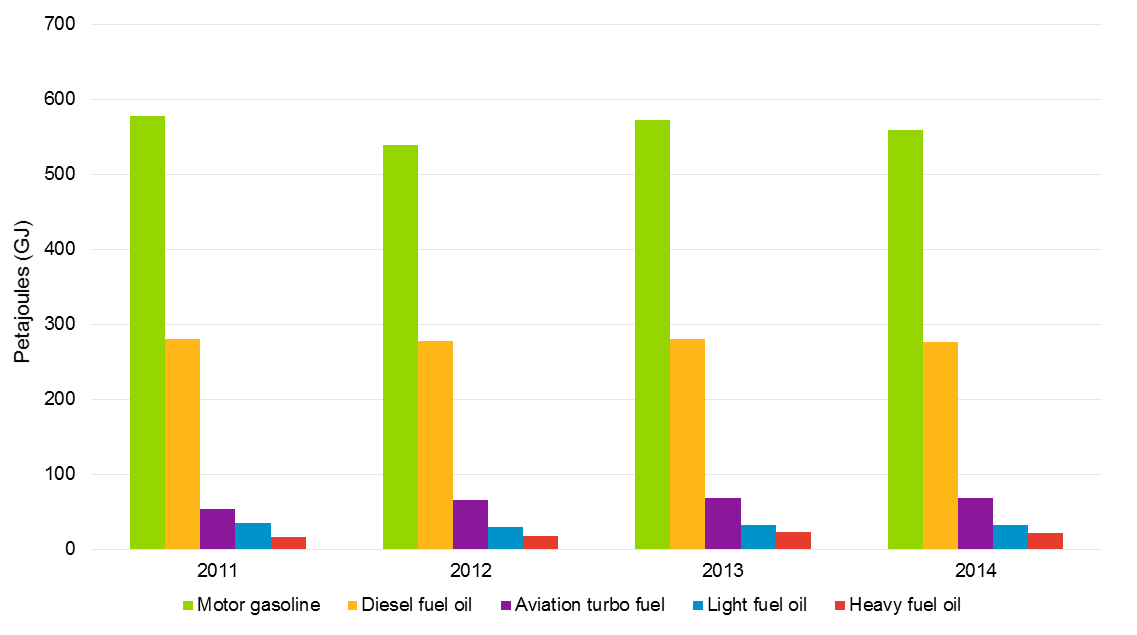
Source: Statistics Canada
| Fuel Type | 2011 | 2012 | 2013 | 2014 |
|---|---|---|---|---|
| Motor gasoline | 576964500 | 538524000 | 572285000 | 558547500 |
| Diesel fuel oil | 279808310 | 277200080 | 279712560 | 276472380 |
| Aviation turbo fuel | 53728992 | 65164842 | 68161212 | 67834980 |
| Light fuel oil | 34807480 | 29887640 | 31750040 | 31435760 |
| Heavy fuel oil | 16290250 | 17777750 | 22741750 | 21046000 |
Figure 9: Supply and Disposition of Refined Petroleum Products – Ontario 2015
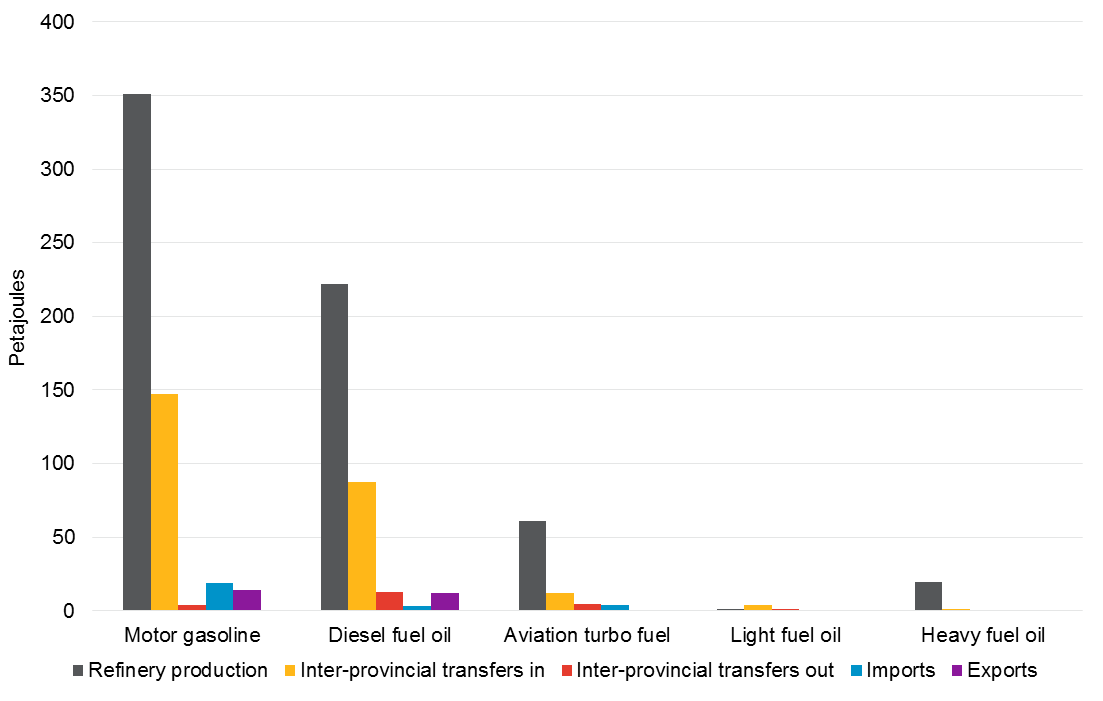
Source: Statistics Canada
| Source | Motor gasoline | Diesel fuel oil | Aviation turbo fuel | Light fuel oil | Heavy fuel oil |
|---|---|---|---|---|---|
| Refinery production | 350729726.7 | 222137395.6 | 61289064 | 1014309.6 | 19802744 |
| Inter-provincial transfers in | 147232155 | 87577883.04 | 11865454.99 | 4243323.2 | 1056107.782 |
| Inter-provincial transfers out | 3697638 | 12483712.65 | 4428067.5 | 942979.68 | 759548.8 |
| Imports | 18674320 | 3464235 | 3611317.32 | 89550.4 | 401516.5091 |
| Exports | 14087500 | 12364067.28 | 0 | 0 | 0 |
Overview
Oil products reach end users by a complex infrastructure network.
Gathering lines move crude oil from the production wells to oil batteries (or storage tanks), and smaller diameter feeder lines transport crude oil from the batteries to nearby refineries or pipeline terminals. Crude oil that is transported to Ontario from across the country travels via long-haul transmission pipelines. For Canadian pipelines, the National Energy Board (NEB) regulates companies that own and/or operate interprovincial or international pipelines (both natural gas and liquids pipelines). Crude oil can also be transported by other modes, such as rail, marine and truck.
Once at a refinery, crude oil is processed into a variety of oil products. Oil products are then transported by pipeline, rail, marine and truck to end-users and distribution terminals. From primary distribution terminals, oil products are typically delivered to the final distribution point (e.g., gas station) by truck.
Figure 10 below illustrates the crude transmission network, as well as downstream refining and distribution.
Figure 10: Crude Oil Delivery
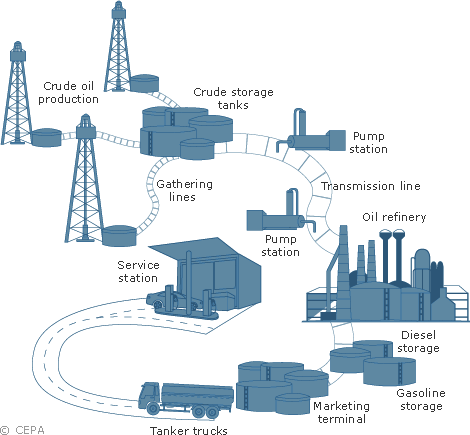
Source: Canadian Energy Pipeline Association (CEPA), 2016.
Transmission (Pipelines)
As noted above, nearly all of Ontario’s crude oil imports come from Western Canada. The liquids pipeline network exits Western Canada and connects to terminals and refineries across Canada and into the U.S. Notable pipelines that extend from Western Canada to the East include Spectra Energy’s Express and Platte pipeline, Kinder Morgan’s Cochin pipeline, TransCanada’s Keystone, and the Enbridge Mainline system. Figure 11 illustrates Canada’s main liquids pipelines.
Figure 11: Liquids Pipelines
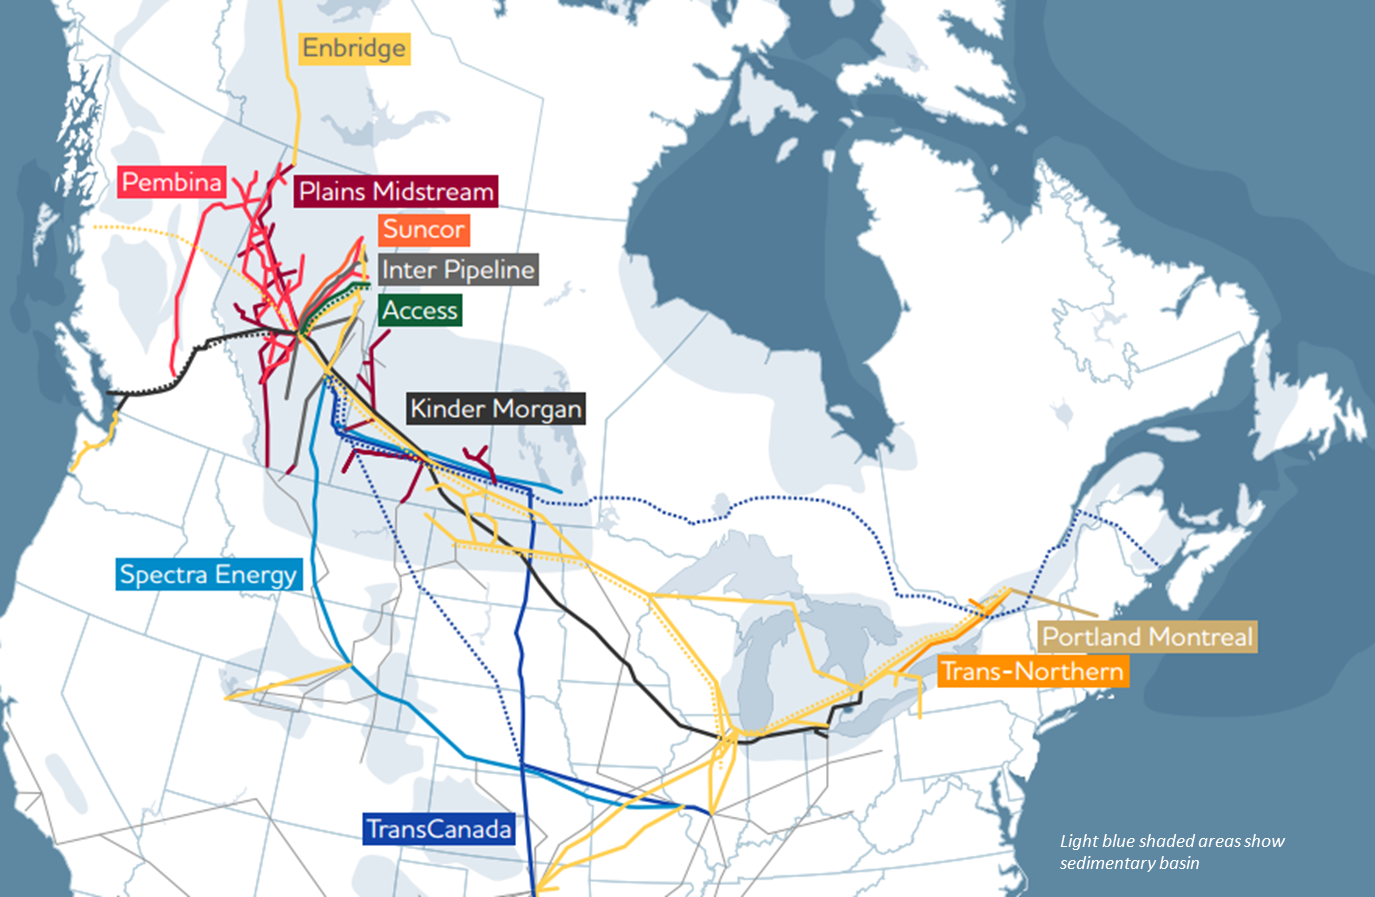
Source: Canadian Energy Pipeline Association, 2016.
The most relevant oil transmission pipeline to Ontario is the Enbridge Mainline (the yellow line in Figure 11). The Enbridge Mainline supplies refineries in Sarnia with crude oil via Line 5 (a northern route via Michigan) and Line 6 (southern route via Chicago). Line 5 also supplies natural gas liquids (NGLs) to a fractionator in Sarnia (a fractionator process NGL into ethane, propane and butane).
Enbridge Line 9 currently delivers crude oil from Sarnia to Montreal, QC. In Ontario, at an Enbridge terminal facility near Hamilton (called Westover)
Another key interprovincial pipeline system is the Trans-Northern Pipeline (the orange line in Figure 11). The Trans-Northern Pipeline originates in Montreal and transports refined products (such as gasoline, diesel fuel, etc.) to eastern Ontario and GTA-area distribution terminals. The Trans Northern pipeline also allows the Nanticoke refinery to supply the Hamilton and GTA-area terminals.
Additionally, two refiner-owned pipelines connect Sarnia refiners to southern Ontario and GTA primary distribution terminals.
Distribution
Crude oil is converted into petroleum products at refineries. Ontario has four refineries and a combined capacity of 393,000 b/d, as illustrated in Table 1 below.
As discussed earlier, Ontario refiners supply a significant portion of the fuels used in the province.
| Owner | Location | Capacity (b/d) | Products |
|---|---|---|---|
| Imperial Oil | Sarnia, ON | 121,000 | Gasoline, aviation fuel, diesel, home heating fuel and marine fuel. |
| Imperial Oil | Nanticoke, ON | 112,000 | Gasoline, aviation fuel, diesel, home heating fuel, heavy fuel oil, and asphalt. |
| Suncor Energy | Sarnia, ON | 85,000 | Gasoline, kerosene, jet and diesel fuels. |
| Shell Canada | Sarnia, ON | 75,000 | Gasoline, distillates, liquid petroleum gas, heavy oils, pure chemicals, solvents. |
Source: Companies’ Websites, 2016
After crude oil is refined into various petroleum products it is transported to terminals within the province for final distribution to consumers. Terminals receive refined products by pipeline, ship, railway, or truck, and act as a distribution chain for – and temporary storage of – products prior to final distribution.
In southern Ontario, refined products are primarily moved by pipeline from refineries to terminals. Rail can also supplement deliveries into Eastern parts of the province. The Valero terminal in Maitland, Ontario, for example, is understood to be supplied by train from Valero’s refinery in Quebec City.
The Thunder Bay terminal is primarily supplied by rail from Western Canadian refiners. The Sault Ste. Marie terminal is supplied by rail from both Ontario and Quebec refiners. In addition to pipelines, Ontario distributors have access to Quebec and Atlantic refineries via the St. Lawrence Seaway and to US refiners via the Great Lakes, during the shipping season.
In 2015, there were 3,208 retail gas stations operating in Ontario.
1.3.2 Trends
In the past decade both Western Canadian crude oil production and U.S. oil production have increased considerably. This has led to displacement of imported crude oil with continental supply and a desire to expand pipeline infrastructure to economically deliver crude oil to markets (i.e., refiners and export terminals).
Ontario has been impacted by this trend. As outlined earlier, Ontario is now almost fully supplied by Western Canadian crude oil. This shift was facilitated by changing the operation of pipeline infrastructure.
Enbridge Line 9 was built in the 1970s to deliver crude oil from Sarnia to Montreal. In 1998, due to changing market conditions, the pipeline flow was reversed to deliver offshore crude oil into Sarnia. As market conditions changed again, Line 9 became significantly underutilized. In July 2012, the flow of the segment of Enbridge Line 9 between Sarnia and Westover terminal was re-reversed. This enabled the Imperial Oil refinery in Nanticoke, ON, to be fully supplied with continental crude oil (this refinery connects to Westover terminal by pipeline). Similarly, the segment of Enbridge Line 9 between Westover and Montreal was reversed in December 2015, which enables Quebec refineries to access continental crude oil supplies by pipeline. In December 2015, the capacity for the entire Line 9 from Sarnia was also expanded by 60,000 barrels per day to 300,000 barrels per day.
1.3.3 Capacity Sufficiency
Oil products such as gasoline have been an important aspect of the province’s energy mix for years. Consequently, the infrastructure for crude oil deliveries, refinery production, oil product imports and oil product distribution is well established.
Overall, the oil products supply chain has functioned well and demonstrated resiliency in meeting peak demand. Unanticipated disruptions in refinery production can result in higher prices and supply disruptions.
1.4 Wood and Biomass
Biomass and wood are renewable resources (e.g., forest or agricultural materials) that are used in a variety of fuel applications.
1.4.1 Supply Sources
In 2015, Ontario consumed approximately 91 PJ of wood and biomass energy supplied primarily by local sources for residential, commercial and industrial processes.
1.4.2 Delivery
Wood used as a fuel is typically consumed locally, with limited distribution by truck.
As illustrated in Figure 12, the biomass supply chain consists of harvesting, processing, baling, transportation, and conversion. Harvesting of biomass can be performed using manual or mechanized techniques, depending on size and cost. Processing biomass involves converting the harvested timber into smaller pieces. Wood chip and pellet baling compact the wood for ease of transport. Biomass relies on transportation and distribution by truck.
Figure 12: Biomass Delivery
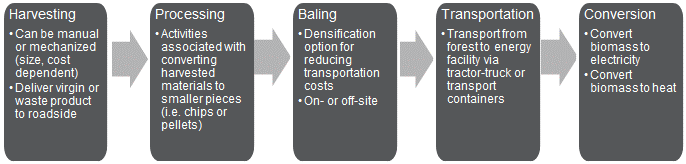
Wood and other biomass resources can be converted into pellets. Producing pellets involves the compression of biomass into a small, compact, consistently sized, dense and low-moisture content fuel that can be easily burned in pellet stoves, central heating furnaces and other heating appliances. Wood pellets are the most common type of pellet fuel and are generally made from compacted sawdust and related wastes from the milling of lumber, manufacture of wood products and furniture, and construction. Pellets - after packaging – can be distributed to end-users by truck, rail and marine.
1.4.3 Trends
Biomass is often used where wood pellet manufacturing exists. This allows for easy access to biomass fuel.
The largest biomass electricity generating plant in Canada is located in Northern Ontario. The Atikokan Generating Station is a 200 megawatt (MW) capacity generating facility that was converted from coal to biomass in 2014.
The Government of Ontario supports the use of underutilized forest resources to develop the bioeconomy - which includes using biomass to produce energy (i.e., heat, electricity and fuels). Biomass energy is prevalent in Northern Ontario, where there are several biomass projects in development and/or operation. For example, the Biomass North Development Centre has developed a Northern Ontario Bioeconomy Strategy (NO-BO) that aims to promote and develop a bioeconomy throughout Northern Ontario. The strategy was developed in partnership by the Union of Ontario Indians and the former Biomass Innovation Centre.
1.4.4 Capacity Sufficiency
Ontario has significant forestry resources and biomass more generally. Ontario’s forest management guides and standards are regularly updated – this ensures that new uses of Crown forest resources, like bioenergy, occur in a sustainable way.
1.5 Alternative Fuels
This section addresses four renewable fuels: ethanol, biodiesel, renewable diesel, and biogas / renewable natural gas. The renewable fuels industry has grown dramatically over the past few years due to government policies (e.g., blending requirements), as discussed in further detail below.
Due to differences between the renewable fuels, each of ethanol, biodiesel/renewable diesel and biogas / RNG are discussed in turn.
1.5.1 Ethanol
1.5.1.1 Supply Sources
Ontario consumption of ethanol has increased steadily since 2007, as illustrated in Figure 13 below.
Figure 13: Ontario Ethanol Consumption, 2007-2014
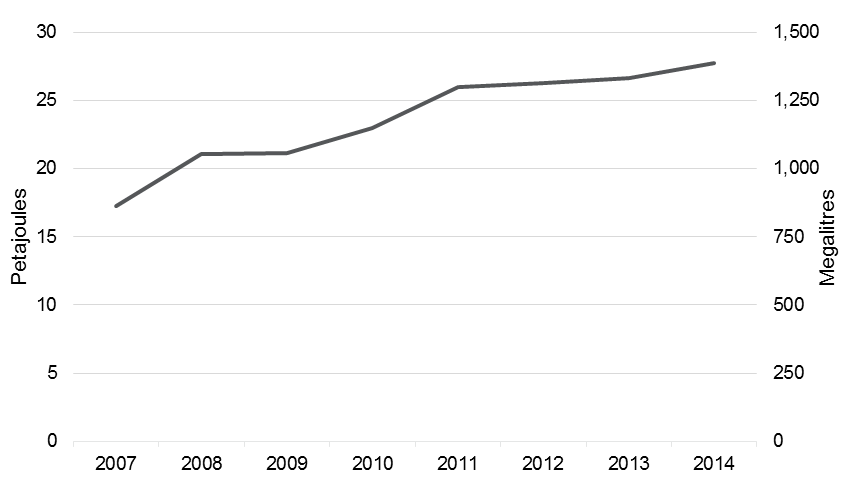
Source: Ministry of Environment and Climate Change, 2016.
| Year | Total Ethanol (Js) | Total Ethanol (ML) |
|---|---|---|
| 2007 | 17280842.76 | 816 |
| 2008 | 21050438.36 | 994 |
| 2009 | 21156325.88 | 999 |
| 2010 | 22956413.67 | 1084 |
| 2011 | 25942441.65 | 1225 |
| 2012 | 26260104.2 | 1240 |
| 2013 | 26598944.25 | 1256 |
| 2014 | 27700174.43 | 1308 |
This consumption was met with both Ontario production and imports.
Ethanol Production
Ontario currently has six operational ethanol refineries. These are illustrated below:
| Company/Plant Name | Location | Capacity (Million Litres/Year) | Feedstock |
|---|---|---|---|
| Greenfield Specialty Alcohols | Chatham | 130 | Corn |
| Suncor St. Clair Ethanol Plant | Sarnia | 400 | Corn |
| IGPC Ethanol Inc. | Aylmer | 162 | Corn |
| Greenfield Specialty Alcohols | Tiverton | 27 | Corn |
| Kawartha Ethanol | Havelock | 120 | Corn |
| Greenfield Specialty Alcohols | Johnstown | 250 | Corn |
| Total Capacity (Million Litres/Year) | 1,089 | ||
| Total Capacity (PJ/Year) | 22.8 |
1.5.1.2 Delivery
Feedstock
Corn is the main feedstock for ethanol production in Ontario. Ontario is a significant corn producing province.
Ontario corn production levels are shown below.
Figure 14: Corn Production in Ontario
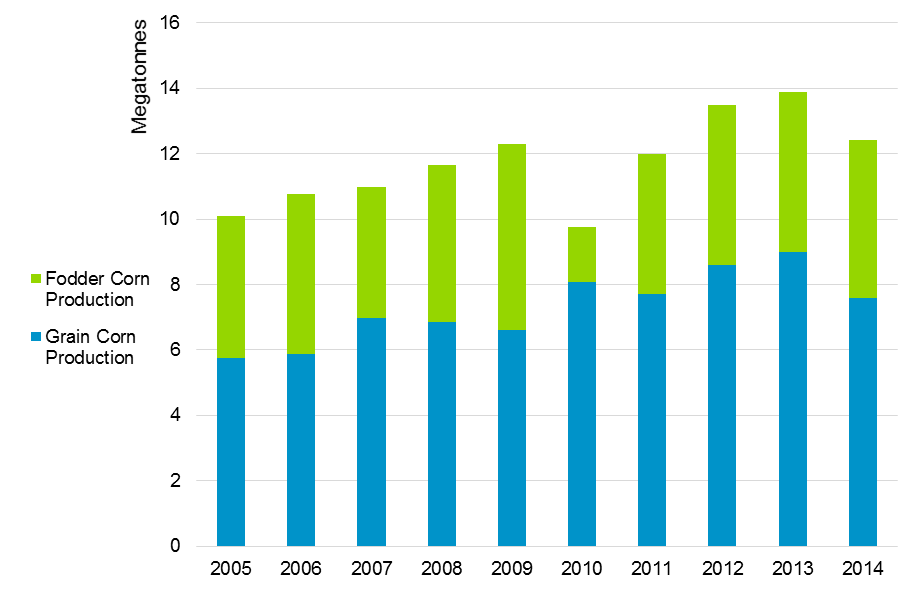
Source: Ontario Ministry of Agriculture, Food, and Rural Affairs
| Year | Fodder Corn Production (tonnes) | Grain Corn Production (tonnes) |
|---|---|---|
| 2005 | 4322700 | 5766100 |
| 2006 | 4898800 | 5867700 |
| 2007 | 3991600 | 6985400 |
| 2008 | 4808100 | 6858400 |
| 2009 | 5688000 | 6604300 |
| 2010 | 1690100 | 8077600 |
| 2011 | 4263800 | 7722000 |
| 2012 | 4898800 | 8598000 |
| 2013 | 4889700 | 9007300 |
| 2014 | 4830800 | 7600000 |
Distribution
Ethanol’s primary fuel use is an additive to gasoline. Consequently, ethanol currently relies significantly on the gasoline distribution infrastructure to reach end-users.
Ethanol and ethanol-blended gasoline are typically not transported by pipeline. This is due to issues with attraction of water. Ethanol is delivered to fuel distribution terminals by rail and truck where it is added to a gasoline-based blendstock to produce an on-specification finished fuel. A typical finished fuel with ethanol added contains 10% ethanol – this fuel is called E10.
In Ontario, most fuel distribution terminals in southern and eastern Ontario are have ethanol blending capability. However, some lower volume terminals in northern Ontario (e.g., Thunder Bay and Sault Ste-Marie) may not blend ethanol. These terminals continue to be supplied with unblended gasoline.
Retail gasoline stations require some modifications and infrastructure upgrades to sell E10 (as opposed to straight gasoline). Specifically, this includes cleaning of on-site storage tanks and ensuring dispensers are rated to handle E10.
E10 is sold as "regular gasoline". Substantially all of the vehicles on the road today can use E10. This has resulted in E10 being widely distributed in southern Ontario and in the U.S.
1.5.1.3 Trends
A key factor in the growth of ethanol is government policies, including mandates and production support.
Ontario is the largest bioethanol producing province in Canada, largely due to its policies around renewable fuels. Under (O. Reg. 535/05) in the Environmental Protection Act, 1990 (CEPA), gasoline suppliers must include a minimum of at least 5% (annual average) ethanol content in motor gasoline. These entities must submit a compliance report to the government each year and ensure that the ethanol based fuel meets specific standards set out in the regulations.
To assist the province in meeting its ethanol goals the Ontario Ethanol Growth Fund (OEGF) was established. The OEGF was launched in 2005 following the announcement of ethanol requirements under the Renewable Fuel Regulations, discussed above. The 12 year, $520 million fund is intended to assist ethanol producers to meet financial challenges, provide support for independent blenders of ethanol and gasoline, and fund research and development.
Additional policy support was provided by federal government initiatives. Starting in 2010, the Renewable Fuel Regulations sets national ethanol and biodiesel blend mandate targets. The main requirements for ethanol under the Renewable Fuel Regulations requires fuel producers and importers to have an average renewable content of at least 5% based on volume of gasoline produced or imported. Another federal initiative pertaining to biofuels is ecoENERGY for Biofuels which provides financial incentives for ethanol and biodiesel production in Canada.
Ontario’s Climate Change Action Plan proposes additional measures that would support ethanol use, including: measures to boost renewable content of gasoline and assistance to fuel distributors to offer high-level blends for renewable fuels.
1.5.1.4 Capacity Sufficiency
Ontario’s current ethanol requirements are being met by a combination of domestic production and imports.
Today, growing domestic ethanol production capacity is largely constrained, by feedstock availability and not processing capability. Ontario’s ethanol producers use primarily domestic corn for their operations
Research is ongoing to use a variety of alternative feedstocks - corn stover, wastes, etc through cellulosic production. Cellulosic ethanol production can be incented by policies (e.g., fuel standards that account for life cycle emissions). Biomass that could be used for cellulosic ethanol also faces competing uses.
Additional ethanol use in Ontario can also likely be acommodated by imports. Given robust North American transportation networks, rail and marine can be used to import ethanol from the U.S. Midwest and Brazil.
At the distribution level, ethanol growth is constrained by vehicle and refuelling infrastructure. For example, infrastructure upgrades (i.e., pumps and storage tanks) may be required at fueling stations to sell higher blends of ethanol (e.g., E15). While many newer vehicles can use E15, vehicle manufacturers do not typically recommend the use of E15 in vehicles built prior to 2010-2012.
Similarly, specialized equipment is needed to sell blends of E55 to E85 and only specially equipped vehicles (called "flex-fuel vehicles) can use this level of ethanol blend.
1.5.2 Biodiesel and Renewable Diesel
1.5.2.1 Supply Sources
Statistics on the use of biodiesel and renewable diesel in Ontario are not yet publicly available.
Ontario’s recently introduced blending requirements under the Greener Diesel regulation are understood to be met by a combination of domestically produced biodiesel and imported renewable diesel.
1.5.2.2 Delivery
Feedstock
Biodiesel and renewable diesel are derived from organic materials such as plant oils, waste cooking oils, animal fats, and other oils (such as fish). The distinction between diesel fuels classified as biodiesel versus renewable diesel depends on the process used to create them.
Biodiesel and Renewable Diesel Production
There are currently five biodiesel refineries in Ontario. The locations and production capacities of these are summarized in Table 2 below. The total operational production capacity of all five refineries is equivalent to approximately 10.2 PJ per year. No renewable diesel production facilities exist in Canada.
| Company/Plant Name | Location | Capacity (Million Litres/Year) | Feedstock |
|---|---|---|---|
| Methes Energies Canada, Inc. | Sombra | 50 | Multi-feedstock |
| Noroxel Energy Ltd. | Springfield | 5 | Yellow grease |
| Atlantic Biodiesel | Welland | 170 | Multi-feedstock |
| Biox Corporation | Hamilton | 66 | Multi-feedstock |
| Methes Energies Canada, Inc. | Mississauga | 5 | Yellow grease |
| Total Capacity (Million Litres/Year) | 296 | ||
| Total Capacity (PJ/Year) | 10.2 |
Source: Renewable Industries Canada, 2016
1.5.2.3 Distribution
Biodiesel and renewable diesel are used as additives to diesel fuel.
Biodiesel is delivered to fuel distribution terminals by rail and truck where it is added to diesel fuel. Like ethanol, biodiesel and biodiesel blends are not transported by pipeline.
A typical finished fuel with biodiesel contains 5% biodiesel - this fuel is called B5. Blends of up to B5 are typically interchangeable with conventional diesel fuel. However, biodiesel characteristics limit its use in cold weather; which limits the use of biodiesel blends in winter.
Some vehicle manufacturers authorize the use of biodiesel blends of up to B20 in their vehicles.
Renewable diesel poses fewer challenges for fuel suppliers. For instance, since renewable diesel is chemically similar to conventional diesel it can be transported into Ontario via pipeline. (This reduces the requirements for truck distribution and blending infrastructure). Renewable diesel imports are understood to access Ontario via the Trans-Northern Pipeline originating in Montreal.
1.5.2.4 Trends
As with ethanol, biodiesel and renewable diesel use has been boosted by government policy.
Under Ontario Greener Diesel Requirements in (O. Reg. 97/14), fuel suppliers that import, manufacture, or acquire diesel fuel must ensure, by 2017, that the amount of bio-based diesel in the diesel fuel is 4% of total volume. In addition, and also by 2017, the bio-based diesel component of the blend must have 70% lower GHG emissions than standard petroleum diesel. The Greener Diesel regulation was introduced in 2014 with a 2% blending requirement.
At the federal level, the Renewable Fuel Regulations sets national ethanol and biodiesel blend mandate targets. The main bio-based diesel requirements under the Renewable Fuel Regulations requires fuel producers and importers to have an average renewable content of at least 2% based on the volume of diesel fuel produced or imported.
Another federal initiative pertaining to biofuels is ecoenergy for Biofuels which provides financial incentives for ethanol and biodiesel production in Canada. This initiative provides operating incentives for producers. The program is scheduled to end on March 31st, 2017.
1.5.2.5 Capacity Sufficiency
Ontario’s current biodiesel requirements are being met by a combination of domestic production and imports.
Growing domestic biodiesel or renewable diesel production capacity is contrained, to a degree, by feedstock availability.
Biofuel feedstock can include cooking grease, soybean oil, waste vegetable (i.e. canola) oil, hemp oil, etc. While feedstock varies, prices and availability generally drive choice of feedstock for producers.
Additional biodiesel or renewable diesel use in Ontario can likely be acommodated by imports. Given robust North American transportation networks, rail and marine can be used to import biodiesel and renewable diesel from the U.S. and renewable diesel from Europe and Asia.
At the distribution level, biodiesel growth is constrained by inadequate distribution infrastructure. To distributebiodiesel at terminals, investments in storage, loading infrastructure, blending equipment and heating (i.e., to ensure biodiesel blends in colder months) is needed. More distribution terminals in Ontario will need to invest in biodiesel blending if use is to increase materially.
Ontario production of renewable diesel would require a large-scale investment.
1.5.3 Biogas/Renewable Natural Gas and Biomass
1.5.3.1 Supply Sources
In 2013, there were 37 operating biogas facilities in Ontario, with a combined capacity of 27,223 kW.
1.5.3.2 Delivery
Renewable natural gas (RNG) is produced from biogas, which is a product of the decomposition of organic matter. In some applications biogas can be used directly as a fuel. For use as RNG the biogas is processed to meet natural gas purity standards, and the resulting RNG is fully interchangeable with conventional natural gas. Biogas can be derived from landfills, livestock operations, wastewater treatment, or waste from industrial, institutional, and commercial entities.
1.5.3.3 Trends
Ontario’s Climate Change Action Plan proposes to establish a low carbon content requirement for natural gas. The Climate Change Action Plan also proposes to fund a pilot program that uses RNG in commercial-scale demonstration projects for transportation.
RNG is also being used in California as a transportation fuel under California’s Low Carbon Fuel Standard.
1.5.3.4 Capacity Sufficiency
According to the Canadian Gas Association, Alberta Research Council (2008) suggests that Canada has the potential to produce 1,300 billion cubic feet per year of RNG.
A recent study commissioned by the Ontario gas utilities have forecast Ontario RNG production of 4.3 billion m3 of RNG per year by 2030, approximately 160 PJ, or equivalent to a little less than half of the natural gas used by the residential sector in Ontario in 2013.
A key consideration in RNG capacity is the availability of biomass resources, which has competing uses.
Footnotes
- footnote[1] Back to paragraph Canadian Energy Pipeline Association, the Natural Gas Delivery Network. Accessed June, 2016.
- footnote[2] Back to paragraph Source: Canadian Energy Pipeline Association (CEPA), 2016. Liquids Pipelines Maps. Accessed June, 2016.
- footnote[3] Back to paragraph Ministry of Energy Mandate Letter, September 2014. /page/2014-mandate-letter-energy.
- footnote[4] Back to paragraph Enbridge Gas Distribution, Gas Storage and Enbridge Gas Distribution, accessed September 2016 https://www.enbridgegas.com/about/gas-storage/.
- footnote[5] Back to paragraph Spectra Energy, Dawn Hub – Union Gas, a business unit of Spectra Energy, offers a growing storage and transportation business to and from the Dawn Hub, accessed September 2016 http://www.spectraenergy.com/Operations/Canadian-Natural-Gas-Operations/Storage/Dawn-Hub/.
- footnote[6] Back to paragraph Gas Processing Management Inc. Prepared for the Canadian Propane Association, Canadian Propane Market Review, October 2014.
- footnote[7] Back to paragraph National Energy Board and Competition Bureau, Propane Market Review – Final Report, April 2014. http://www.nrcan.gc.ca/energy/crude-petroleum/15927 - Figure 3.2.
- footnote[8] Back to paragraph National Energy Board, Propane Market Review: 2016 Update – Energy Briefing Note, May 2016. https://www.neb-one.gc.ca/nrg/sttstc/ntrlgslqds/rprt/2016/2016prpn-eng.html#s10.
- footnote[9] Back to paragraph National Energy Board and Competition Bureau, Propane Market Review – Final Report, April 2014. http://www.nrcan.gc.ca/energy/crude-petroleum/15927 - Figure 3.2.
- footnote[10] Back to paragraph National Energy Board and Competition Bureau, Propane Market Review – Final Report, April 2014, http://www.nrcan.gc.ca/energy/crude-petroleum/15927, Conclusions, Section 8.7.
- footnote[11] Back to paragraph Canadian Association of Petroleum Producers, Technical Report: Statistical Handbook for Canada’s Upstream Petroleum Industry, May 2016. http://www.capp.ca/publications-and-statistics/publications/275430.
- footnote[12] Back to paragraph Statistics Canada, Table 134-0001: Refinery Supply of Crude Oil and Equivalent, Annual. http://www5.statcan.gc.ca/cansim/a26?lang=eng&id=1340001.
- footnote[13] Back to paragraph Series unavailable for 2015.
- footnote[14] Back to paragraph Statistics Canada, CANSIM Table 128-0017. Retrieved 2016. http://www5.statcan.gc.ca/cansim/a26?lang=eng&retrLang=eng&id=1280017&tabMode=dataTable&srchLan=-1&p1=-1&p2=9.
- footnote[15] Back to paragraph Data presented in this table is the average monthly series available from Statistics Canada, converted to an annual value. Several months within this series are suppressed in order to meet the confidentiality requirements of the Statistics Act. For this reason, numbers here should be taken with caution and instead be used a representation of general trends in the supply of these fuels.
- footnote[16] Back to paragraph Statistics Canada, CANSIM Table 134-0004. Retrieved June, 2016. http://www5.statcan.gc.ca/cansim/a26?lang=eng&retrLang=eng&id=1340004&tabMode=dataTable&srchLan=-1&p1=-1&p2=9.
- footnote[17] Back to paragraph Canadian Energy Pipeline Association, the Crude Oil Delivery Network. Accessed June, 2016.
- footnote[18] Back to paragraph Canadian Energy Pipeline Association (CEPA), Liquids Pipelines Maps. Accessed June, 2016.
- footnote[19] Back to paragraph Enbridge Line 7 also connects to Sarnia and Westover terminal.
- footnote[20] Back to paragraph Kent Marketing Group, National Retail Petroleum Site Census, 2015.
- footnote[21] Back to paragraph Ontario Ministry of Agriculture, Food, and Rural Affairs, Historical Provincial Estimates by Crop. Retrieved July, 2016. http://www.omafra.gov.on.ca/english/stats/crops/index.html.
- footnote[22] Back to paragraph Ministry of Energy, Ontario, 2016.
- footnote[23] Back to paragraph NB: although referred to as “renewable diesel” refineries in the source document, all of these refineries are in fact biodiesel, not renewable diesel (as defined above), refineries.
- footnote[24] Back to paragraph Renewable Industries Canada, Industry Map. Accessed June, 2016. http://ricanada.org/industry/industry-map/.
- footnote[25] Back to paragraph Renewable Energies, 2014 CanBio Report on the Status of Bioenergy in Canada. December, 2014 (page 26). http://www.fpac.ca/wp-content/uploads/2014_CanBio_Report.pdf.
- footnote[26] Back to paragraph Canadian Gas Association, Renewable Natural Gas. Issue 5 2013. Retrieved July, 2016. http://www.cga.ca/wp-content/uploads/2015/04/CGA_bulletin_RenewableNaturalGas_-EN.pdf.