Overview
The following module summarizes the components of fuels energy system costs for Ontario consumers under the conditions of each of the demand outlooks. Note: Further information with respect to the demand outlooks can be found in Module 2 “Demand Outlook”.
For each Of the demand outlooks, the total cost of energy-related fuel use (excluding costs for electricity generation) and the average unit cost are summarized. Note: The cost of non-energy fuel use by the industrial system is not included.
The cost outlooks illustrated here are not forecasts, and do not address the future volatility of energy prices. They illustrate a range of possible outcomes based on the assumptions made within each outlook.
The cost outlooks have been developed by applying each demand outlook to a set of projected fuels prices. Fuel price projections were obtained, or adapted, from fuels price projections developed by other (principally public) agencies and represent “delivered” prices (i.e., the actual cost paid by the consumer).
This module provides additional detail that underlies the total system and average unit costs presented in the Fuels Technical Report and also outlines the underlying price assumptions and inputs that determine the system cost outlooks.
All currency values provided in this module are expressed as 2016 real Canadian dollars.
Fuels system cost outlook
Total system Costs
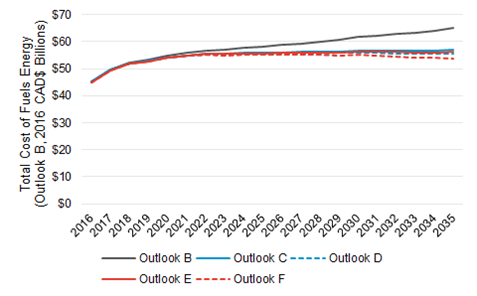
Total system Costs (2016 CAD$ Billions)
| Year |
Outlook B |
Outlook C |
Outlook D |
Outlook E |
Outlook F |
| 2016 |
$45 |
$45 |
$45 |
$45 |
$45 |
| 2017 |
$50 |
$50 |
$50 |
$50 |
$50 |
| 2018 |
$52 |
$52 |
$52 |
$52 |
$52 |
| 2019 |
$53 |
$53 |
$53 |
$53 |
$53 |
| 2020 |
$55 |
$54 |
$54 |
$54 |
$54 |
| 2021 |
$56 |
$55 |
$55 |
$55 |
$55 |
| 2022 |
$57 |
$56 |
$55 |
$56 |
$55 |
| 2023 |
$57 |
$56 |
$55 |
$56 |
$55 |
| 2024 |
$58 |
$56 |
$55 |
$56 |
$56 |
| 2025 |
$58 |
$56 |
$55 |
$56 |
$56 |
| 2026 |
$59 |
$56 |
$56 |
$56 |
$56 |
| 2027 |
$59 |
$56 |
$56 |
$56 |
$56 |
| 2028 |
$60 |
$56 |
$56 |
$56 |
$56 |
| 2029 |
$61 |
$56 |
$56 |
$56 |
$56 |
| 2030 |
$62 |
$57 |
$56 |
$57 |
$56 |
| 2031 |
$62 |
$57 |
$56 |
$57 |
$55 |
| 2032 |
$63 |
$57 |
$56 |
$56 |
$55 |
| 2033 |
$63 |
$57 |
$55 |
$56 |
$55 |
| 2034 |
$64 |
$57 |
$55 |
$56 |
$55 |
| 2035 |
$65 |
$57 |
$56 |
$57 |
$55 |
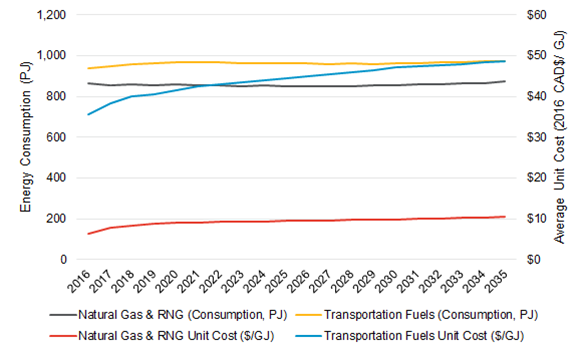
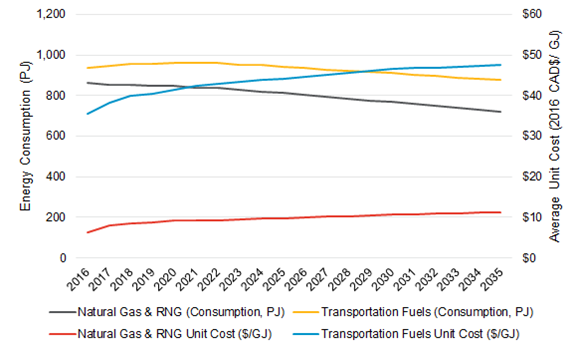
Average Unit Costs – Outlook B
| Fuel and Cost |
2016 |
2017 |
2018 |
2019 |
2020 |
2021 |
2022 |
2023 |
2024 |
2025 |
| Natural Gas & RNG (Consumption, PJ) |
862 |
854 |
857 |
856 |
858 |
855 |
856 |
851 |
853 |
852 |
| Transportation Fuels (Consumption, PJ) |
938 |
945 |
956 |
960 |
966 |
965 |
967 |
964 |
964 |
961 |
| Natural Gas & RNG Unit Cost ($/GJ) |
$6 |
$8 |
$8 |
$9 |
$9 |
$9 |
$9 |
$9 |
$9 |
$9 |
| Transportation Fuels Unit Cost ($/GJ) |
$36 |
$38 |
$40 |
$41 |
$41 |
$42 |
$43 |
$43 |
$44 |
$44 |
| Fuel and Cost |
2026 |
2027 |
2028 |
2029 |
2030 |
2031 |
2032 |
2033 |
2034 |
2035 |
| Natural Gas & RNG (Consumption, PJ) |
852 |
850 |
852 |
853 |
857 |
857 |
861 |
863 |
866 |
873 |
| Transportation Fuels (Consumption, PJ) |
962 |
959 |
961 |
960 |
963 |
963 |
966 |
967 |
971 |
975 |
| Natural Gas & RNG Unit Cost ($/GJ) |
$10 |
$10 |
$10 |
$10 |
$10 |
$10 |
$10 |
$10 |
$10 |
$10 |
| Transportation Fuels Unit Cost ($/GJ) |
$45 |
$45 |
$46 |
$46 |
$47 |
$47 |
$48 |
$48 |
$48 |
$49 |
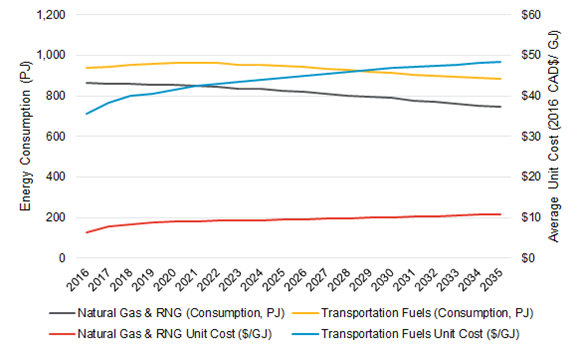
Average Unit Costs – Outlook C
| Fuel and Cost |
2016 |
2017 |
2018 |
2019 |
2020 |
2021 |
2022 |
2023 |
2024 |
2025 |
| Natural Gas & RNG (Consumption, PJ) |
863 |
857 |
858 |
856 |
854 |
848 |
847 |
837 |
832 |
827 |
| Transportation Fuels (Consumption, PJ) |
937 |
945 |
955 |
959 |
964 |
961 |
961 |
955 |
952 |
945 |
| Natural Gas & RNG Unit Cost ($/GJ) |
$6 |
$8 |
$8 |
$9 |
$9 |
$9 |
$9 |
$9 |
$9 |
$10 |
| Transportation Fuels Unit Cost ($/GJ) |
$36 |
$38 |
$40 |
$41 |
$41 |
$42 |
$43 |
$43 |
$44 |
$44 |
| Fuel and Cost |
2026 |
2027 |
2028 |
2029 |
2030 |
2031 |
2032 |
2033 |
2034 |
2035 |
| Natural Gas & RNG (Consumption, PJ) |
819 |
811 |
802 |
794 |
788 |
778 |
771 |
759 |
751 |
744 |
| Transportation Fuels (Consumption, PJ) |
940 |
932 |
927 |
918 |
913 |
905 |
900 |
892 |
887 |
883 |
| Natural Gas & RNG Unit Cost ($/GJ) |
$10 |
$10 |
$10 |
$10 |
$10 |
$10 |
$10 |
$11 |
$11 |
$11 |
| Transportation Fuels Unit Cost ($/GJ) |
$45 |
$45 |
$46 |
$46 |
$47 |
$47 |
$47 |
$48 |
$48 |
$48 |
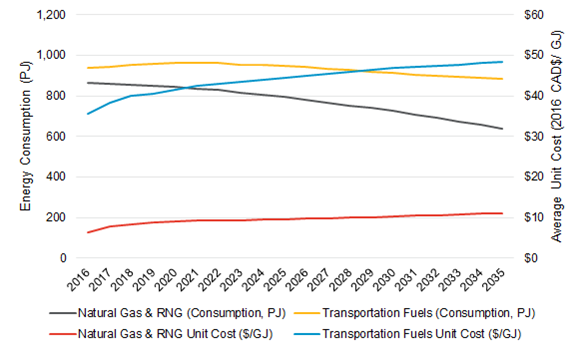
Average Unit Costs – Outlook D
| Fuel and Cost |
2016 |
2017 |
2018 |
2019 |
2020 |
2021 |
2022 |
2023 |
2024 |
2025 |
| Natural Gas & RNG (Consumption, PJ) |
863 |
857 |
855 |
850 |
844 |
834 |
829 |
814 |
805 |
795 |
| Transportation Fuels (Consumption, PJ) |
937 |
945 |
955 |
959 |
964 |
961 |
961 |
955 |
952 |
945 |
| Natural Gas & RNG Unit Cost ($/GJ) |
$6 |
$8 |
$8 |
$9 |
$9 |
$9 |
$9 |
$9 |
$10 |
$10 |
| Transportation Fuels Unit Cost ($/GJ) |
$36 |
$38 |
$40 |
$41 |
$41 |
$42 |
$43 |
$43 |
$44 |
$44 |
| Fuel and Cost |
2026 |
2027 |
2028 |
2029 |
2030 |
2031 |
2032 |
2033 |
2034 |
2035 |
| Natural Gas & RNG (Consumption, PJ) |
781 |
766 |
753 |
740 |
725 |
708 |
692 |
674 |
656 |
639 |
| Transportation Fuels (Consumption, PJ) |
940 |
932 |
927 |
918 |
913 |
905 |
900 |
892 |
887 |
883 |
| Natural Gas & RNG Unit Cost ($/GJ) |
$10 |
$10 |
$10 |
$10 |
$10 |
$10 |
$11 |
$11 |
$11 |
$11 |
| Transportation Fuels Unit Cost ($/GJ) |
$45 |
$45 |
$46 |
$46 |
$47 |
$47 |
$47 |
$48 |
$48 |
$48 |
Average Unit Costs – Outlook E
| Fuel and Cost |
2016 |
2017 |
2018 |
2019 |
2020 |
2021 |
2022 |
2023 |
2024 |
2025 |
| Natural Gas & RNG (Consumption, PJ) |
861 |
854 |
854 |
850 |
847 |
840 |
837 |
826 |
821 |
814 |
| Transportation Fuels (Consumption, PJ) |
937 |
944 |
954 |
957 |
962 |
959 |
959 |
952 |
949 |
942 |
| Natural Gas & RNG Unit Cost ($/GJ) |
$6 |
$8 |
$8 |
$9 |
$9 |
$9 |
$9 |
$9 |
$10 |
$10 |
| Transportation Fuels Unit Cost ($/GJ) |
$36 |
$38 |
$40 |
$41 |
$42 |
$42 |
$43 |
$43 |
$44 |
$44 |
| Fuel and Cost |
2026 |
2027 |
2028 |
2029 |
2030 |
2031 |
2032 |
2033 |
2034 |
2035 |
| Natural Gas & RNG (Consumption, PJ) |
805 |
796 |
786 |
776 |
770 |
759 |
750 |
738 |
729 |
721 |
| Transportation Fuels (Consumption, PJ) |
937 |
928 |
923 |
915 |
909 |
901 |
896 |
888 |
882 |
878 |
| Natural Gas & RNG Unit Cost ($/GJ) |
$10 |
$10 |
$10 |
$10 |
$11 |
$11 |
$11 |
$11 |
$11 |
$11 |
| Transportation Fuels Unit Cost ($/GJ) |
$45 |
$45 |
$46 |
$46 |
$46 |
$47 |
$47 |
$47 |
$47 |
$48 |
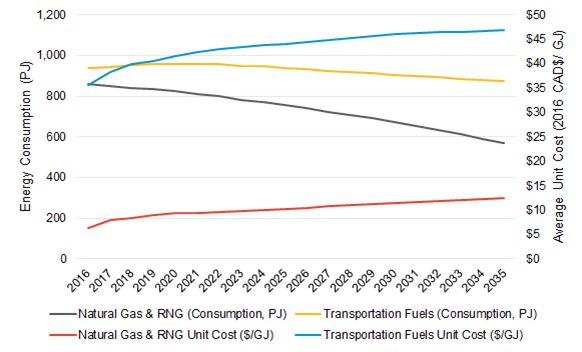
Average Unit Costs – Outlook F
| Fuel and Cost |
2016 |
2017 |
2018 |
2019 |
2020 |
2021 |
2022 |
2023 |
2024 |
2025 |
| Natural Gas & RNG (Consumption, PJ) |
857 |
848 |
842 |
832 |
823 |
810 |
800 |
783 |
770 |
757 |
| Transportation Fuels (Consumption, PJ) |
936 |
943 |
952 |
955 |
960 |
957 |
956 |
950 |
947 |
939 |
| Natural Gas & RNG Unit Cost ($/GJ) |
$6 |
$8 |
$8 |
$9 |
$9 |
$9 |
$10 |
$10 |
$10 |
$10 |
| Transportation Fuels Unit Cost ($/GJ) |
$36 |
$38 |
$40 |
$41 |
$42 |
$43 |
$43 |
$44 |
$44 |
$45 |
| Fuel and Cost |
2026 |
2027 |
2028 |
2029 |
2030 |
2031 |
2032 |
2033 |
2034 |
2035 |
| Natural Gas & RNG (Consumption, PJ) |
740 |
722 |
706 |
690 |
671 |
652 |
633 |
612 |
590 |
570 |
| Transportation Fuels (Consumption, PJ) |
934 |
925 |
920 |
911 |
906 |
898 |
892 |
884 |
878 |
874 |
| Natural Gas & RNG Unit Cost ($/GJ) |
$11 |
$11 |
$11 |
$11 |
$12 |
$12 |
$12 |
$12 |
$12 |
$13 |
| Transportation Fuels Unit Cost ($/GJ) |
$45 |
$45 |
$46 |
$46 |
$47 |
$47 |
$47 |
$47 |
$47 |
$48 |
Total system Costs by Fuel – Outlook B
Total system Costs - Outlook B (Billion 2016 $CAD) - 2016-2025
| Fuel and Cost |
2016 |
2017 |
2018 |
2019 |
2020 |
2021 |
2022 |
2023 |
2024 |
2025 |
| Diesel |
$11.40 |
$12.00 |
$12.60 |
$12.90 |
$13.30 |
$13.70 |
$14.00 |
$14.30 |
$14.70 |
$15.00 |
| Hydrogen |
$0.00 |
$0.00 |
$0.00 |
$0.00 |
$0.00 |
$0.00 |
$0.00 |
$0.00 |
$0.00 |
$0.00 |
| Motor Gasoline |
$20.00 |
$20.60 |
$21.10 |
$21.20 |
$21.60 |
$21.70 |
$21.80 |
$21.60 |
$21.50 |
$21.30 |
| Natural Gas |
$5.40 |
$6.00 |
$6.40 |
$6.80 |
$7.00 |
$7.00 |
$7.00 |
$7.00 |
$7.00 |
$7.10 |
| Other Heating Fuels |
$1.30 |
$1.30 |
$1.30 |
$1.30 |
$1.30 |
$1.30 |
$1.30 |
$1.30 |
$1.30 |
$1.40 |
| Other Industrial Fuels |
$2.30 |
$2.30 |
$2.20 |
$2.30 |
$2.30 |
$2.30 |
$2.40 |
$2.30 |
$2.30 |
$2.30 |
| Other Transportation Fuels |
$2.60 |
$3.10 |
$3.50 |
$3.90 |
$4.10 |
$4.40 |
$4.70 |
$4.80 |
$5.10 |
$5.30 |
| Propane and NGL |
$0.80 |
$0.90 |
$1.00 |
$1.10 |
$1.10 |
$1.20 |
$1.20 |
$1.20 |
$1.20 |
$1.20 |
| Renewable Natural Gas |
$0.00 |
$0.00 |
$0.00 |
$0.00 |
$0.00 |
$0.00 |
$0.00 |
$0.00 |
$0.00 |
$0.00 |
| Transportation Biofuels |
$1.40 |
$1.50 |
$1.90 |
$1.90 |
$2.00 |
$2.00 |
$1.90 |
$1.90 |
$1.80 |
$1.80 |
| Carbon Costs |
$0.00 |
$2.10 |
$2.10 |
$2.10 |
$2.30 |
$2.40 |
$2.50 |
$2.60 |
$2.70 |
$2.80 |
| Total Cost |
$45.20 |
$49.80 |
$52.20 |
$53.40 |
$55.00 |
$56.00 |
$56.80 |
$57.10 |
$57.70 |
$58.10 |
Total system Costs - Outlook B (Billion 2016 $CAD) - 2026-2035
| Fuel and Cost |
2026 |
2027 |
2028 |
2029 |
2030 |
2031 |
2032 |
2033 |
2034 |
2035 |
| Diesel |
$15.40 |
$15.80 |
$16.10 |
$16.50 |
$16.90 |
$17.20 |
$17.30 |
$17.50 |
$17.70 |
$18.00 |
| Hydrogen |
$0.00 |
$0.00 |
$0.00 |
$0.00 |
$0.00 |
$0.00 |
$0.00 |
$0.00 |
$0.00 |
$0.00 |
| Motor Gasoline |
$21.20 |
$21.00 |
$20.90 |
$20.80 |
$20.80 |
$20.60 |
$20.50 |
$20.40 |
$20.40 |
$20.40 |
| Natural Gas |
$7.10 |
$7.10 |
$7.10 |
$7.20 |
$7.20 |
$7.30 |
$7.30 |
$7.40 |
$7.40 |
$7.50 |
| Other Heating Fuels |
$1.40 |
$1.40 |
$1.40 |
$1.50 |
$1.50 |
$1.50 |
$1.50 |
$1.50 |
$1.50 |
$1.50 |
| Other Industrial Fuels |
$2.30 |
$2.30 |
$2.30 |
$2.30 |
$2.30 |
$2.30 |
$2.30 |
$2.30 |
$2.40 |
$2.40 |
| Other Transportation Fuels |
$5.50 |
$5.70 |
$5.90 |
$6.10 |
$6.40 |
$6.60 |
$6.80 |
$7.00 |
$7.20 |
$7.40 |
| Propane and NGL |
$1.20 |
$1.30 |
$1.30 |
$1.30 |
$1.30 |
$1.40 |
$1.40 |
$1.40 |
$1.50 |
$1.50 |
| Renewable Natural Gas |
$0.00 |
$0.00 |
$0.00 |
$0.00 |
$0.00 |
$0.00 |
$0.00 |
$0.00 |
$0.00 |
$0.00 |
| Transportation Biofuels |
$1.80 |
$1.70 |
$1.70 |
$1.70 |
$1.70 |
$1.60 |
$1.60 |
$1.60 |
$1.60 |
$1.60 |
| Carbon Costs |
$3.00 |
$3.10 |
$3.20 |
$3.40 |
$3.60 |
$3.70 |
$3.90 |
$4.10 |
$4.30 |
$4.60 |
| Total Cost |
$58.80 |
$59.30 |
$60.00 |
$60.70 |
$61.70 |
$62.20 |
$62.80 |
$63.30 |
$64.10 |
$65.00 |
Total system Costs by Fuel – Outlook C
Total system Costs - Outlook C (Billion 2016 $CAD) - 2016-2025
| Fuel and Cost |
2016 |
2017 |
2018 |
2019 |
2020 |
2021 |
2022 |
2023 |
2024 |
2025 |
| Diesel |
$11.40 |
$12.00 |
$12.60 |
$12.90 |
$13.30 |
$13.70 |
$14.00 |
$14.30 |
$14.60 |
$15.00 |
| Hydrogen |
$0.00 |
$0.00 |
$0.00 |
$0.00 |
$0.00 |
$0.00 |
$0.00 |
$0.00 |
$0.00 |
$0.00 |
| Motor Gasoline |
$20.00 |
$20.50 |
$21.10 |
$21.10 |
$21.50 |
$21.50 |
$21.50 |
$21.20 |
$21.00 |
$20.60 |
| Natural Gas |
$5.40 |
$6.00 |
$6.40 |
$6.80 |
$7.00 |
$7.00 |
$7.00 |
$6.90 |
$6.90 |
$6.90 |
| Other Heating Fuels |
$1.30 |
$1.20 |
$1.20 |
$1.10 |
$1.00 |
$1.00 |
$0.90 |
$0.90 |
$0.80 |
$0.80 |
| Other Industrial Fuels |
$2.30 |
$2.30 |
$2.20 |
$2.30 |
$2.30 |
$2.30 |
$2.30 |
$2.30 |
$2.20 |
$2.20 |
| Other Transportation Fuels |
$2.60 |
$3.10 |
$3.50 |
$3.90 |
$4.10 |
$4.40 |
$4.70 |
$4.80 |
$5.10 |
$5.30 |
| Propane and NGL |
$0.80 |
$0.80 |
$0.80 |
$0.80 |
$0.80 |
$0.80 |
$0.80 |
$0.70 |
$0.70 |
$0.60 |
| Renewable Natural Gas |
$0.00 |
$0.00 |
$0.00 |
$0.00 |
$0.00 |
$0.00 |
$0.00 |
$0.00 |
$0.00 |
$0.00 |
| Transportation Biofuels |
$1.40 |
$1.50 |
$1.90 |
$1.90 |
$2.00 |
$2.00 |
$1.90 |
$1.90 |
$1.80 |
$1.80 |
| Carbon Costs |
$0.00 |
$2.00 |
$2.10 |
$2.10 |
$2.20 |
$2.30 |
$2.40 |
$2.50 |
$2.60 |
$2.70 |
| Total Cost |
$45.10 |
$49.60 |
$51.80 |
$52.90 |
$54.20 |
$55.00 |
$55.50 |
$55.50 |
$55.80 |
$55.80 |
Total system Costs - Outlook C (Billion 2016 $CAD) - 2026-2035
| Fuel and Cost |
2026 |
2027 |
2028 |
2029 |
2030 |
2031 |
2032 |
2033 |
2034 |
2035 |
| Diesel |
$15.30 |
$15.70 |
$16.00 |
$16.40 |
$16.80 |
$17.10 |
$17.20 |
$17.30 |
$17.50 |
$17.70 |
| Hydrogen |
$0.00 |
$0.00 |
$0.00 |
$0.00 |
$0.00 |
$0.00 |
$0.00 |
$0.00 |
$0.00 |
$0.00 |
| Motor Gasoline |
$20.30 |
$19.80 |
$19.50 |
$19.00 |
$18.60 |
$18.00 |
$17.50 |
$17.00 |
$16.60 |
$16.30 |
| Natural Gas |
$6.90 |
$6.90 |
$6.80 |
$6.80 |
$6.80 |
$6.80 |
$6.80 |
$6.70 |
$6.70 |
$6.70 |
| Other Heating Fuels |
$0.80 |
$0.70 |
$0.70 |
$0.70 |
$0.70 |
$0.70 |
$0.70 |
$0.70 |
$0.70 |
$0.70 |
| Other Industrial Fuels |
$2.20 |
$2.20 |
$2.20 |
$2.20 |
$2.20 |
$2.20 |
$2.20 |
$2.20 |
$2.20 |
$2.20 |
| Other Transportation Fuels |
$5.50 |
$5.70 |
$5.90 |
$6.10 |
$6.40 |
$6.60 |
$6.80 |
$7.00 |
$7.20 |
$7.40 |
| Propane and NGL |
$0.60 |
$0.60 |
$0.60 |
$0.60 |
$0.60 |
$0.60 |
$0.60 |
$0.60 |
$0.60 |
$0.60 |
| Renewable Natural Gas |
$0.00 |
$0.00 |
$0.00 |
$0.00 |
$0.00 |
$0.00 |
$0.00 |
$0.00 |
$0.00 |
$0.00 |
| Transportation Biofuels |
$1.70 |
$1.70 |
$1.60 |
$1.60 |
$1.60 |
$1.50 |
$1.50 |
$1.40 |
$1.40 |
$1.40 |
| Carbon Costs |
$2.80 |
$2.90 |
$3.00 |
$3.10 |
$3.20 |
$3.40 |
$3.50 |
$3.60 |
$3.80 |
$3.90 |
| Total Cost |
$56.10 |
$56.10 |
$56.30 |
$56.40 |
$56.80 |
$56.70 |
$56.70 |
$56.60 |
$56.70 |
$57.00 |
Total system Costs by Fuel – Outlook D
Total system Costs - Outlook D (Billion 2016 $CAD) - 2016-2025
| Fuel and Cost |
2016 |
2017 |
2018 |
2019 |
2020 |
2021 |
2022 |
2023 |
2024 |
2025 |
| Diesel |
$11.40 |
$12.00 |
$12.60 |
$12.90 |
$13.30 |
$13.70 |
$14.00 |
$14.30 |
$14.60 |
$14.90 |
| Hydrogen |
$0.00 |
$0.00 |
$0.00 |
$0.00 |
$0.00 |
$0.00 |
$0.00 |
$0.00 |
$0.00 |
$0.00 |
| Motor Gasoline |
$20.00 |
$20.50 |
$21.10 |
$21.10 |
$21.50 |
$21.50 |
$21.50 |
$21.20 |
$21.00 |
$20.60 |
| Natural Gas |
$5.40 |
$6.00 |
$6.40 |
$6.70 |
$6.90 |
$6.90 |
$6.90 |
$6.80 |
$6.80 |
$6.70 |
| Other Heating Fuels |
$1.30 |
$1.20 |
$1.20 |
$1.10 |
$1.00 |
$1.00 |
$0.90 |
$0.90 |
$0.80 |
$0.80 |
| Other Industrial Fuels |
$2.30 |
$2.30 |
$2.20 |
$2.20 |
$2.20 |
$2.30 |
$2.30 |
$2.20 |
$2.20 |
$2.10 |
| Other Transportation Fuels |
$2.60 |
$3.10 |
$3.50 |
$3.90 |
$4.10 |
$4.40 |
$4.70 |
$4.80 |
$5.10 |
$5.30 |
| Propane and NGL |
$0.80 |
$0.80 |
$0.80 |
$0.80 |
$0.80 |
$0.80 |
$0.80 |
$0.70 |
$0.60 |
$0.60 |
| Renewable Natural Gas |
$0.00 |
$0.00 |
$0.00 |
$0.00 |
$0.00 |
$0.00 |
$0.00 |
$0.00 |
$0.00 |
$0.00 |
| Transportation Biofuels |
$1.40 |
$1.50 |
$1.90 |
$1.90 |
$2.00 |
$2.00 |
$1.90 |
$1.90 |
$1.80 |
$1.80 |
| Carbon Costs |
$0.00 |
$2.00 |
$2.10 |
$2.10 |
$2.20 |
$2.30 |
$2.40 |
$2.50 |
$2.50 |
$2.60 |
| Total Cost |
$45.10 |
$49.60 |
$51.80 |
$52.80 |
$54.10 |
$54.80 |
$55.30 |
$55.30 |
$55.50 |
$55.50 |
Total system Costs - Outlook D (Billion 2016 $CAD) - 2026-2035
| Fuel and Cost |
2026 |
2027 |
2028 |
2029 |
2030 |
2031 |
2032 |
2033 |
2034 |
2035 |
| Diesel |
$15.30 |
$15.70 |
$16.00 |
$16.40 |
$16.80 |
$17.10 |
$17.10 |
$17.30 |
$17.50 |
$17.70 |
| Hydrogen |
$0.00 |
$0.00 |
$0.00 |
$0.00 |
$0.00 |
$0.00 |
$0.00 |
$0.00 |
$0.00 |
$0.00 |
| Motor Gasoline |
$20.30 |
$19.80 |
$19.50 |
$19.00 |
$18.60 |
$18.00 |
$17.50 |
$17.00 |
$16.60 |
$16.30 |
| Natural Gas |
$6.70 |
$6.60 |
$6.50 |
$6.50 |
$6.40 |
$6.30 |
$6.20 |
$6.10 |
$6.00 |
$5.90 |
| Other Heating Fuels |
$0.80 |
$0.70 |
$0.70 |
$0.70 |
$0.70 |
$0.70 |
$0.70 |
$0.70 |
$0.70 |
$0.80 |
| Other Industrial Fuels |
$2.10 |
$2.10 |
$2.00 |
$2.00 |
$2.00 |
$2.00 |
$1.90 |
$1.90 |
$1.90 |
$1.90 |
| Other Transportation Fuels |
$5.50 |
$5.70 |
$5.90 |
$6.10 |
$6.40 |
$6.60 |
$6.80 |
$7.00 |
$7.20 |
$7.40 |
| Propane and NGL |
$0.60 |
$0.50 |
$0.50 |
$0.50 |
$0.50 |
$0.50 |
$0.50 |
$0.50 |
$0.50 |
$0.50 |
| Renewable Natural Gas |
$0.00 |
$0.00 |
$0.00 |
$0.00 |
$0.00 |
$0.00 |
$0.00 |
$0.00 |
$0.00 |
$0.00 |
| Transportation Biofuels |
$1.70 |
$1.70 |
$1.60 |
$1.60 |
$1.60 |
$1.50 |
$1.50 |
$1.40 |
$1.40 |
$1.40 |
| Carbon Costs |
$2.70 |
$2.80 |
$2.90 |
$3.00 |
$3.10 |
$3.20 |
$3.30 |
$3.40 |
$3.50 |
$3.70 |
| Total Cost |
$55.60 |
$55.60 |
$55.70 |
$55.80 |
$56.00 |
$55.90 |
$55.70 |
$55.50 |
$55.50 |
$55.60 |
Total system Costs by Fuel – Outlook E
Total system Costs - Outlook E (Billion 2016 $CAD) - 2016-2025
| Fuel and Cost |
2016 |
2017 |
2018 |
2019 |
2020 |
2021 |
2022 |
2023 |
2024 |
2025 |
| Diesel |
$11.20 |
$11.70 |
$12.20 |
$12.40 |
$12.70 |
$12.90 |
$13.10 |
$13.30 |
$13.50 |
$13.70 |
| Hydrogen |
$0.00 |
$0.00 |
$0.00 |
$0.00 |
$0.10 |
$0.10 |
$0.10 |
$0.10 |
$0.10 |
$0.10 |
| Motor Gasoline |
$19.90 |
$20.40 |
$20.90 |
$20.90 |
$21.10 |
$21.10 |
$21.00 |
$20.70 |
$20.40 |
$20.00 |
| Natural Gas |
$5.50 |
$6.00 |
$6.40 |
$6.80 |
$6.90 |
$6.90 |
$6.90 |
$6.80 |
$6.70 |
$6.70 |
| Other Heating Fuels |
$1.30 |
$1.20 |
$1.20 |
$1.10 |
$1.00 |
$1.00 |
$0.90 |
$0.90 |
$0.80 |
$0.80 |
| Other Industrial Fuels |
$2.30 |
$2.30 |
$2.20 |
$2.30 |
$2.30 |
$2.30 |
$2.30 |
$2.30 |
$2.20 |
$2.20 |
| Other Transportation Fuels |
$2.60 |
$3.20 |
$3.60 |
$4.10 |
$4.40 |
$4.60 |
$4.90 |
$5.10 |
$5.40 |
$5.60 |
| Propane and NGL |
$0.80 |
$0.80 |
$0.80 |
$0.80 |
$0.80 |
$0.80 |
$0.80 |
$0.70 |
$0.70 |
$0.60 |
| Renewable Natural Gas |
$0.00 |
$0.00 |
$0.00 |
$0.00 |
$0.10 |
$0.10 |
$0.10 |
$0.20 |
$0.30 |
$0.40 |
| Transportation Biofuels |
$1.60 |
$1.80 |
$2.50 |
$2.50 |
$2.80 |
$3.00 |
$3.10 |
$3.20 |
$3.20 |
$3.30 |
| Carbon Costs |
$0.00 |
$2.00 |
$2.00 |
$2.10 |
$2.20 |
$2.30 |
$2.30 |
$2.40 |
$2.50 |
$2.60 |
| Total Cost |
$45.10 |
$49.60 |
$51.90 |
$52.90 |
$54.30 |
$55.10 |
$55.60 |
$55.60 |
$55.80 |
$55.90 |
Total system Costs - Outlook E (Billion 2016 $CAD) - 2026-2035
| Fuel and Cost |
2026 |
2027 |
2028 |
2029 |
2030 |
2031 |
2032 |
2033 |
2034 |
2035 |
| Diesel |
$13.90 |
$14.10 |
$14.30 |
$14.60 |
$14.90 |
$15.00 |
$15.00 |
$15.00 |
$15.10 |
$15.10 |
| Hydrogen |
$0.10 |
$0.10 |
$0.10 |
$0.10 |
$0.10 |
$0.10 |
$0.10 |
$0.10 |
$0.10 |
$0.20 |
| Motor Gasoline |
$19.60 |
$19.10 |
$18.60 |
$18.10 |
$17.60 |
$17.00 |
$16.50 |
$15.90 |
$15.50 |
$15.10 |
| Natural Gas |
$6.60 |
$6.50 |
$6.40 |
$6.30 |
$6.20 |
$6.20 |
$6.20 |
$6.10 |
$6.10 |
$6.00 |
| Other Heating Fuels |
$0.80 |
$0.70 |
$0.70 |
$0.70 |
$0.70 |
$0.70 |
$0.70 |
$0.70 |
$0.70 |
$0.70 |
| Other Industrial Fuels |
$2.20 |
$2.20 |
$2.20 |
$2.20 |
$2.20 |
$2.10 |
$2.10 |
$2.10 |
$2.10 |
$2.20 |
| Other Transportation Fuels |
$5.90 |
$6.10 |
$6.40 |
$6.60 |
$6.90 |
$7.10 |
$7.30 |
$7.50 |
$7.80 |
$8.00 |
| Propane and NGL |
$0.60 |
$0.60 |
$0.50 |
$0.50 |
$0.50 |
$0.60 |
$0.60 |
$0.60 |
$0.60 |
$0.60 |
| Renewable Natural Gas |
$0.60 |
$0.70 |
$0.80 |
$0.80 |
$0.90 |
$0.90 |
$0.90 |
$0.90 |
$0.90 |
$0.90 |
| Transportation Biofuels |
$3.40 |
$3.50 |
$3.50 |
$3.60 |
$3.70 |
$3.80 |
$3.90 |
$4.00 |
$4.10 |
$4.20 |
| Carbon Costs |
$2.60 |
$2.70 |
$2.80 |
$2.90 |
$3.00 |
$3.10 |
$3.20 |
$3.30 |
$3.40 |
$3.50 |
| Total Cost |
$56.10 |
$56.20 |
$56.30 |
$56.40 |
$56.70 |
$56.60 |
$56.50 |
$56.30 |
$56.40 |
$56.50 |
Total system Costs by Fuel – Outlook F
Total system Costs - Outlook F (Billion 2016 $CAD) - 2016-2025
| Fuel and Cost |
2016 |
2017 |
2018 |
2019 |
2020 |
2021 |
2022 |
2023 |
2024 |
2025 |
| Diesel |
$11.00 |
$11.40 |
$11.70 |
$11.80 |
$12.00 |
$12.10 |
$12.20 |
$12.20 |
$12.30 |
$12.40 |
| Hydrogen |
$0.00 |
$0.10 |
$0.10 |
$0.10 |
$0.10 |
$0.10 |
$0.10 |
$0.20 |
$0.20 |
$0.20 |
| Motor Gasoline |
$19.80 |
$20.20 |
$20.60 |
$20.60 |
$20.80 |
$20.70 |
$20.50 |
$20.20 |
$19.80 |
$19.30 |
| Natural Gas |
$5.50 |
$6.10 |
$6.40 |
$6.70 |
$6.80 |
$6.70 |
$6.70 |
$6.50 |
$6.30 |
$6.10 |
| Other Heating Fuels |
$1.30 |
$1.20 |
$1.20 |
$1.10 |
$1.00 |
$1.00 |
$0.90 |
$0.80 |
$0.80 |
$0.80 |
| Other Industrial Fuels |
$2.30 |
$2.30 |
$2.20 |
$2.20 |
$2.20 |
$2.30 |
$2.30 |
$2.20 |
$2.10 |
$2.10 |
| Other Transportation Fuels |
$2.70 |
$3.40 |
$3.80 |
$4.20 |
$4.60 |
$4.90 |
$5.20 |
$5.50 |
$5.80 |
$6.00 |
| Propane and NGL |
$0.80 |
$0.80 |
$0.80 |
$0.80 |
$0.80 |
$0.80 |
$0.80 |
$0.70 |
$0.60 |
$0.60 |
| Renewable Natural Gas |
$0.00 |
$0.00 |
$0.00 |
$0.10 |
$0.10 |
$0.20 |
$0.20 |
$0.40 |
$0.60 |
$0.90 |
| Transportation Biofuels |
$1.90 |
$2.10 |
$3.10 |
$3.20 |
$3.70 |
$4.00 |
$4.20 |
$4.40 |
$4.60 |
$4.80 |
| Carbon Costs |
$0.00 |
$2.00 |
$2.00 |
$2.00 |
$2.10 |
$2.20 |
$2.30 |
$2.30 |
$2.30 |
$2.40 |
| Total Cost |
$45.10 |
$49.50 |
$51.90 |
$52.90 |
$54.30 |
$55.00 |
$55.40 |
$55.40 |
$55.50 |
$55.50 |
Total system Costs - Outlook F (Billion 2016 $CAD) - 2026-2035
| Fuel and Cost |
2026 |
2027 |
2028 |
2029 |
2030 |
2031 |
2032 |
2033 |
2034 |
2035 |
| Diesel |
$12.50 |
$12.60 |
$12.60 |
$12.80 |
$12.90 |
$12.90 |
$12.70 |
$12.60 |
$12.60 |
$12.50 |
| Hydrogen |
$0.20 |
$0.20 |
$0.20 |
$0.20 |
$0.20 |
$0.30 |
$0.30 |
$0.30 |
$0.30 |
$0.30 |
| Motor Gasoline |
$18.80 |
$18.20 |
$17.80 |
$17.20 |
$16.70 |
$16.00 |
$15.40 |
$14.80 |
$14.20 |
$13.80 |
| Natural Gas |
$5.90 |
$5.70 |
$5.50 |
$5.40 |
$5.20 |
$5.10 |
$5.00 |
$4.80 |
$4.70 |
$4.60 |
| Other Heating Fuels |
$0.70 |
$0.70 |
$0.70 |
$0.70 |
$0.70 |
$0.70 |
$0.70 |
$0.70 |
$0.70 |
$0.70 |
| Other Industrial Fuels |
$2.10 |
$2.10 |
$2.00 |
$2.00 |
$2.00 |
$1.90 |
$1.90 |
$1.90 |
$1.90 |
$1.80 |
| Other Transportation Fuels |
$6.30 |
$6.60 |
$6.80 |
$7.10 |
$7.40 |
$7.60 |
$7.90 |
$8.10 |
$8.40 |
$8.70 |
| Propane and NGL |
$0.50 |
$0.50 |
$0.50 |
$0.50 |
$0.50 |
$0.50 |
$0.50 |
$0.50 |
$0.50 |
$0.50 |
| Renewable Natural Gas |
$1.10 |
$1.30 |
$1.50 |
$1.70 |
$1.90 |
$1.90 |
$1.90 |
$1.90 |
$1.90 |
$1.90 |
| Transportation Biofuels |
$5.00 |
$5.20 |
$5.40 |
$5.60 |
$5.80 |
$6.00 |
$6.30 |
$6.50 |
$6.70 |
$7.00 |
| Carbon Costs |
$2.40 |
$2.50 |
$2.50 |
$2.50 |
$2.60 |
$2.60 |
$2.70 |
$2.70 |
$2.80 |
$2.90 |
| Total Cost |
$55.60 |
$55.60 |
$55.60 |
$55.60 |
$55.80 |
$55.50 |
$55.20 |
$54.80 |
$54.60 |
$54.60 |
Appendix
Fuel Price Sources
| System |
Fuel |
Source |
| Residential, Commercial & Industrial |
Natural Gas |
IESO (OPO data share) |
| Residential, Commercial & Industrial |
Fuel Oil |
National Energy Board, Canada’s Energy Future 2016: Energy Supply and Demand Projections to 2040 (End-Use Prices Appendix), http://www.neb-one.gc.ca/nrg/ntgrtd/ftr/2016/index-eng.html |
| All systems |
Propane |
U.S. Energy Information Administration, Annual Energy Outlook 2016 (Table: Energy Prices by system and Source), http://www.eia.gov/forecasts/aeo/ |
| Residential, Commercial & Industrial |
Wood |
Reeb, J. Home Heating Fuels, Oregon State University, June 2009, http://extension.oregonstate.edu/lincoln/sites/default/files/home_heating_fuels_ec1628-e.pdf |
| All systems |
Renewable Natural Gas |
Electrigaz in conjunction with Enbridge Gas Distribution Inc. and Union Gas Ltd., Economic Study on Renewable Natural Gas Production and Injection Costs in the Natural Gas Distribution Grid in Ontario - RNG Program Pricing Report, September 2011. PDF page 269/311 https://www.uniongas.com/~/media/aboutus/regulatory/rate-cases/eb-2011-0283-rng/Union_APPL_Rates_20110930.pdf?la=en |
| Transportation & Industrial |
Motor Gasoline |
National Energy Board, Canada’s Energy Future 2016: Energy Supply and Demand Projections to 2040 (End-Use Prices Appendix), http://www.neb-one.gc.ca/nrg/ntgrtd/ftr/2016/index-eng.html |
| Transportation & Industrial |
Diesel |
National Energy Board, Canada’s Energy Future 2016: Energy Supply and Demand Projections to 2040 (End-Use Prices Appendix), http://www.neb-one.gc.ca/nrg/ntgrtd/ftr/2016/index-eng.html |
| Transportation |
Fuel Oil |
U.S. Energy Information Administration, Annual Energy Outlook 2016 (Table: Energy Prices by system and Source), http://www.eia.gov/forecasts/aeo/ |
| Transportation |
Aviation Fuel |
U.S. Energy Information Administration, Annual Energy Outlook 2016 (Table: Energy Prices by system and Source), http://www.eia.gov/forecasts/aeo/ |
| Transportation |
Bio-Based Diesels |
U.S. Department of Energy Alternative Fuels Data Center, Alternative Fuel Price Report, http://www.afdc.energy.gov/fuels/prices.html |
| Transportation |
Ethanol |
U.S. Energy Information Administration, Annual Energy Outlook 2016 (Table: Energy Prices by system and Source), http://www.eia.gov/forecasts/aeo/ |
| Transportation |
Hydrogen |
Papageorogopoulos, D., U.S. Department of Energy Fuel Cell Technologies Office, Hydrogen and Fuel Cell Perspectives for Backup Power Applications, May 2015 http://www.iphe.net/docs/Meetings/SC23/Workshop/2_%20DoE_USA.pdf |
| Transportation |
Natural Gas |
U.S. Energy Information Administration, Annual Energy Outlook 2016 (Table: Energy Prices by system and Source), http://www.eia.gov/forecasts/aeo/ |
| Industrial |
Fuel Oil (Heavy) |
U.S. Energy Information Administration, Annual Energy Outlook 2016 (Table: Energy Prices by system and Source), http://www.eia.gov/forecasts/aeo/ |
| Industrial |
Coal |
U.S. Energy Information Administration, Annual Energy Outlook 2016 (Table: Energy Prices by system and Source), http://www.eia.gov/forecasts/aeo/ |
Fuel Price Development
All fuels converted to common units (2016 CAD$/GJ) using forecast exchange and inflation rates provided by IESO.
Natural Gas Prices
- Prices adapted from OPO pricing forecast (IESO) to vary by outlook.
- Price changes by outlook adjusted to consider consumption volumes and distribution cost impacts, as well as DSM incremental to that assumed for Outlook B.
- Total distribution costs in Ontario assumed to be fixed at $2 billion (2016 CAD$) per year (based on approved distribution revenue in EB-2015-0116 and EB-2015-0114)
Prices drawn from the EIA Annual Outlook are adapted to be representative of Ontario using a comparative scaling approach based on the available NEB (or IESO, in the case of natural gas) Ontario-specific data:
- Step 1: Determine ratio between NEB and EIA price projections for fuels that are available from both sources (e.g., Motor Gasoline)
- Step 2: Assign a “representative fuel” (from Step 1) to each fuel with an EIA price projection and no Ontario specific price.
- Step 3: Apply ratio from the Step 1 “representative fuel” to the Step 2 EIA price projection to scale prices to representative of Ontario.
EIA E85 price projection used as a proxy for ethanol (no ethanol-only projection).
Bio-based diesels price based on historical comparison of B99/100 prices with E85 prices, applied to EIA-derived ethanol projection.
Renewable natural gas assumed to be all derived from anaerobic digestion.
Source document for hydrogen price estimates cost-at-pump of less than $4 per gasoline gallon equivalent (gge). Price assumed to be $4/gge (2015 US$)
Wood price average of 6 types discussed in study. Assumed commercial and industrial price 80% and 60% (respectively) of residential price due to volume.
For some industrial fuels (e.g., petroleum coke, still gas, etc.) no third-party price projection was available. In these cases, one of the other price projections developed was assumed to be a reasonable proxy.
Two additional cost inputs:
- Carbon costs from cap-and-trade: Time series of projected carbon costs assumed in OPO analysis (IESO).
- Incremental DSM costs for Outlook E and F. Developed based on the approved 2015 – 2020 DSM plans (EB-2015-0029 and EB-2015-0049)
Incremental (to Outlook B) natural gas DSM:
- Cost of incremental DSM was defined in terms of incremental DSM achieved in each outlook. For example, if total gas savings in Year 1 is 100, and total gas savings in Year 2 is 110, then DSM cost in Year 2 is 10 (110 – 100) times the DSM cost.
- Based on Enbridge and Union’s approved DSM budgets and targets for 2016 through 2020 the value of incremental achieved DSM in any given year is approximately $16.50/GJ.
Projected Delivered Prices (2016 CAD$/GJ) (Natural Gas)
Residential 2016-2025
| Outlook |
2016 |
2017 |
2018 |
2019 |
2020 |
2021 |
2022 |
2023 |
2024 |
2025 |
| B |
$8.80 |
$9.60 |
$10.00 |
$10.50 |
$10.80 |
$10.80 |
$10.90 |
$10.90 |
$11.00 |
$11.00 |
| C |
$8.80 |
$9.60 |
$10.00 |
$10.50 |
$10.70 |
$10.80 |
$10.80 |
$10.90 |
$11.00 |
$11.10 |
| D |
$8.80 |
$9.60 |
$10.00 |
$10.50 |
$10.80 |
$10.80 |
$10.90 |
$11.00 |
$11.10 |
$11.20 |
| E |
$8.80 |
$9.60 |
$10.00 |
$10.50 |
$10.80 |
$10.90 |
$10.90 |
$11.00 |
$11.10 |
$11.30 |
| F |
$8.80 |
$9.60 |
$10.10 |
$10.60 |
$10.90 |
$11.00 |
$11.10 |
$11.30 |
$11.50 |
$11.80 |
Residential 2026-2035
| Outlook |
2026 |
2027 |
2028 |
2029 |
2030 |
2031 |
2032 |
2033 |
2034 |
2035 |
| B |
$11.10 |
$11.10 |
$11.20 |
$11.20 |
$11.30 |
$11.30 |
$11.40 |
$11.50 |
$11.50 |
$11.60 |
| C |
$11.10 |
$11.20 |
$11.30 |
$11.50 |
$11.60 |
$11.70 |
$11.80 |
$12.00 |
$12.10 |
$12.20 |
| D |
$11.30 |
$11.50 |
$11.60 |
$11.80 |
$12.00 |
$12.20 |
$12.50 |
$12.70 |
$13.00 |
$13.20 |
| E |
$11.40 |
$11.60 |
$11.70 |
$11.90 |
$12.10 |
$12.20 |
$12.40 |
$12.50 |
$12.70 |
$12.80 |
| F |
$12.10 |
$12.40 |
$12.70 |
$13.10 |
$13.60 |
$13.90 |
$14.30 |
$14.70 |
$15.10 |
$15.50 |
Commercial 2016-2025
| Outlook |
2016 |
2017 |
2018 |
2019 |
2020 |
2021 |
2022 |
2023 |
2024 |
2025 |
| B |
$5.00 |
$5.70 |
$6.10 |
$6.40 |
$6.60 |
$6.60 |
$6.60 |
$6.60 |
$6.60 |
$6.80 |
| C |
$5.00 |
$5.70 |
$6.10 |
$6.40 |
$6.70 |
$6.60 |
$6.60 |
$6.60 |
$6.70 |
$6.80 |
| D |
$5.00 |
$5.70 |
$6.10 |
$6.40 |
$6.70 |
$6.60 |
$6.60 |
$6.60 |
$6.70 |
$6.80 |
| E |
$5.00 |
$5.70 |
$6.10 |
$6.50 |
$6.70 |
$6.70 |
$6.70 |
$6.70 |
$6.80 |
$6.90 |
| F |
$5.20 |
$5.80 |
$6.30 |
$6.60 |
$6.90 |
$6.90 |
$6.90 |
$7.00 |
$7.10 |
$7.30 |
Commercial 2026-2035
| Outlook |
2026 |
2027 |
2028 |
2029 |
2030 |
2031 |
2032 |
2033 |
2034 |
2035 |
| B |
$6.80 |
$6.80 |
$6.80 |
$6.80 |
$6.80 |
$6.90 |
$6.90 |
$6.90 |
$6.90 |
$6.90 |
| C |
$6.80 |
$6.80 |
$6.80 |
$6.80 |
$6.80 |
$7.00 |
$7.00 |
$7.00 |
$7.00 |
$7.10 |
| D |
$6.80 |
$6.80 |
$6.80 |
$6.80 |
$6.90 |
$7.00 |
$7.00 |
$7.10 |
$7.20 |
$7.30 |
| E |
$7.00 |
$7.00 |
$7.00 |
$7.10 |
$7.10 |
$7.30 |
$7.30 |
$7.30 |
$7.40 |
$7.40 |
| F |
$7.40 |
$7.60 |
$7.70 |
$7.80 |
$8.00 |
$8.20 |
$8.30 |
$8.40 |
$8.60 |
$8.80 |
Industrial 2016-2025
| Outlook |
2016 |
2017 |
2018 |
2019 |
2020 |
2021 |
2022 |
2023 |
2024 |
2025 |
| B |
$4.00 |
$4.60 |
$5.00 |
$5.30 |
$5.50 |
$5.50 |
$5.50 |
$5.50 |
$5.50 |
$5.50 |
| C |
$4.00 |
$4.60 |
$5.00 |
$5.30 |
$5.50 |
$5.50 |
$5.50 |
$5.50 |
$5.50 |
$5.50 |
| D |
$4.00 |
$4.60 |
$5.00 |
$5.30 |
$5.50 |
$5.50 |
$5.50 |
$5.50 |
$5.50 |
$5.50 |
| E |
$4.00 |
$4.60 |
$5.00 |
$5.40 |
$5.60 |
$5.60 |
$5.60 |
$5.60 |
$5.60 |
$5.60 |
| F |
$4.00 |
$4.70 |
$5.10 |
$5.40 |
$5.60 |
$5.60 |
$5.60 |
$5.70 |
$5.70 |
$5.70 |
Industrial 2026-2035
| Outlook |
2026 |
2027 |
2028 |
2029 |
2030 |
2031 |
2032 |
2033 |
2034 |
2035 |
| B |
$5.50 |
$5.50 |
$5.50 |
$5.50 |
$5.50 |
$5.50 |
$5.50 |
$5.50 |
$5.50 |
$5.50 |
| C |
$5.50 |
$5.50 |
$5.50 |
$5.50 |
$5.50 |
$5.50 |
$5.50 |
$5.50 |
$5.50 |
$5.50 |
| D |
$5.50 |
$5.60 |
$5.60 |
$5.60 |
$5.60 |
$5.60 |
$5.60 |
$5.60 |
$5.60 |
$5.60 |
| E |
$5.60 |
$5.60 |
$5.60 |
$5.60 |
$5.60 |
$5.70 |
$5.70 |
$5.70 |
$5.70 |
$5.70 |
| F |
$5.70 |
$5.80 |
$5.80 |
$5.90 |
$5.90 |
$5.90 |
$6.00 |
$6.00 |
$6.00 |
$6.10 |
Projected Prices (2016 CAD$/GJ) (Other Fuels)
Residential 2016-2025
| Fuel |
2016 |
2017 |
2018 |
2019 |
2020 |
2021 |
2022 |
2023 |
2024 |
2025 |
| Fuel Oil |
$31.40 |
$32.10 |
$32.80 |
$33.10 |
$33.60 |
$34.10 |
$34.50 |
$34.90 |
$35.20 |
$35.50 |
| Propane |
$16.10 |
$17.90 |
$18.60 |
$19.50 |
$19.60 |
$19.90 |
$20.20 |
$20.10 |
$19.90 |
$19.80 |
| Wood |
$14.20 |
$14.20 |
$14.20 |
$14.20 |
$14.20 |
$14.20 |
$14.20 |
$14.20 |
$14.20 |
$14.20 |
| Renewable Natural Gas |
$18.80 |
$13.10 |
$12.70 |
$12.30 |
$12.20 |
$12.20 |
$12.20 |
$12.20 |
$12.20 |
$12.20 |
Residential 2026-2035
| Fuel |
2026 |
2027 |
2028 |
2029 |
2030 |
2031 |
2032 |
2033 |
2034 |
2035 |
| Fuel Oil |
$35.80 |
$36.20 |
$36.50 |
$36.90 |
$37.20 |
$37.40 |
$37.60 |
$37.80 |
$38.00 |
$38.20 |
| Propane |
$19.90 |
$20.10 |
$20.20 |
$20.30 |
$20.40 |
$20.70 |
$21.10 |
$21.50 |
$21.80 |
$22.00 |
| Wood |
$14.20 |
$14.20 |
$14.20 |
$14.20 |
$14.20 |
$14.20 |
$14.20 |
$14.20 |
$14.20 |
$14.20 |
| Renewable Natural Gas |
$12.20 |
$12.20 |
$12.20 |
$12.10 |
$12.10 |
$12.10 |
$12.10 |
$12.10 |
$12.10 |
$12.10 |
Commercial 2016-2025
| Fuel |
2016 |
2017 |
2018 |
2019 |
2020 |
2021 |
2022 |
2023 |
2024 |
2025 |
| Fuel Oil |
$27.70 |
$28.40 |
$29.00 |
$29.30 |
$29.70 |
$30.20 |
$30.50 |
$30.90 |
$31.10 |
$31.40 |
| Propane |
$13.50 |
$14.50 |
$14.50 |
$14.70 |
$14.70 |
$15.00 |
$15.30 |
$15.10 |
$15.00 |
$14.90 |
| Wood |
$11.40 |
$11.40 |
$11.40 |
$11.40 |
$11.40 |
$11.40 |
$11.40 |
$11.40 |
$11.40 |
$11.40 |
| Renewable Natural Gas |
$18.80 |
$13.10 |
$12.70 |
$12.30 |
$12.20 |
$12.20 |
$12.20 |
$12.20 |
$12.20 |
$12.20 |
Commercial 2026-2035
| Fuel |
2026 |
2027 |
2028 |
2029 |
2030 |
2031 |
2032 |
2033 |
2034 |
2035 |
| Fuel Oil |
$31.70 |
$32.00 |
$32.30 |
$32.60 |
$32.90 |
$33.10 |
$33.30 |
$33.40 |
$33.60 |
$33.80 |
| Propane |
$15.00 |
$15.20 |
$15.30 |
$15.30 |
$15.40 |
$15.70 |
$16.10 |
$16.40 |
$16.70 |
$16.90 |
| Wood |
$11.40 |
$11.40 |
$11.40 |
$11.40 |
$11.40 |
$11.40 |
$11.40 |
$11.40 |
$11.40 |
$11.40 |
| Renewable Natural Gas |
$12.20 |
$12.20 |
$12.20 |
$12.10 |
$12.10 |
$12.10 |
$12.10 |
$12.10 |
$12.10 |
$12.10 |
Transportation 2016-2025
| Fuel |
2026 |
2027 |
2028 |
2029 |
2030 |
2031 |
2032 |
2033 |
2034 |
2035 |
| Motor Gasoline |
$38.10 |
$39.40 |
$40.50 |
$40.90 |
$41.80 |
$42.60 |
$43.20 |
$43.70 |
$44.20 |
$44.70 |
| Diesel |
$37.80 |
$39.20 |
$40.40 |
$40.80 |
$41.80 |
$42.60 |
$43.30 |
$43.90 |
$44.40 |
$45.00 |
| Fuel Oil |
$12.90 |
$16.70 |
$19.00 |
$20.60 |
$21.40 |
$22.30 |
$23.10 |
$23.40 |
$23.80 |
$24.30 |
| Aviation Fuel |
$19.90 |
$23.90 |
$25.90 |
$28.40 |
$29.70 |
$31.00 |
$32.20 |
$32.80 |
$33.50 |
$34.40 |
| Propane |
$38.10 |
$39.00 |
$39.50 |
$39.00 |
$39.00 |
$39.20 |
$39.80 |
$40.00 |
$40.30 |
$40.60 |
| Biodiesel |
$44.20 |
$45.70 |
$59.40 |
$57.20 |
$60.70 |
$61.90 |
$60.90 |
$60.30 |
$59.10 |
$58.20 |
| Ethanol |
$42.90 |
$44.40 |
$57.60 |
$55.40 |
$58.90 |
$60.10 |
$59.10 |
$58.50 |
$57.40 |
$56.50 |
| Hydrogen |
$43.60 |
$43.60 |
$43.60 |
$43.60 |
$43.60 |
$43.60 |
$43.60 |
$43.60 |
$43.60 |
$43.60 |
| Natural Gas (CNG/LNG) |
$36.50 |
$34.90 |
$33.80 |
$31.30 |
$30.60 |
$30.00 |
$29.70 |
$29.70 |
$29.70 |
$29.60 |
Transportation 2026-2035
| Fuel |
2026 |
2027 |
2028 |
2029 |
2030 |
2031 |
2032 |
2033 |
2034 |
2035 |
| Motor Gasoline |
$45.20 |
$45.70 |
$46.30 |
$46.90 |
$47.40 |
$47.70 |
$48.00 |
$48.30 |
$48.50 |
$48.80 |
| Diesel |
$45.50 |
$46.10 |
$46.70 |
$47.30 |
$47.90 |
$48.20 |
$48.50 |
$48.90 |
$49.20 |
$49.50 |
| Fuel Oil |
$24.90 |
$25.40 |
$25.80 |
$26.40 |
$26.80 |
$27.20 |
$27.50 |
$27.80 |
$28.30 |
$28.70 |
| Aviation Fuel |
$35.10 |
$35.80 |
$36.50 |
$37.30 |
$38.00 |
$38.70 |
$39.30 |
$39.80 |
$40.60 |
$41.30 |
| Propane |
$40.60 |
$40.70 |
$41.20 |
$41.50 |
$41.80 |
$41.80 |
$41.80 |
$41.90 |
$41.80 |
$42.20 |
| Biodiesel |
$57.90 |
$57.90 |
$57.10 |
$56.70 |
$56.80 |
$56.40 |
$56.40 |
$56.50 |
$56.20 |
$56.30 |
| Ethanol |
$56.20 |
$56.10 |
$55.40 |
$55.00 |
$55.10 |
$54.70 |
$54.70 |
$54.80 |
$54.50 |
$54.60 |
| Hydrogen |
$43.60 |
$43.60 |
$43.60 |
$43.60 |
$43.60 |
$43.60 |
$43.60 |
$43.60 |
$43.60 |
$43.60 |
| Natural Gas (CNG/LNG) |
$29.00 |
$28.50 |
$28.20 |
$27.90 |
$27.80 |
$27.10 |
$26.60 |
$26.20 |
$25.90 |
$25.90 |
Industrial 2016-2025
| Fuel |
2026 |
2027 |
2028 |
2029 |
2030 |
2031 |
2032 |
2033 |
2034 |
2035 |
| Propane & NGLs |
$18.50 |
$19.20 |
$19.00 |
$19.50 |
$19.20 |
$20.00 |
$20.50 |
$20.00 |
$19.70 |
$19.50 |
| Fuel Oil (Distillate) |
$16.80 |
$17.50 |
$18.00 |
$18.30 |
$18.80 |
$19.20 |
$19.60 |
$19.90 |
$20.20 |
$20.50 |
| Fuel Oil (Residual) |
$6.10 |
$7.70 |
$8.50 |
$9.70 |
$10.70 |
$11.50 |
$12.30 |
$12.60 |
$12.80 |
$13.10 |
| Coal |
$5.50 |
$5.10 |
$4.70 |
$4.40 |
$4.20 |
$4.30 |
$4.30 |
$4.10 |
$4.00 |
$4.00 |
| Wood |
$8.50 |
$8.50 |
$8.50 |
$8.50 |
$8.50 |
$8.50 |
$8.50 |
$8.50 |
$8.50 |
$8.50 |
| Renewable Natural Gas |
$18.80 |
$13.10 |
$12.70 |
$12.30 |
$12.20 |
$12.20 |
$12.20 |
$12.20 |
$12.20 |
$12.20 |
Industrial 2026-2035
| Fuel |
2026 |
2027 |
2028 |
2029 |
2030 |
2031 |
2032 |
2033 |
2034 |
2035 |
| Propane & NGLs |
$20.00 |
$20.40 |
$20.70 |
$21.00 |
$21.20 |
$21.90 |
$22.40 |
$23.20 |
$23.90 |
$24.50 |
| Fuel Oil (Distillate) |
$20.80 |
$21.10 |
$21.40 |
$21.70 |
$22.00 |
$22.20 |
$22.30 |
$22.50 |
$22.70 |
$22.80 |
| Fuel Oil (Residual) |
$13.40 |
$13.60 |
$13.80 |
$14.10 |
$14.30 |
$14.50 |
$14.70 |
$14.90 |
$15.10 |
$15.20 |
| Coal |
$4.00 |
$4.10 |
$4.10 |
$4.00 |
$4.00 |
$4.10 |
$4.20 |
$4.20 |
$4.30 |
$4.30 |
| Wood |
$8.50 |
$8.50 |
$8.50 |
$8.50 |
$8.50 |
$8.50 |
$8.50 |
$8.50 |
$8.50 |
$8.50 |
| Renewable Natural Gas |
$12.20 |
$12.20 |
$12.20 |
$12.10 |
$12.10 |
$12.10 |
$12.10 |
$12.10 |
$12.10 |
$12.10 |