The content on this page is no longer up to date. It will remain on ontario.ca for a limited time before it moves to the Archives of Ontario.
Module 2: Demand Outlook
Glossary
The following acronyms appear throughout this module:
APS: Achievable Potential Study, the OEB’s 2016 Natural Gas Conservation Potential Study
CNG: Compressed natural gas
DSM: demand-side management (natural gas focused conservation)
EV: electric vehicles
IESO: Independent Electricity System Operator
FTR: Fuels Technical Report
LNG: Liquefied natural gas
OEB: Ontario Energy Board
OPO: Ontario Planning Outlook
PJ: Petajoule
RNG: Renewable natural gas
All Sectors
Demand Outlook
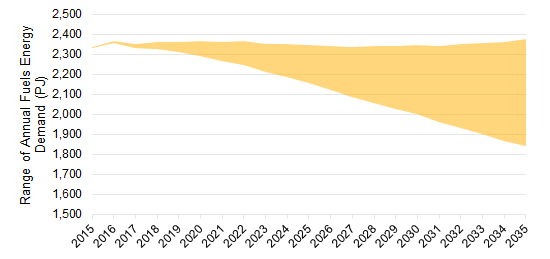
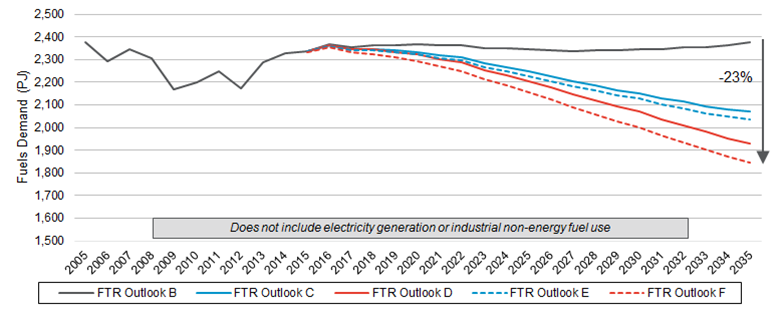
By 2035, the outlook for fuels demand ranges from between approximately 1,800 PJ (Outlook F) and nearly 2,400 PJ (Outlook B).
The FTR recognizes the uncertainty in future fuels demand by addressing a range of possible futures.
| Year | Estimate | Range |
|---|---|---|
| 2015 | 2333.645578 | 4.347763 |
| 2016 | 2355.267143 | 12.76259 |
| 2017 | 2332.981832 | 20.640815 |
| 2018 | 2325.290441 | 38.134071 |
| 2019 | 2309.371022 | 54.31513 |
| 2020 | 2293.27452 | 75.263321 |
| 2021 | 2268.82106 | 93.915562 |
| 2022 | 2249.200063 | 115.280383 |
| 2023 | 2211.3009 | 139.149835 |
| 2024 | 2184.5178 | 166.02918 |
| 2025 | 2154.80618 | 190.403928 |
| 2026 | 2122.272614 | 220.33091 |
| 2027 | 2088.71885 | 249.511257 |
| 2028 | 2058.333656 | 280.989339 |
| 2029 | 2028.947319 | 310.3116 |
| 2030 | 2000.099398 | 346.726794 |
| 2031 | 1964.271575 | 379.921356 |
| 2032 | 1934.723908 | 418.141463 |
| 2033 | 1900.95668 | 454.030685 |
| 2034 | 1869.928063 | 493.724791 |
| 2035 | 1843.187684 | 533.580602 |
Note: All outlooks are net of demand side management (DSM) and of the fuels savings resulting from fuel economy standards.
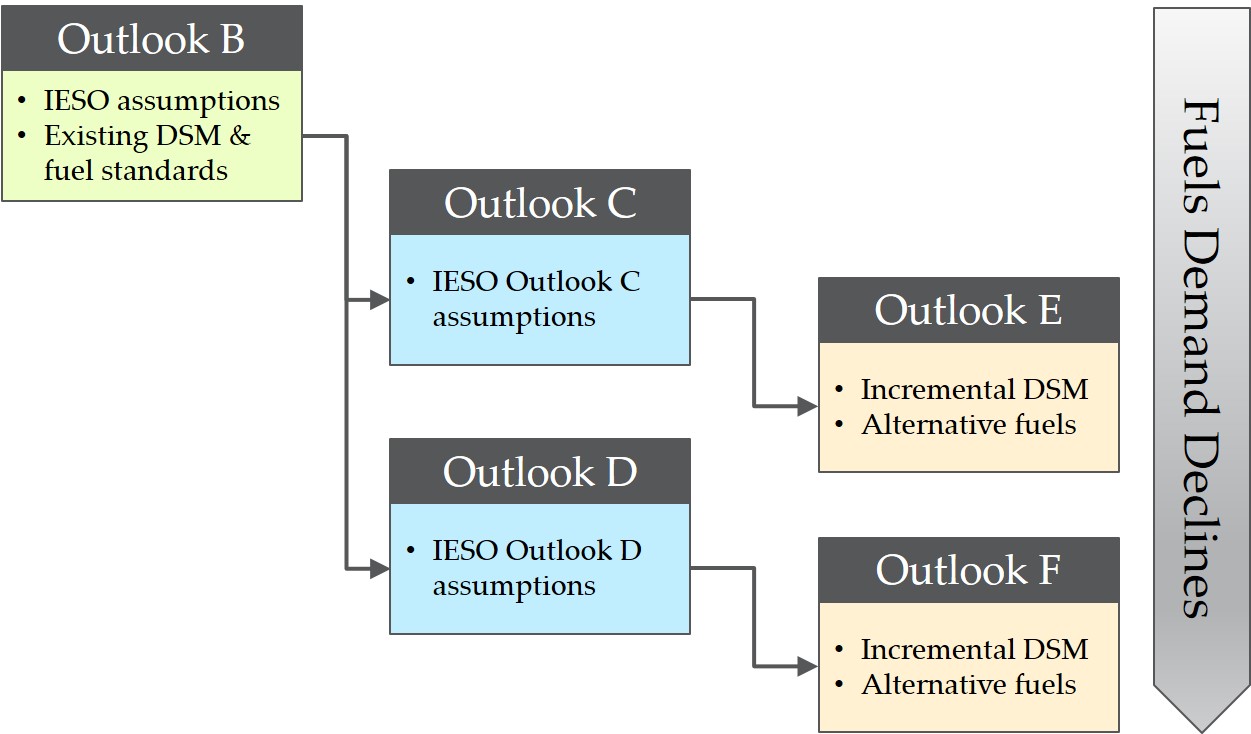
Five demand outlooks have been developed to provide context for the Long-Term Energy Plan (LTEP) discussion.
The range of future fuels demand is influenced by a wide variety of factors, including:
- Global macroeconomic and fuel pricing trends;
- Ontario-specific demographic and economic trends and technology development; and
- Trends in policy related to (or that materially affect) fuels use.
Implementation of the province’s climate change policies consistent with the cap and trade program and the Climate Change Action Plan will have an impact on the demand for fuels, primarily through the potential for greater electrification and increased use of alternative fuels which exists in nearly every part of the Ontario fuels energy system.
FTR demand outlooks reflect all of the assumptions adopted by the IESO for the corresponding Ontario Planning Outlook (OPO) demand outlooks.
Note: Outlook A was developed by IESO to explore the implications of lower electricity demand. Applying the assumptions of Outlook A to the fuels sector would result in lower fuels demand than Outlook B. Lower fuels demand is already explored in the FTR by Outlooks C, D, E and F. Outlook A has therefore not been modeled as part of the FTR.
Definition of Outlooks
| Sector | Outlook B | Outlook C | Outlook D | Outlook E | Outlook F |
|---|---|---|---|---|---|
| Residential | 498 PJ in 2035 | Oil and propane heating switches to heat pumps, electric and water heating gain 25% of gas market share.* (388 PJ in 2035) |
Oil and propane heating switches to heat pumps, electric and water heating gain 50% of gas market share.* (322 PJ in 2035) |
Assumptions as per Outlook C, plus:
|
Assumptions as per Outlook D, plus:
|
| Commercial | 233 PJ in 2035 | Oil and propane heating switches to heat pumps, electric and water heating gain 25% of gas market share.* (192 PJ in 2035) |
Oil and propane heating switches to heat pumps, electric and water heating gain 50% of gas market share.* (177 PJ in 2035) |
Assumptions as per Outlook C, plus:
|
Assumptions as per Outlook D, plus:
|
| Industrial | 671 PJ in 2035 | 5% of 2012 fossil energy switches to electric equivalent (607 PJ in 2035) |
10% of 2012 fossil energy switches to electric equivalent (550 PJ in 2035) |
Assumptions as per Outlook C, plus:
|
Assumptions as per Outlook D, plus:
|
| Transportation | 967 PJ in 2035 |
|
|
Assumptions as per Outlook C, plus:
|
Assumptions as per Outlook C, plus:
|
| Total | 2,377 PJ in 2035 | 2,070 PJ in 2035 | 1,931 PJ in 2035 | 2,037 PJ in 2035 | 1,842 PJ in 2035 |
FTR demand outlooks reflect all of the assumptions adopted by the IESO for the corresponding Ontario Planning Outlook (OPO) demand outlooks.
Additional fuels-related assumptions are applied in Outlooks E and F, as summarized in the preceding table. Details of these assumptions are provided below.
All outcomes are assumed to be achieved by 2035 and to be incremental to what would have been achieved under Outlook B.
| # | Outlook E | Outlook F |
|---|---|---|
| 1 | 200,000 single-family fossil-fuel-heated dwellings have their building envelope sufficiently improved to reduce heating load by 20 GJ/year. | 600,000 single-family fossil-fuel-heated dwellings have their building envelope sufficiently improved to reduce heating load by 20 GJ/year. |
| 2 | 85,000 multi-family fossil-fuel-heated dwellings have their building envelope sufficiently improved to reduce heating load by 9 GJ/year. | 255,000 multi-family fossil-fuel-heated dwellings have their building envelope sufficiently improved to reduce heating load by 9 GJ/year. |
| 3 | 2% reduction in heating load for fossil-fuel heated commercial buildings due to improved building envelope. | 6% reduction in heating load for fossil-fuel heated commercial buildings due to improved building envelope. |
| 4 | 90 million urban trips per year on diesel-fueled buses. | 180 million urban trips per year on diesel-fueled buses. |
| 5 | 600 diesel-fueled buses replaced by natural gas buses. | 1,200 diesel-fueled buses replaced by natural gas buses. |
| 6 | 650 million litres of gasoline replaced by ethanol. | 1,300 million litres of gasoline replaced by ethanol. |
| 7 | 500 million litres of petro-diesel replaced by biodiesel. | 1,000 million litres of petro-diesel replaced by biodiesel. |
| 8 | 500 million litres of petro-diesel replaced by renewable diesel. | 1,000 million litres of petro-diesel replaced by renewable diesel. |
| 9 | 70,000 propane light-duty vehicles on the road. | 175,000 propane light-duty vehicles on the road. |
| 10 | 150,000 hydrogen fuel-cell light-duty vehicles on the road. | 300,000 hydrogen fuel-cell light-duty vehicles on the road. |
| 11 | 7.5% of heavy duty freight vehicle km traveled powered by natural gas. | 15% of heavy duty freight vehicle km traveled powered by natural gas. |
| 12 | 78 PJ of RNG injected to the system. | 155 PJ of RNG injected to the system. |
| 13 | 2 PJ of residential natural gas use reduction due to improved efficiency (incremental DSM). | 5 PJ of residential natural gas use reduction due to improved efficiency (incremental DSM). |
| 14 | 2 PJ of commercial natural gas use reduction due to improved efficiency (incremental DSM). | 11 PJ of commercial natural gas use reduction due to improved efficiency (incremental DSM). |
| 15 | 12 PJ of industrial natural gas use reduction due to improved efficiency (incremental DSM). | 24 PJ of industrial natural gas use reduction due to improved efficiency (incremental DSM). |
* “market share” refers to a proportion of annual equipment sales, not of total installed equipment stock.
Annual net fuels energy demand across demand outlooks
| Year | FTR Outlook B | FTR Outlook C | FTR Outlook D | FTR Outlook E | FTR Outlook F |
|---|---|---|---|---|---|
| 2015 | 2337.993341 | 2337.616527 | 2337.616527 | 2336.058317 | 2333.645578 |
| 2016 | 2368.029733 | 2363.2648 | 2363.2648 | 2360.119369 | 2355.267143 |
| 2017 | 2353.622647 | 2346.285717 | 2346.285717 | 2341.603002 | 2332.981832 |
| 2018 | 2363.424512 | 2347.448874 | 2343.793847 | 2340.882287 | 2325.290441 |
| 2019 | 2363.686152 | 2340.550706 | 2332.965373 | 2332.103502 | 2309.371022 |
| 2020 | 2368.537841 | 2334.095203 | 2321.853316 | 2323.802934 | 2293.27452 |
| 2021 | 2362.736622 | 2319.113849 | 2302.117465 | 2307.046068 | 2268.82106 |
| 2022 | 2364.480446 | 2309.740553 | 2287.114306 | 2295.945475 | 2249.200063 |
| 2023 | 2350.450735 | 2281.659246 | 2253.574168 | 2266.242065 | 2211.3009 |
| 2024 | 2350.54698 | 2265.733034 | 2231.134669 | 2248.702189 | 2184.5178 |
| 2025 | 2345.210108 | 2246.32001 | 2205.588292 | 2227.739314 | 2154.80618 |
| 2026 | 2342.603524 | 2224.797633 | 2176.963872 | 2204.772311 | 2122.272614 |
| 2027 | 2338.230107 | 2204.670765 | 2147.352781 | 2183.176935 | 2088.71885 |
| 2028 | 2339.322995 | 2185.385466 | 2120.776751 | 2162.481785 | 2058.333656 |
| 2029 | 2339.258919 | 2165.295525 | 2094.758944 | 2141.007054 | 2028.947319 |
| 2030 | 2346.826192 | 2152.919554 | 2069.397181 | 2127.306555 | 2000.099398 |
| 2031 | 2344.192931 | 2128.89578 | 2036.998865 | 2102.061777 | 1964.271575 |
| 2032 | 2352.865371 | 2114.670556 | 2011.053137 | 2086.478798 | 1934.723908 |
| 2033 | 2354.987365 | 2093.470026 | 1980.982482 | 2063.845842 | 1900.95668 |
| 2034 | 2363.652854 | 2080.042491 | 1953.786263 | 2048.918952 | 1869.928063 |
| 2035 | 2376.768286 | 2069.66212 | 1931.132364 | 2036.947049 | 1843.187684 |
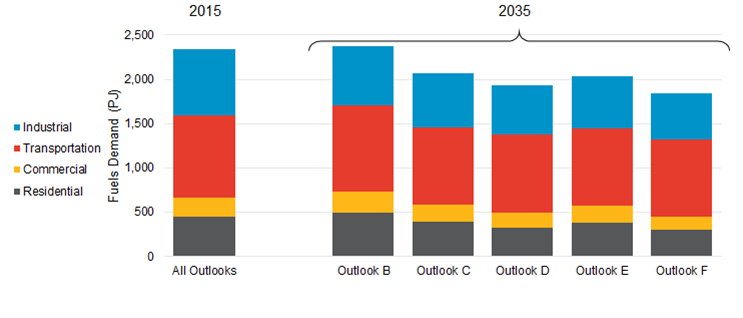
Breakdown of fuels energy demand by sector 2015 and 2035
| Energy (PJ) | 2015 | B 2035 | C 2035 | D 2035 | E 2035 | F 2035 |
|---|---|---|---|---|---|---|
| Residential | 447 | 498 | 388 | 322 | 381 | 302 |
| Commercial | 215 | 233 | 192 | 177 | 187 | 147 |
| Transportation | 927 | 975 | 883 | 883 | 878 | 874 |
| Industrial | 750 | 671 | 607 | 550 | 591 | 519 |
Fuels energy demand by Sector and Outlook (PJ)
| Year | B | C | D | E | F |
|---|---|---|---|---|---|
| 2015 | 447 | 447 | 447 | 446 | 446 |
| 2016 | 451 | 449 | 449 | 449 | 449 |
| 2017 | 454 | 450 | 450 | 450 | 448 |
| 2018 | 462 | 456 | 455 | 455 | 451 |
| 2019 | 464 | 455 | 454 | 453 | 448 |
| 2020 | 469 | 456 | 453 | 454 | 446 |
| 2021 | 468 | 451 | 447 | 448 | 438 |
| 2022 | 472 | 449 | 442 | 446 | 433 |
| 2023 | 470 | 442 | 433 | 439 | 423 |
| 2024 | 476 | 441 | 429 | 438 | 418 |
| 2025 | 476 | 436 | 421 | 431 | 408 |
| 2026 | 480 | 432 | 413 | 428 | 400 |
| 2027 | 479 | 425 | 402 | 420 | 388 |
| 2028 | 482 | 421 | 394 | 416 | 378 |
| 2029 | 483 | 415 | 383 | 409 | 367 |
| 2030 | 487 | 411 | 374 | 406 | 357 |
| 2031 | 488 | 405 | 363 | 399 | 346 |
| 2032 | 492 | 402 | 354 | 396 | 336 |
| 2033 | 492 | 396 | 342 | 389 | 323 |
| 2034 | 494 | 391 | 331 | 384 | 312 |
| 2035 | 498 | 388 | 322 | 381 | 302 |
View the Residential section.
| Year | B | C | D | E | F |
|---|---|---|---|---|---|
| 2015 | 215 | 215 | 215 | 215 | 214 |
| 2016 | 215 | 213 | 213 | 213 | 210 |
| 2017 | 216 | 213 | 213 | 213 | 209 |
| 2018 | 217 | 212 | 212 | 211 | 206 |
| 2019 | 218 | 212 | 212 | 211 | 206 |
| 2020 | 219 | 210 | 210 | 209 | 203 |
| 2021 | 218 | 209 | 209 | 207 | 200 |
| 2022 | 218 | 209 | 209 | 207 | 199 |
| 2023 | 219 | 208 | 208 | 205 | 196 |
| 2024 | 220 | 206 | 206 | 204 | 193 |
| 2025 | 221 | 206 | 206 | 204 | 192 |
| 2026 | 222 | 205 | 205 | 202 | 189 |
| 2027 | 223 | 206 | 203 | 203 | 186 |
| 2028 | 224 | 204 | 202 | 201 | 183 |
| 2029 | 226 | 203 | 203 | 199 | 182 |
| 2030 | 227 | 204 | 199 | 200 | 177 |
| 2031 | 228 | 202 | 198 | 198 | 174 |
| 2032 | 229 | 201 | 194 | 197 | 169 |
| 2033 | 231 | 197 | 190 | 193 | 163 |
| 2034 | 232 | 196 | 183 | 191 | 155 |
| 2035 | 233 | 192 | 177 | 187 | 147 |
View the Commercial section.
| Year | B | C | D | E | F |
|---|---|---|---|---|---|
| 2015 | 750 | 750 | 750 | 749 | 748 |
| 2016 | 763 | 763 | 763 | 761 | 760 |
| 2017 | 738 | 738 | 738 | 736 | 733 |
| 2018 | 729 | 725 | 722 | 722 | 715 |
| 2019 | 722 | 715 | 709 | 711 | 700 |
| 2020 | 715 | 704 | 695 | 699 | 685 |
| 2021 | 712 | 698 | 685 | 692 | 674 |
| 2022 | 708 | 691 | 674 | 684 | 661 |
| 2023 | 697 | 677 | 658 | 670 | 643 |
| 2024 | 690 | 666 | 644 | 658 | 628 |
| 2025 | 686 | 659 | 633 | 650 | 616 |
| 2026 | 678 | 648 | 618 | 638 | 600 |
| 2027 | 677 | 642 | 610 | 632 | 590 |
| 2028 | 672 | 634 | 598 | 623 | 577 |
| 2029 | 671 | 629 | 590 | 617 | 568 |
| 2030 | 670 | 624 | 583 | 612 | 559 |
| 2031 | 665 | 616 | 571 | 603 | 546 |
| 2032 | 665 | 612 | 564 | 598 | 538 |
| 2033 | 665 | 609 | 558 | 594 | 530 |
| 2034 | 667 | 607 | 553 | 592 | 524 |
| 2035 | 671 | 607 | 550 | 591 | 519 |
View the Industrial section.
| Year | B | C | D | E | F |
|---|---|---|---|---|---|
| 2015 | 927 | 926 | 926 | 926 | 926 |
| 2016 | 938 | 937 | 937 | 937 | 936 |
| 2017 | 945 | 945 | 945 | 944 | 943 |
| 2018 | 956 | 955 | 955 | 954 | 952 |
| 2019 | 960 | 959 | 959 | 957 | 955 |
| 2020 | 966 | 964 | 964 | 962 | 960 |
| 2021 | 965 | 961 | 961 | 959 | 957 |
| 2022 | 967 | 961 | 961 | 959 | 956 |
| 2023 | 964 | 955 | 955 | 952 | 950 |
| 2024 | 964 | 952 | 952 | 949 | 947 |
| 2025 | 961 | 945 | 945 | 942 | 939 |
| 2026 | 962 | 940 | 940 | 937 | 934 |
| 2027 | 959 | 932 | 932 | 928 | 925 |
| 2028 | 961 | 927 | 927 | 923 | 920 |
| 2029 | 960 | 918 | 918 | 915 | 911 |
| 2030 | 963 | 913 | 913 | 909 | 906 |
| 2031 | 963 | 905 | 905 | 901 | 898 |
| 2032 | 966 | 900 | 900 | 896 | 892 |
| 2033 | 967 | 892 | 892 | 888 | 884 |
| 2034 | 971 | 887 | 887 | 882 | 878 |
| 2035 | 975 | 883 | 883 | 878 | 874 |
View the Transportation section.
Economic Assumptions underlying fuels demand outlook
Economic assumptions reflect the assumptions adopted by the IESO for the OPO.
| Driver | 2005-2015 | 2015-2025 | 2025-2035 |
|---|---|---|---|
| Growth in number of residential households | 15% | 14% | 9% |
| Growth in commercial floor space | 20% | 15% | 11% |
| Ontario Industrial GDP (annual growth rate) | -2% | 1% | 1% |
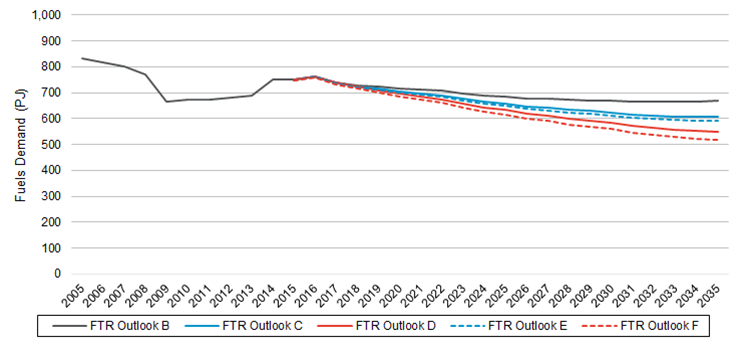
Residential Sector
Residential fuels energy demand 2015-2035: Outlooks B, C, D, E, F
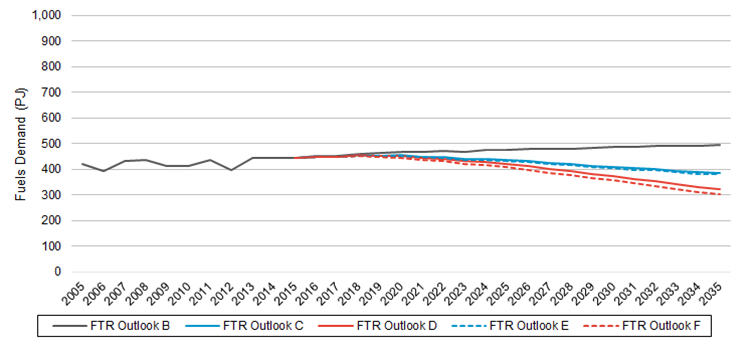
View the data used to create the above graph.
Note: Historical data used to calibrate the CanESS model are obtained from Statistics Canada and NRCan. Actual values in most cases are available only until 2013, meaning that 2015 values reported here are estimated, and outlook-specific, hence why they differ very slightly across outlooks.
Residential Sector Overview
The principal factor that could drive an increase in residential fuels demand in Outlook B is the forecast growth in households in the province.
Factors that could decrease residential fuels demand include:
- Electrification of space- and water-heating;
- Incremental building envelope improvement* (e.g. more insulation, more energy-efficient doors and windows, better air tightness etc.); and
- Incremental natural gas equipment efficiency improvements*.
*Incremental improvements modeled in Outlooks E and F corresponds to incremental achievable DSM potential identified in the OEB’s 2016 Natural Gas Conservation Potential study for the semi-constrained and unconstrained (respectively) achievable potential scenarios, after accounting for the erosion of DSM potential due to electrification.
In Outlook E and F, a substantial proportion of fuels energy shifts from conventional fossil sources (e.g. natural gas) to renewable ones (e.g. renewable natural gas). This shift affects GHG emissions, but does not materially affect total fuels energy use.
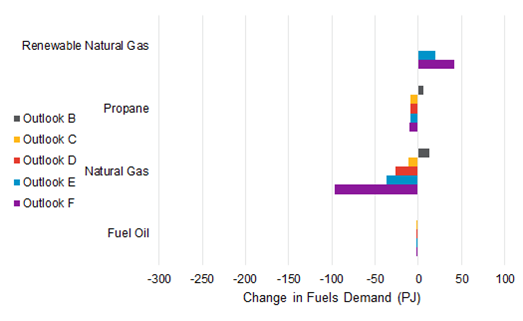
Forecast Change in Residential Fuels Demand by Fuel Type 2015 - 2035
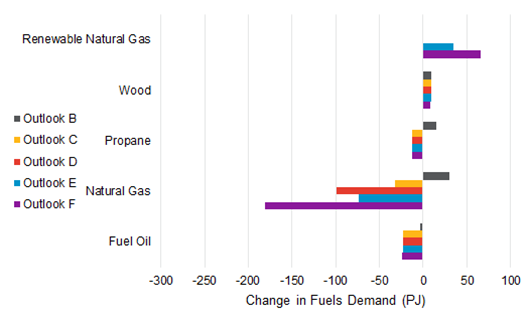
| Fuel Type | Outlook B | Outlook C | Outlook D | Outlook E | Outlook F |
|---|---|---|---|---|---|
| Fuel Oil | -3.056329 | -23.11011 | -23.050345 | -23.324705 | -23.692831 |
| Natural Gas | 30.495677 | -32.59028 | -98.754673 | -73.58402132 | -180.764845 |
| Propane | 14.905301 | -12.75174 | -12.66387 | -12.883026 | -12.883026 |
| Wood | 8.941289 | 9.606281 | 9.752656 | 9.017616 | 8.009838 |
| Renewable Natural Gas | 0 | 0 | 0 | 35.08420932 | 65.705419 |
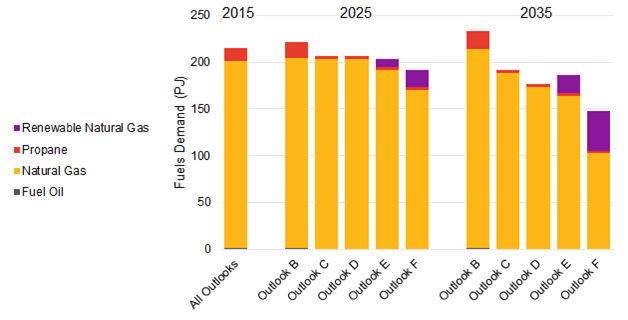
Residential Demand by Fuel Type (PJ), 2015, 2025, 2035: Outlooks B, C, D, E, F
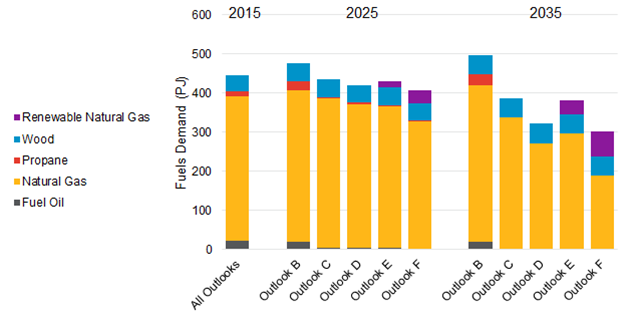
| Fuels Demand (PJ) | 2015 - All Outlooks | 2025 B | 2025 C | 2025 D | 2025 E | 2025 F | 2035 B | 2035 C | 2035 D | 2035 E | 2035 F |
|---|---|---|---|---|---|---|---|---|---|---|---|
| Fuel Oil | 24 | 19 | 4 | 4 | 4 | 4 | 21 | 1 | 1 | 1 | 0 |
| Natural Gas | 369 | 388 | 383 | 368 | 363 | 324 | 400 | 336 | 270 | 295 | 188 |
| Propane | 13 | 24 | 4 | 4 | 4 | 3 | 28 | 0 | 0 | 0 | 0 |
| Wood | 41 | 45 | 45 | 45 | 45 | 44 | 50 | 50 | 50 | 50 | 49 |
| Renewable Natural Gas | 0 | 0 | 0 | 0 | 17 | 34 | 0 | 0 | 0 | 35 | 66 |
| Total | 447 | 476 | 436 | 421 | 431 | 408 | 498 | 388 | 322 | 381 | 303 |
Commercial Sector
Commercial fuels energy demand 2015-2035: Outlooks B, C, D, E, F
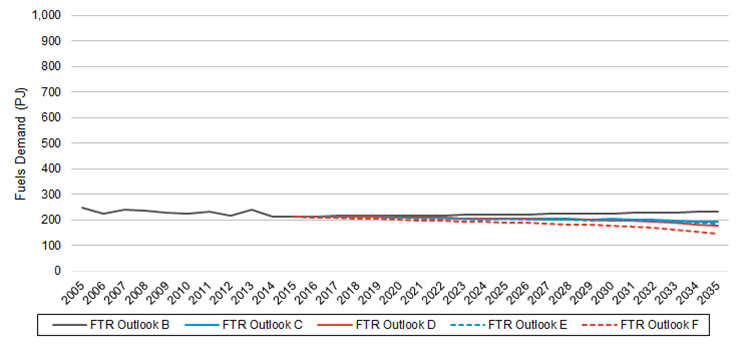
View the data used to create the above graph.
Note: Historical data used to calibrate the CanESS model are obtained from Statistics Canada and NRCan. Actual values in most cases are available only until 2013, meaning that 2015 values reported here are estimated, and outlook-specific, hence why they differ very slightly across outlooks.
Commercial Sector Overview
The principal factor that could drive an increase in commercial fuels demand in Outlook B is the forecast growth in commercial floor-space in the province.
Factors that could decrease commercial fuels demand include:
*Note: Incremental improvement modeled in Outlooks E and F corresponds to incremental achievable DSM potential identified in the OEB’s 2016 Natural Gas Conservation Potential study for the semi-constrained and unconstrained (respectively) achievable potential scenarios, after accounting for the erosion of DSM potential due to electrification.
In Outlook E and F, a substantial proportion of fuels energy shifts from fossil sources (e.g. natural gas) to renewable ones (e.g. renewable natural gas). This shift affects GHG emissions, but does not materially affect total fuels energy use.
Forecast Change in Commercial Fuels Demand by Fuel Type 2015 - 2035
| Fuel Type | Outlook B | Outlook C | Outlook D | Outlook E | Outlook F |
|---|---|---|---|---|---|
| Fuel Oil | -0.52231 | -1.893323 | -1.893112 | -1.893775 | -1.893775 |
| Natural Gas | 12.926748 | -11.78443 | -26.836802 | -36.46701773 | -97.2035026 |
| Propane | 5.884329 | -9.274061 | -9.270041 | -9.47629 | -10.5098 |
| Renewable Natural Gas | 0 | 0 | 0 | 19.59672173 | 42.0246946 |
Commercial Demand by Fuel Type (PJ), 2015, 2025, 2035: Outlooks B, C, D, E, F
| Fuels Demand (PJ) | 2015 - All Outlooks | 2025 B | 2025 C | 2025 D | 2025 E | 2025 F | 2035 B | 2035 C | 2035 D | 2035 E | 2035 F |
|---|---|---|---|---|---|---|---|---|---|---|---|
| Fuel Oil | 2 | 1 | 0 | 0 | 0 | 0 | 1 | 0 | 0 | 0 | 0 |
| Natural Gas | 200 | 203 | 203 | 203 | 192 | 170 | 213 | 188 | 173 | 163 | 103 |
| Propane | 13 | 16 | 3 | 3 | 3 | 3 | 19 | 4 | 4 | 4 | 3 |
| Renewable Natural Gas | 0 | 0 | 0 | 0 | 9 | 19 | 0 | 0 | 0 | 20 | 42 |
| Total | 215 | 221 | 206 | 206 | 204 | 192 | 233 | 192 | 177 | 187 | 147 |
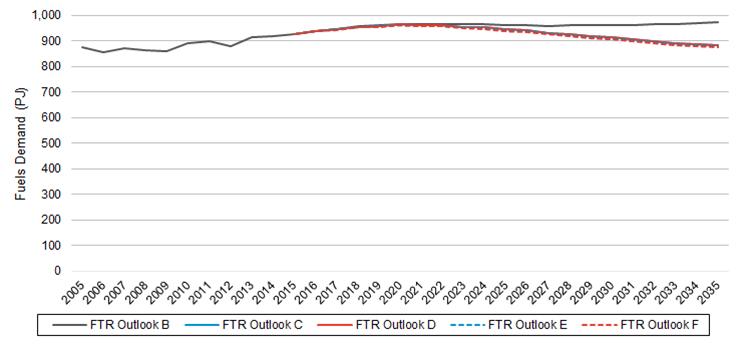
Industrial Sector
Industrial fuels energy demand 2015-2035: Outlooks B, C, D, E, F
View the data used to create the above graph.
Note: Historical data used to calibrate the CanESS model are obtained from Statistics Canada and NRCan. Actual values in most cases are available only until 2013, meaning that 2015 values reported here are estimated, and outlook-specific, hence why they differ very slightly across outlooks.
Industrial Sector Overview
Factors that could increase industrial fuels demand beyond what is examined by the five outlooks include shifts in macroeconomic trends and provincial industrial economic activity.
Factors that could decrease industrial fuels demand include:
- Electrification of industrial processes
- Incremental natural gas equipment efficiency improvements*
*Note: Incremental improvement modeled in Outlooks E and F corresponds to incremental achievable DSM potential identified in the Ontario Energy Board’s 2016 Natural Gas Conservation Potential study for the semi-constrained and unconstrained (respectively) achievable potential scenarios, after accounting for the erosion of DSM potential due to electrification.
In Outlooks E and F, a substantial proportion of fuels energy shifts from conventional fossil sources (e.g. natural gas) to renewable ones (e.g. renewable natural gas). This shift affects GHG emissions, but does not materially affect total fuels energy use.
Forecast Change in Industrial Fuels Demand by Fuel Type 2015 - 2035
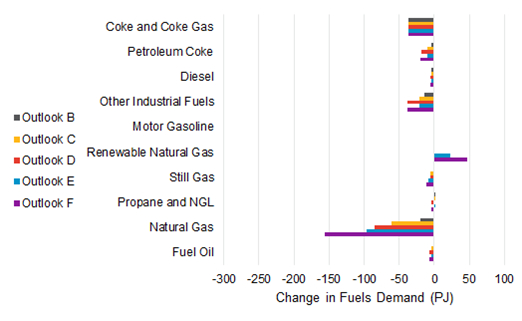
| Fuel Type | Outlook B | Outlook C | Outlook D | Outlook E | Outlook F |
|---|---|---|---|---|---|
| Fuel Oil | -1.145392 | -4.678724 | -6.89279 | -4.717946 | -6.972032 |
| Natural Gas | -20.153817 | -60.597367 | -85.142829 | -96.31163895 | -156.6602944 |
| Propane and NGL | 1.469263 | 0.234404 | -3.940629 | 0.182987 | -4.044493 |
| Still Gas | -0.097916 | -5.452858 | -5.525296 | -8.273366 | -11.22319 |
| Renewable Natural Gas | 0 | 0 | 0 | 22.94206895 | 47.5158864 |
| Motor Gasoline | -0.035576 | -0.035576 | -0.035576 | -0.035576 | -0.035576 |
| Other Industrial Fuels | -14.403211 | -20.963328 | -38.105009 | -20.963328 | -38.105009 |
| Diesel | -3.482213 | -4.548976 | -4.863073 | -4.548976 | -4.863073 |
| Petroleum Coke | -3.975449 | -9.467097 | -18.615552 | -9.843251 | -19.375445 |
| Coke and Coke Gas | -37.100314 | -37.100314 | -37.100314 | -37.100314 | -37.100314 |
Industrial Demand by Fuel Type (PJ), 2015, 2025, 2035: Outlooks B, C, D, E, F
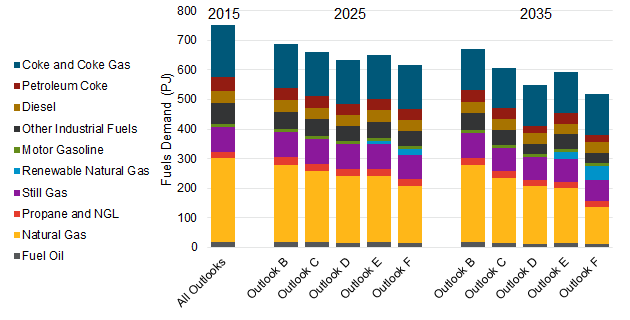
Note: does not include industrial non-energy fuels demand
| Fuels Demand (PJ) | 2015 - All Outlooks | 2025 B | 2025 C | 2025 D | 2025 E | 2025 F | 2035 B | 2035 C | 2035 D | 2035 E | 2035 F |
|---|---|---|---|---|---|---|---|---|---|---|---|
| Fuel Oil | 20 | 19 | 18 | 16 | 17 | 16 | 19 | 15 | 13 | 15 | 13 |
| Natural Gas | 281 | 260 | 241 | 224 | 224 | 190 | 260 | 220 | 195 | 184 | 124 |
| Propane and NGL | 23 | 25 | 25 | 24 | 25 | 24 | 24 | 23 | 19 | 23 | 19 |
| Still Gas | 85 | 85 | 84 | 84 | 83 | 81 | 85 | 79 | 79 | 77 | 74 |
| Renewable Natural Gas | 0 | 0 | 0 | 0 | 11 | 20 | 0 | 0 | 0 | 23 | 48 |
| Motor Gasoline | 10 | 10 | 10 | 10 | 10 | 10 | 10 | 10 | 10 | 10 | 10 |
| Other Industrial Fuels | 71 | 59 | 56 | 53 | 56 | 53 | 57 | 50 | 33 | 50 | 33 |
| Diesel | 40 | 38 | 38 | 37 | 38 | 37 | 37 | 36 | 36 | 36 | 36 |
| Petroleum Coke | 45 | 42 | 40 | 38 | 40 | 37 | 41 | 36 | 27 | 35 | 26 |
| Coke and Coke Gas | 175 | 147 | 147 | 147 | 147 | 147 | 138 | 138 | 138 | 138 | 138 |
| Total | 750 | 686 | 659 | 633 | 650 | 616 | 671 | 607 | 550 | 591 | 519 |
Note: does not include industrial non-energy fuels demand
Industrial non-energy fuels demand
In addition to energy and combustion-related demand, a substantial amount of fuels product is used in non-energy processes as a raw material feedstock.
Industrial non-energy fuels demand is not modeled in the outlooks and is not included in the preceding energy demand charts and tables.
Transportation Sector
Transportation fuels energy demand 2015-2035: Outlooks B, C, D, E, F
View the data used to create the above graph.
Note: Historical data used to calibrate the CanESS model are obtained from Statistics Canada and NRCan. Actual values in most cases are available only until 2013, meaning that 2015 values reported here are estimated, and outlook-specific, hence why they differ very slightly across outlooks.
Transportation Sector Overview
Factors that could increase transportation fuels demand include:
- The forecast increase in the number of households, and associated additional vehicle kilometres travelled.
- The extension of the current upward trend in freight and air travel fuels use in Ontario.
Factors that could decrease transportation fuels demand include:
- Electrification of transportation as a result of increasing numbers of EVs and the use of electrified public transit;
- Fuel economy standards (e.g., Corporate Average Fuel Consumption); and
- The shift to fuels used in vehicles with higher levels of combustion efficiency (e.g., hydrogen personal vehicles, LNG freight).
In Outlooks E and F, a substantial proportion of fuels energy shifts from conventional fossil sources (e.g., gasoline and diesel) to alternative fossil fuels that emit less carbon (e.g., LNG or propane) or to renewable fuels (e.g., ethanol, bio-based diesels). This shift affects GHG emissions, but has little effect on total fuels energy use.
Forecast Change in Transportation Fuels Demand by Fuel Type 2015 - 2035
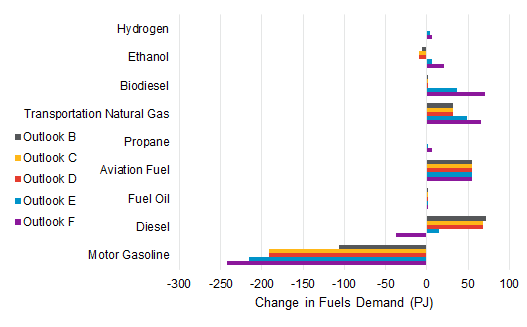
| Fuel Type | Outlook B | Outlook C | Outlook D | Outlook E | Outlook F |
|---|---|---|---|---|---|
| Motor Gasoline | -105.946623 | -190.670013 | -190.670013 | -215.772122 | -242.068407 |
| Diesel | 72.042311 | 68.341991 | 68.341991 | 15.370315 | -37.26023 |
| Fuel Oil | 1.460883 | 1.460883 | 1.460883 | 1.460883 | 1.460883 |
| Aviation Fuel | 54.260564 | 54.260564 | 54.260564 | 54.260564 | 54.260564 |
| Propane | -1.074836941 | -1.078018941 | -1.078018941 | 1.731634059 | 5.924291059 |
| Transportation Natural Gas | 31.568246 | 31.568156 | 31.568156 | 48.827676 | 65.793344 |
| Biodiesel | 1.535587 | 1.449841 | 1.449841 | 36.275449 | 71.109529 |
| Ethanol | -5.721265463 | -9.257124463 | -9.257124463 | 5.948045537 | 21.13693354 |
| Hydrogen | 0 | 0 | 0 | 3.450892 | 6.908804 |
Transportation Demand by Fuel Type (PJ), 2015, 2025, 2035: Outlooks B, C, D, E, F
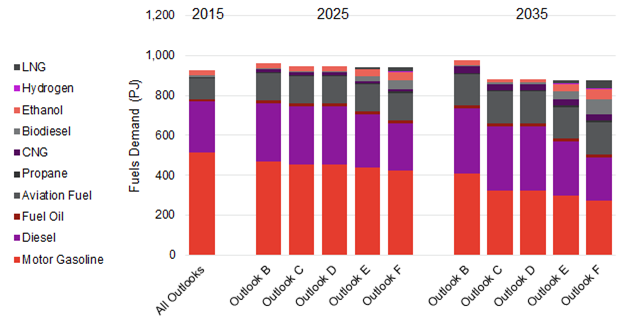
| Fuels Demand (PJ) | 2015 - All Outlooks | 2025 B | 2025 C | 2025 D | 2025 E | 2025 F | 2035 B | 2035 C | 2035 D | 2035 E | 2035 F |
|---|---|---|---|---|---|---|---|---|---|---|---|
| Motor Gasoline | 514 | 467 | 451 | 451 | 437 | 422 | 408 | 323 | 323 | 298 | 272 |
| Diesel | 254 | 295 | 295 | 295 | 266 | 238 | 326 | 322 | 322 | 269 | 217 |
| Fuel Oil | 14 | 16 | 16 | 16 | 16 | 16 | 16 | 16 | 16 | 16 | 16 |
| Aviation Fuel | 105 | 134 | 134 | 134 | 134 | 134 | 159 | 159 | 159 | 159 | 159 |
| Propane | 5 | 5 | 5 | 5 | 6 | 9 | 4 | 4 | 4 | 7 | 11 |
| Transportation Natural Gas | 2 | 13 | 13 | 13 | 23 | 33 | 33 | 33 | 33 | 50 | 67 |
| Biodiesel | 5 | 6 | 6 | 6 | 25 | 43 | 7 | 7 | 7 | 42 | 77 |
| Ethanol | 28 | 25 | 25 | 25 | 32 | 40 | 22 | 19 | 19 | 34 | 49 |
| Hydrogen | 0 | 0 | 0 | 0 | 2 | 4 | 0 | 0 | 0 | 3 | 7 |
| Total | 927 | 961 | 945 | 945 | 942 | 939 | 975 | 883 | 883 | 878 | 874 |