2017 Energy Consumption and Greenhouse Gas (GHG) Emission Report
Learn about our progress meeting energy conservation targets and reducing greenhouse-gas emissions.
Executive summary
This report explains the progress of the Ontario Government’s commitment to reducing greenhouse gas (GHG) emissions. It documents GHG emissions associated with the Ontario Ministry of Infrastructure’s (MOI) building portfolio, managed by Infrastructure Ontario (IO), Alternative Financing and Procurement (AFP) facilities, and facilities operated by five Custodial Ministries. Data in this report covers the 2016 calendar year (CY). Since last year’s CY2015 GHG emissions report the MOI portfolio has decreased its overall GHG emissions, over the 2006 baseline, from 44% to 48%. While enterprise-wide (MOI-managed, MOI-Alternative Financing and Procurement, and Custodial) facilities also achieved further reductions moving from 32% to 37%. Currently government-owned facilities are surpassing their 2020 target of a 27% reduction in GHG emissions by the end of 2020.
MOI reports GHG emissions annually according to the Ontario Facilities Energy Reporting Directive (2013), and the GHG Protocol Corporate Accounting and Reporting Standard (2015). Because of the nature of government facilities, elements of the GHG protocol were adapted into an internal methodology (see section 9) for applicability to the MOI portfolio. In 2015 a verification of Infrastructure Ontario’s carbon accounting practices was performed by a certified ISO 14065 third party organization to assure that reductions in the MOI portfolio were real, while also providing invaluable feedback for improvements, so as to stay on track for future GHG targets.
Key drivers for reductions since 2006 have been energy conservation measures taken across government buildings, and the closing of the last coal-fired generators in Ontario in 2014, drastically reducing the electricity emission factor (EF). A lower confirmed emission factor for CY2015 also contributed to year-over-year reductions. This year’s analysis showed that since 2006, energy consumption reductions accounted for 40% of emissions reductions, while a reduced electricity emission factor accounted for 60% of emissions reductions. To continue to move the emissions profile of government facilities downward in order to maintain the 2020 target and reach the 2030 target will require a greater focus on reducing natural gas consumption, through a reduced portfolio size, greater thermal efficiencies, and investment in new technologies and operational expertise.
Introduction
The Ontario Ministry of Infrastructure (MOI) is responsible for maintaining the safety and sustainability of provincially-owned buildings and structures, which are managed on behalf of MOI by Infrastructure Ontario (IO), a crown agency. Buildings contributed 86 Mt CO2e, 12% of Canada’s GHG emissions in 2015 according to the NIR, and accounted for 19% of Ontario’s GHG emissions in 2013 (Climate Change Action Plan, 2016). Reducing energy consumption has been a significant concern in the provincial real estate portfolio for a number of years (see chart 1). In 2003, following the Northeast electricity blackout, the Ministry of Infrastructure enacted a mandate to reduce overall electricity consumption in government-owned and -operated buildings, and set an electricity reduction target of 20% by 2012 (over a 2002 base year). Infrastructure Ontario (IO) was directed by MOI to implement building related electricity reduction initiatives in order to achieve the target, which was accomplished in 2012 at 21.17%. Moving forward, MOI has given IO direction to implement an energy reduction target encompassing all fuel types (electricity, natural gas, propane, fuel oil, chilled water, steam). The new target is a 2% reduction year-over-year for all fuel types.
Go Green: Ontario’s Action Plan on Climate Change (2007), set targets over a 1990 base year to reduce Ontario’s greenhouse gas (GHG) emissions by 6% by 2014, 15% by 2020 and 80% by 2050 (see chart 1). MOI committed to a building related emissions reduction of 27% by the end of 2020 and a 50% reduction by 2030 (over a 2006 base year). vs. targets were prorated to a 2006 base year, due to significant barriers in accessing utility data before that time, and thus they are set for higher reductions over a shorter period of time. MOI’s portfolio of provincially-owned buildings surpassed at 33%, a previous target of 19% reductions by 2014 (see chart 1).
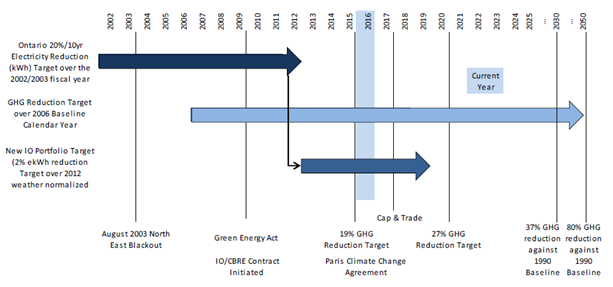
Chart 1 — IO Managed Portfolio Energy Management Target Milestones
In 2014 Ontario met its GHG milestone target and is currently focused on achieving its next milestone, the 2020 target. Ontario strengthened its commitment to combating climate change and cutting greenhouse gases in 2015 by announcing its intention to join the cap and trade system under the Western Climate Initiative and by becoming the first province in Canada to set a mid-term greenhouse gas pollution target for 2030 at 37% below 1990 levels. In 2016, Ontario’s Climate Change Action Plan announced a new target for government to reduce its emissions by 50% below 2006 levels by 2030.
This 2017 Energy Consumption and Greenhouse Gas Emission Report provides an Enterprise-wide summary of GHG emissions from Target Class Facilities over a 2006 baseline for the reporting years 2015 and 2016. Enterprise-wide Target Class Facilities include MOI/IO-managed facilities, AFP facilities managed by private service providers, as well as facilities managed by Custodial Ministries including: Ministry of Transportation (MTO), Ministry of Natural Resources and Forestry (MNRF), Ministry of Education (EDU), Ministry of Children and Youth Services (MCYS) and Ministry of Community Safety and Correctional Services (MCSCS). GHG emissions inventory data for 2015 was finalized in spring 2017 with the release of the confirmed emission factors in Canada’s National Inventory Report (NIR), by Environment and Climate Change Canada. There is a 2 two-year lag in getting confirmed emission factors and thus finalizing GHG emissions for IO-managed facilities.
The progress made since committing to emission reduction targets has been positive. Energy reduction programs have reduced emissions through a variety of initiatives including major building retrofits, retro-commissioning and implementation of design guidelines/standards. Potential barriers to meeting future GHG targets include factors such as energy funding shortfalls, nuclear fleet refurbishments necessitating increased natural gas generation, slow renewable generation uptake, increased instances of extreme weather, and the ongoing introduction of AFP buildings that represent net new increases in government GHG emissions. IO-managed facilities are heading in the right direction, but only due to continuous efforts in the areas of energy efficiency and conservation. With aging buildings, investment in new technologies and operational expertise will improve the chances of hitting those emission targets in the future.
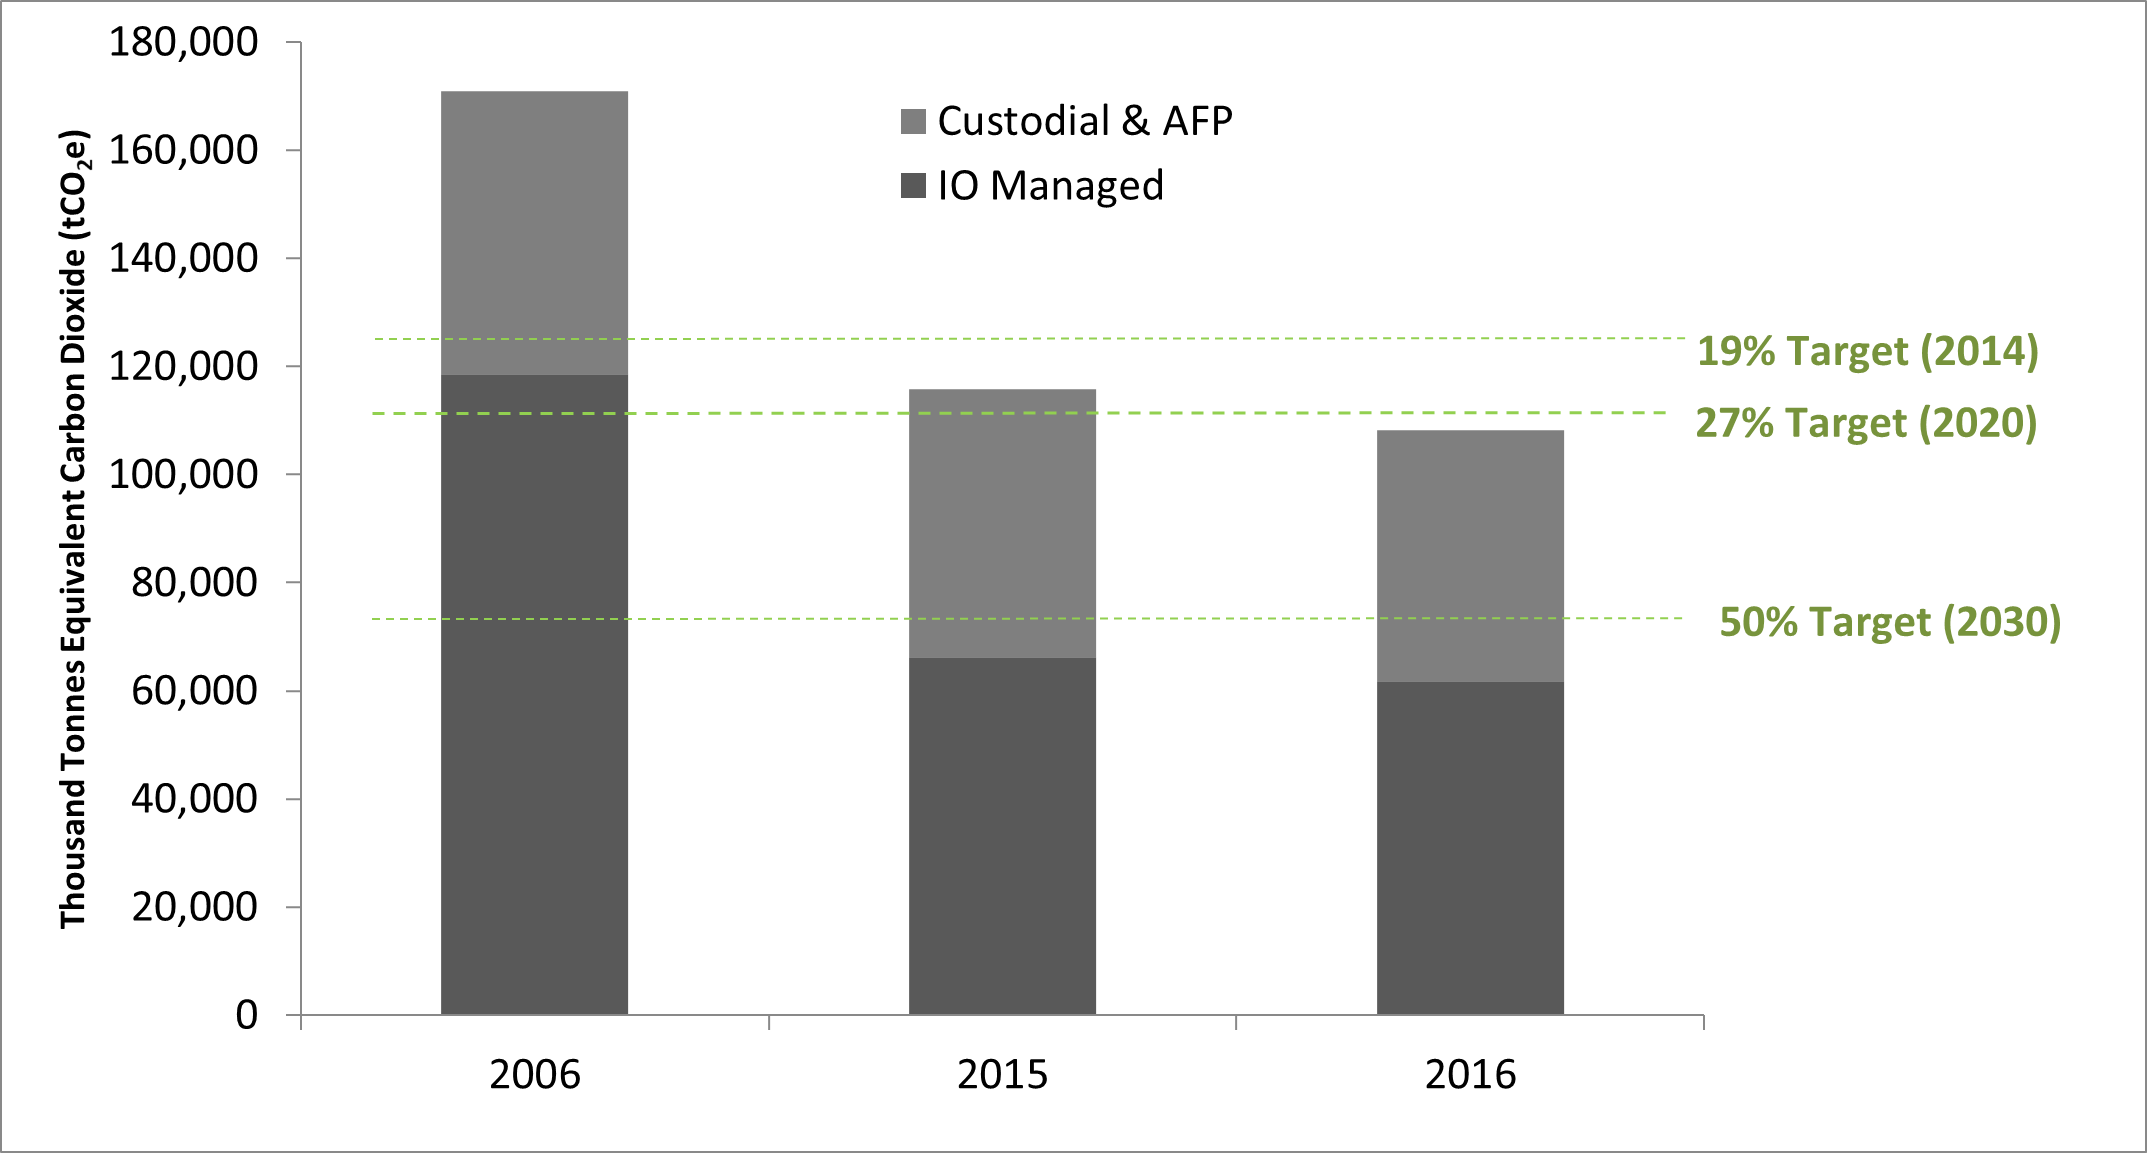
Graph 1 — Greenhouse gas emissions from IO-managed, AFP and custodial facilities compared to Government reduction targets (tCO2e)
Reporting requirements
Following the Green Energy Act, 2009 (GEA), Ontario ministries are required to report on greenhouse gas emissions, energy, and water to the Ministry of Infrastructure and prepare annual energy and water consumption and greenhouse gas emissions reports for government-owned facilities.
In 2009, the Green Energy Act established that the construction, acquisition, operation and management of government facilities be guided by the efficient use and conservation of energy and water. The GEA also called for clear and transparent reporting of GHG emissions from government facilities, and empowered the Minister of Infrastructure, with the approval of the Lieutenant Governor in Council to issue directives in order to implement energy, GHG, and water related initiatives.
This annual report follows the Ontario Facilities Energy Reporting Directive (2013), herein referred to as the Directive, which mandates that all Custodial Ministries (those with day-to-day operational control of government facilities) submit an annual energy consumption and greenhouse gas emissions report to the Minister of Infrastructure for subsequent public posting on ministry websites. Report content includes, but is not limited to, building-level consumption data across energy types (electricity, natural gas, purchased steam, propane, heating oil, diesel fuels; and if applicable, municipally supplied water), GHG emissions by building and progress against targets as well as previous reports, and an overview of energy conservation programs and progress. The Green Facilities Procedural Manual (draft 2012) provides a further implementation framework for energy reporting by providing details on matters such as energy consumption metering and monitoring, units of measurement for various utility types, determining energy intensity, updating emissions factors, and report timing, posting and formatting.
Energy consumption reporting is the responsibility of the ministry that has operational control (management of day-to-day operations) of the facility. MOI, through Infrastructure Ontario (IO), is responsible for reporting on all facilities where IO has full operational control of the facility. Although each ministry is responsible for its own plan, MOI has the responsibility to report on all government owned facilities regardless of whether or not they operate within IO’s control. Ministry buildings that do not fall under the day-to-day operational purview of MOI/IO are defined as a Custodial Ministry, while AFP buildings which are government-owned, but operated by private service providers represent a third accounting category within this report.
The reporting Directive requires that for Target Class Facilities (explained in section 10.6) ministries produce a five-year conservation strategy that is updated annually and with each annual report offer a summary on progress made. Infrastructure Ontario, under the Directive is responsible for reporting on enterprise-wide — that is, both Custodial Ministry and MOI facilities — energy and water consumption.
The objective of the IO energy plan is to:
- report on progress and strategies to meet and exceed Ontario Public Service (OPS) GHG reduction targets across the MOI-owned portfolio
- report on the achievement of GHG emission reduction targets: 19% reduction by end of 2014 over 2006 baseline
- 19% reduction by end of 2014 over 2006 baseline (completed)
- 27% reduction by end of 2020 over 2006 baseline (pending)
- 50% reduction by the end of 2030 over 2006 baseline (as stated in the 2016 Climate Change Action Plan)
Following the building energy, GHG and water reporting requirements outlined in the Ontario Facilities Energy Reporting Directive, this report is broken into two key sections:
- The 5-Year Energy Plan reporting on target buildings and initiatives progress for Ministry of Infrastructure (MOI) buildings
- The Enterprise Wide GHG Summary which includes the MOI managed portfolio as well as custodial ministries. Custodial ministries have buildings that are managed by the ministry directly and fall outside of the scope of MOI management
Reporting scope
The GHG emissions reporting period is from 01/01/2016 to 12/31/2016 (inclusive). The GEA and the Directive call for reporting of GHG emissions associated with government owned facilities. Currently, based on the guidance found in the Ontario Facilities Energy Reporting Directive (2013) and the GHG Protocol Corporate Accounting and Reporting Standard (2004). Government reports on scope 1 and 2 emissions for assets it wholly owns (see section 9.1 organizational boundaries).
The report accounts for the following fuel types and emission scopes. Scope 1 emissions can be explained as fuel burned directly on-site (example: the operation of a boiler). Scope 2 emissions can be explained as a delivered fuel type where the energy was generated off-site and delivered to the building (example: electricity generated by a mixture of fuel types and delivered to the building).
| Scope 1 | Scope 2 | ||
|---|---|---|---|
| Natural gas | 63.4% | Electricity | 14.6% |
| Fuel oil | 1.0% | District chilled water | 0.02% |
| Propane | 1.0% | District steam | 19.8% |
| District hot water | 0.1% | ||
Table 1 — Emissions by scope for IO-managed facilities
Exclusions
Within government owned facilities government has identified a subset called Target Class facilities that are the focus of its GHG emissions accounting (see section 9.1 for a description of Target Class facilities). Target Class facilities make-up the majority of MOI’s building portfolio at roughly 90% of overall gross square footage owned. Leased assets are treated as scope 3 emissions, as the Directive does not apply to facilities leased by government from third party owners. The GHG Protocol states that the building owner retains GHG reporting responsibility, if they retain the financial risks and rewards associated with the operation of that facility.
The inventory excludes scope 3 GHG emissions as they are not outlined within the Directive. The inventory currently excludes the GHG emissions associated with backup diesel generation due to current deficiencies and inconsistencies in the data collection process. IO continues to develop a data collection process for future monitoring of this GHG emission source for future GHG reports.
The inventory currently does not include Scope 1 fugitive emissions, mainly from the unintentional release of gases from equipment leaks such as refrigerant in refrigeration and air conditioning equipment and CO2 emissions from fire suppressing equipment. IO is developing a data collection process for future monitoring of these GHG emission sources.
Ministry of Infrastructure portfolio overview
The IO-managed portfolio is spread throughout the province and includes approximately 44 million square feet of buildings and structures, including approximately 30 million square feet of owned facilities, 10 million square feet which are leased from third parties, and 3.7 million square feet that are Alternative Finance and Procurement (AFP) facilities. This report includes emissions data for 415 IO-managed facilities representing approximately 18 million square feet. These are designated as Target Class Facilities and are buildings where MOI has a level of control that allows energy conservation measures (ECMs) to be implemented. Graph 2 provides an overview of the reported portfolio.
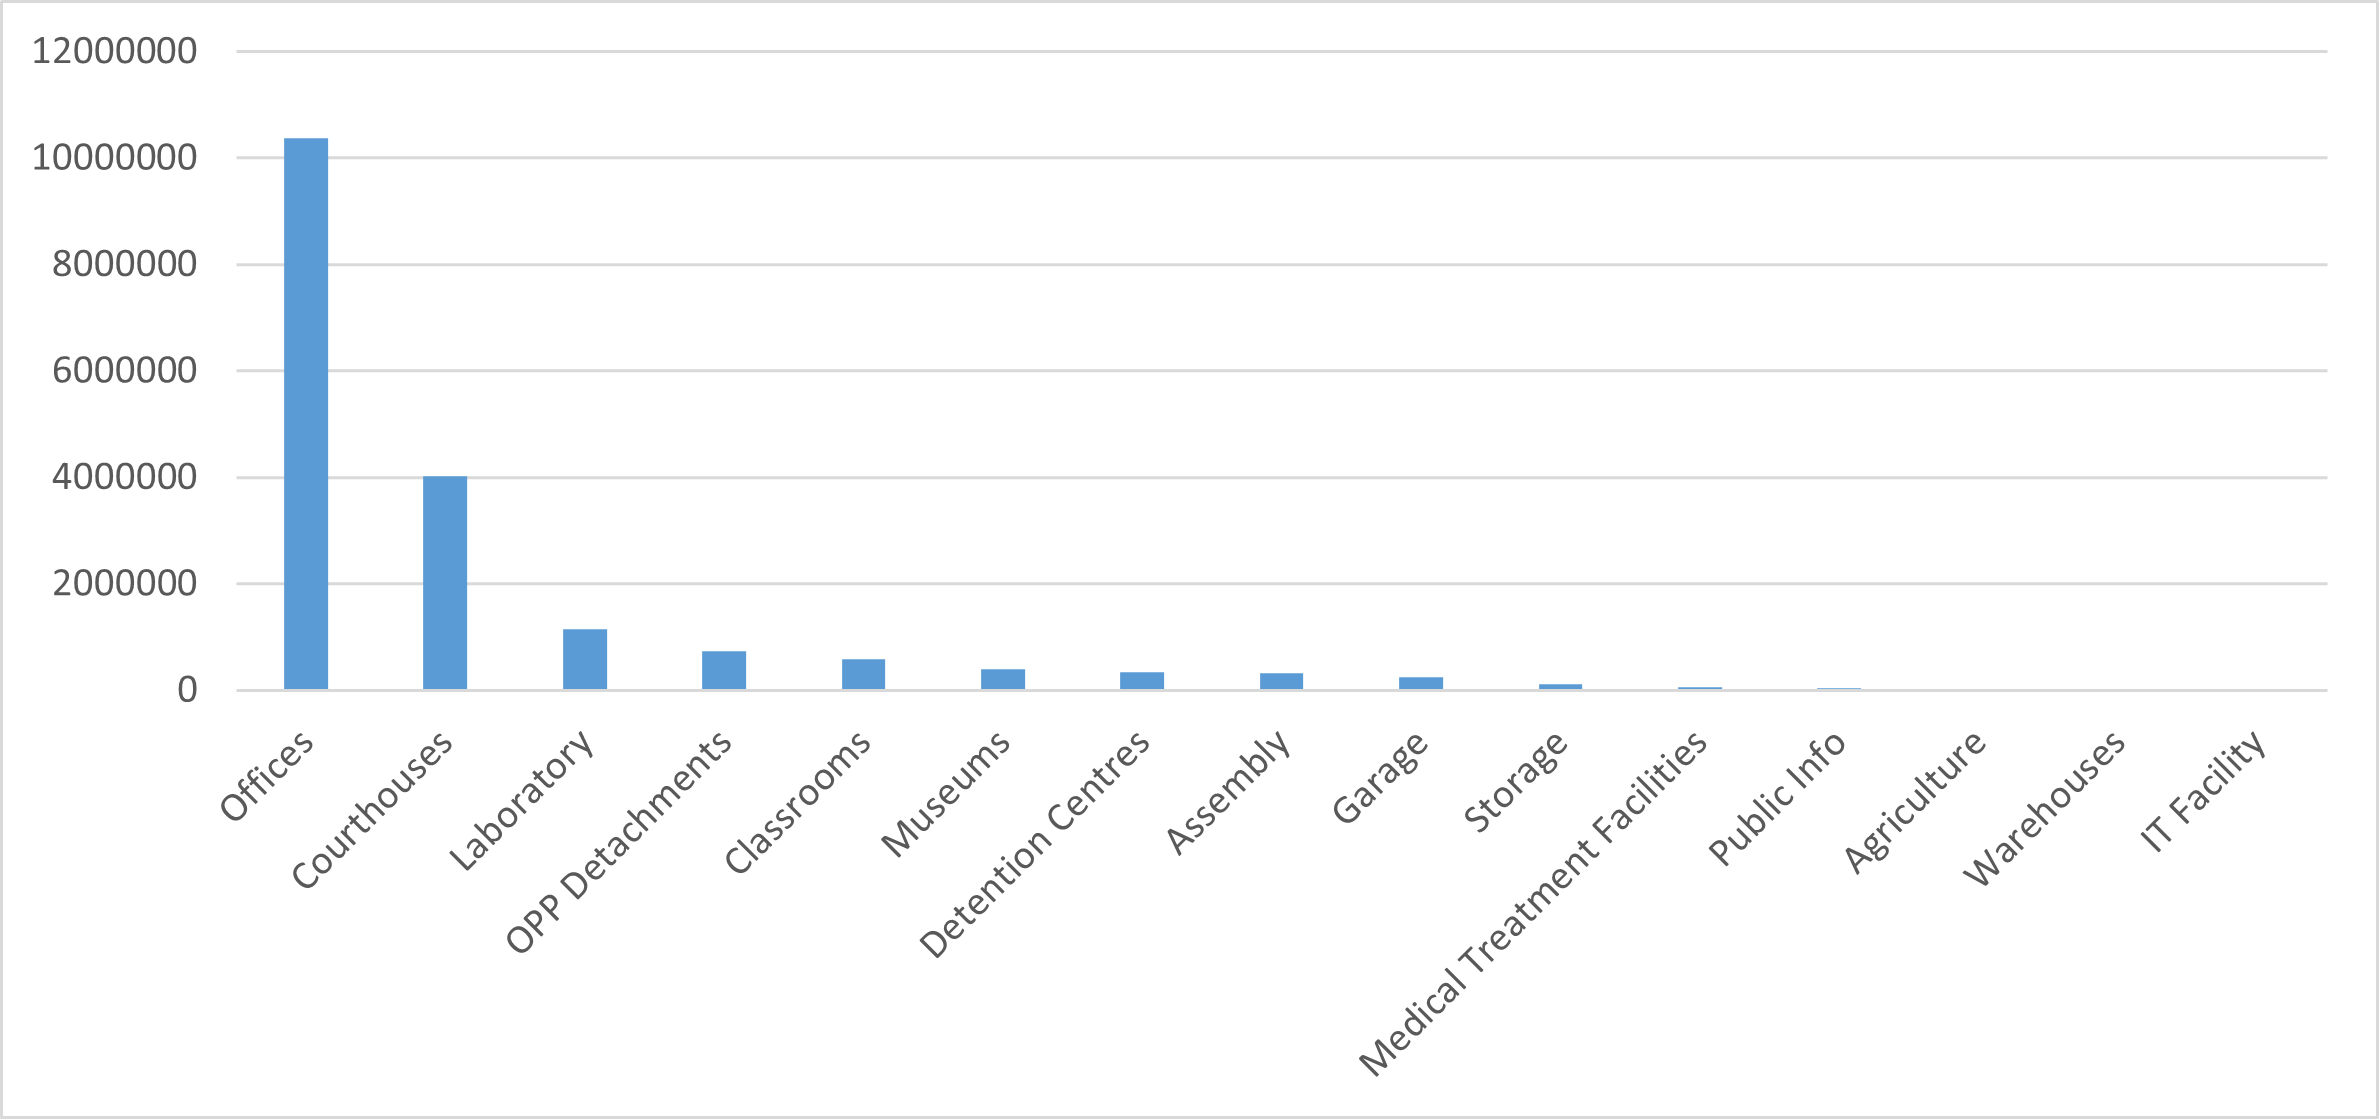
Graph 2 — Gross square feet from IO-managed portfolio (GSF) for 2016
Over 65% of the assets in IO’s portfolio are between 40 and 60 years old (Source: 2017 GREP Inventory). These assets require significant capital investment in order to adequately maintain operations. In addition, these assets are more likely to be high energy users, with aging structures and equipment, employing outdated materials, methods and technologies. Many of IO’s older buildings are important for heritage and cultural reasons, adding additional layers of complexity to their management.
Energy performance
The impacts of MOI’s building energy reduction program from 2002–2012 are still being seen, with a steady decrease in electricity consumption since 2006. As of 2016, electricity consumption in IO-managed Target Class buildings has been decreased by 90 million ekWh or 28% since 2006. Meanwhile natural gas consumption has remained relatively static. Static natural gas consumption can be attributed to MOI’s building portfolio existing in a northern climate where heating degree days far outweigh cooling degree days (generally by a factor of ten), to boilers having reached combustion efficiencies of 85–95% already by the end of the 1900s, and to fewer cost-effective like-replacements being available for heating technologies. These factors leave building envelopes, which require major retrofits to overhaul, as the main area for improvements in heating demand. However, in MOI’s building portfolio — where 65% of buildings are between 40 and 60 years old and were built in an era of energy intensity — changes to building envelopes are not only very costly, but very disruptive to government activities and services.
In the last three years, cooling degree days trended sharply upwards, and heating degree days trended down slightly. While between MOI’s GHG base year 2006, and 2016, we have seen an increase in cooling degree days of 48% and an increase in heating degree days of 2%. These heating and cooling profiles are indicative of the more extreme weather being experienced under climate change.
| 2006 | 2015 | 2016 | 2006 vs. 2015 | 2006 vs. 2016 | 2015 vs. 2016 | |
|---|---|---|---|---|---|---|
| Electricity | 316,017,019 | 231,196,090 | 226,087,857 | (26.84%) | (28.46%) | (2.21%) |
| Natural gas | 218,120,019 | 223,578,990 | 217,403,148 | 2.5% | (0.33%) | (2.76%) |
| Fuel oil | 3,158,433 | 2,834,647 | 2,400,149 | (10.25%) | (24.01%) | (15.33%) |
| District chilled water | 0 | 776,445 | 830,843 | N/A | N/A | 7.01% |
| Propane | 3,061,507 | 3,000,760 | 2,846,674 | (1.98%) | (7.02%) | (5.13%) |
| District steam | 68,300,283 | 58,283,016 | 48,285,862 | (14.67%) | (29.3%) | (17.15%) |
| District hot water | 296,501 | 382,647 | 308,577 | N/A | 4.07% | (19.36%) |
| Total | 608,953,762 | 520,052,595 | 498,163,110 | (14.6%) | (18.19%) | (4.21%) |
Table 2 — IO-managed buildings energy consumption from 2006, 2015 and 2016 (ekWh)
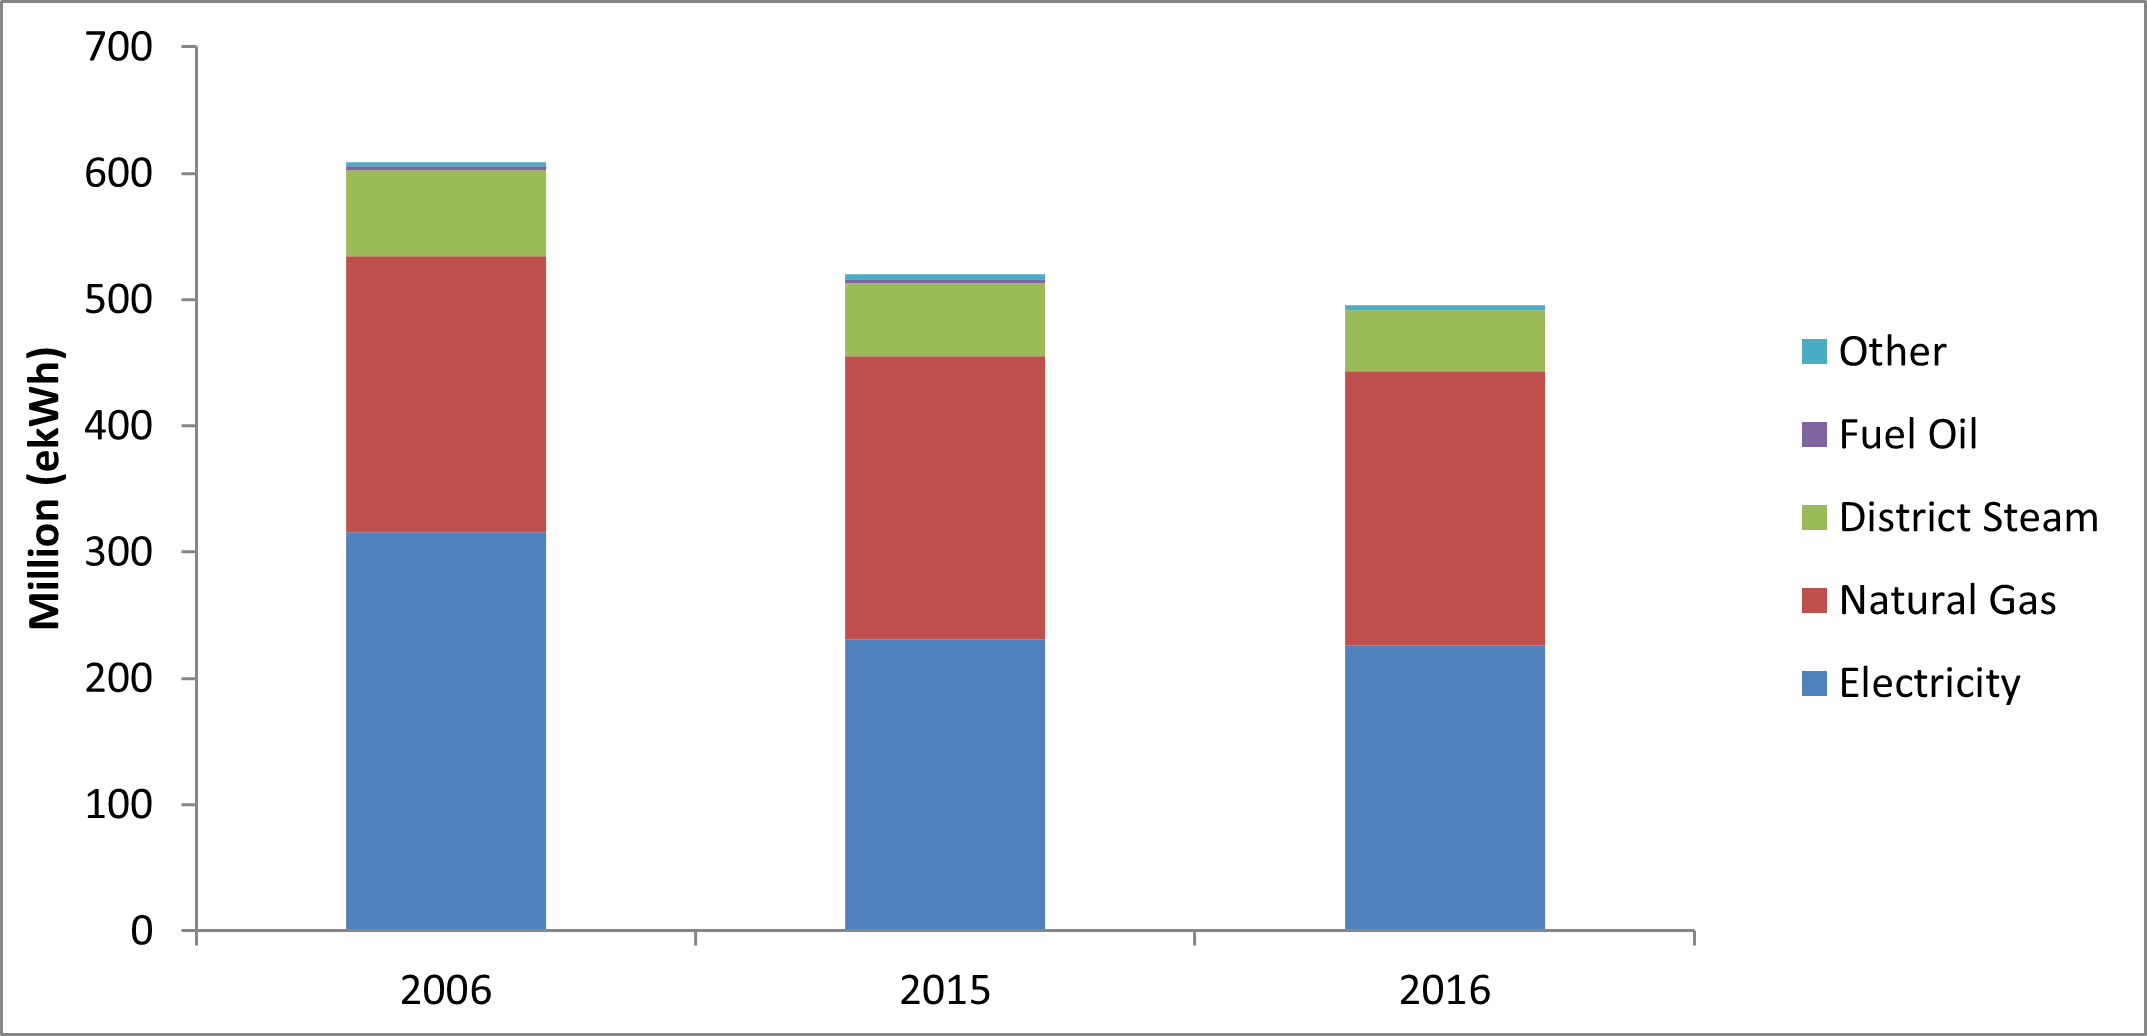
Graph 3 — IO-managed buildings energy profile for 2006, 2015 and 2016 (million ekWh)
Emissions performance
The MOI-owned real estate portfolio, managed by Infrastructure Ontario (IO), makes up the majority of the targeted provincial government GHG emissions; and as such, assumes a significant responsibility in achieving the targeted reductions. For CY2016, there was a 48% reduction in GHG emissions compared to the base year in 2006. Nearly half of CY2016 reductions, compared to CY2015, are due to a significant reduction in steam consumption at the Queens Park Complex, while the remainder of year-over-year emissions reductions are being attributed to a few demolitions, vacancy due to disposal, and other changes in occupancy or use.
CY2016 saw a significant reduction in district steam consumption (1,859.5 tCO2e), nearly as much of a reduction in one year as since the base year. District steam is used to heat the Queens Park Complex. As they are some of the largest and most energy intensive buildings in the MOI portfolio, this year’s reduction made a significant contribution to overall GHG reductions, accounting for nearly half of the IO-managed Target Class building reduction of 4,062.1 tCO2e in CY2016. This reduced steam consumption is primarily attributable to a steam trap replacement/repair and operational efficiency measures around air handling, as well as less heating required between September and December due to warmer than seasonal average temperatures.
Fossil fuels (district steam, natural gas, fuel oil and propane) are the main heating sources for the portfolio and fluctuate heavily depending on winter weather severity. This dependency on fossil fuels for heating has not declined since the 2006 base year (see graph 4). This makes the IO-managed portfolio particularly vulnerable to sharp GHG emission increases depending on the severity of winter weather.
Due to the electricity emission factor going down by 79%, while the natural gas emission factor has remained the same the relative drivers of the IO-managed portfolio’s GHG emissions have changed considerably since 2006. When comparing CY2016 with the base year in 2006, emissions attributed to electricity use in the IO-managed portfolio have gone from 52% to 15%, while emissions contributed from the use of natural gas have gone from 33% to 65%. To reach GHG targets going forward there will need to be a greater focus on reducing natural gas consumption within the portfolio’s buildings through measures such as improvements to building envelopes, and investment in more efficient technologies and operations.
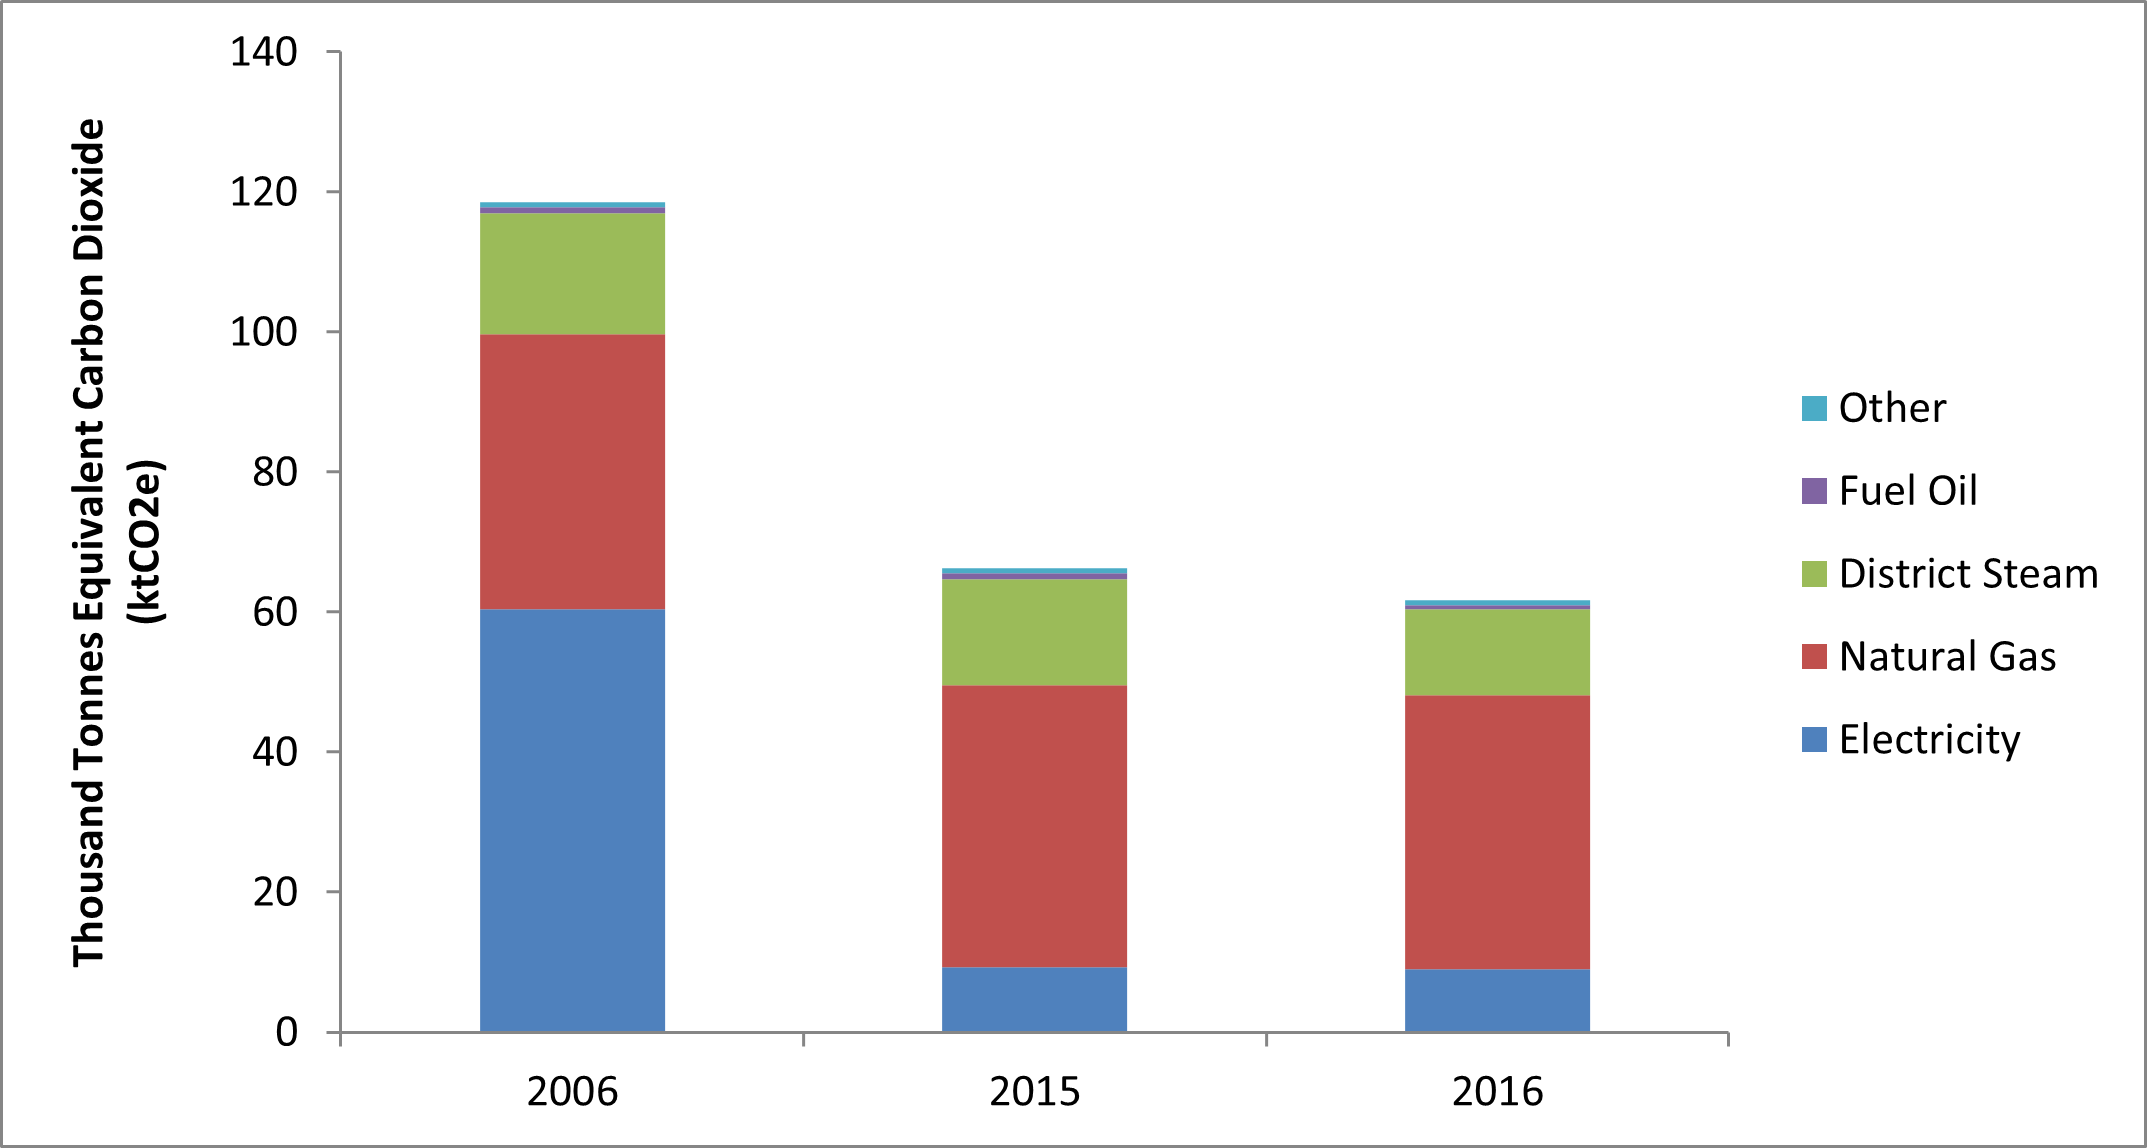
Graph 4 — IO-managed buildings Greenhouse gas emissions in 2006, 2015 and 2016 by fuel type (tCO2e)
Other fuels include: district chilled water, district hot water and propane.
| 2006 | 2015 | 2016 | 2006 vs. 2016 | 2006 vs. 2015 | 2015 vs. 2016 | |
|---|---|---|---|---|---|---|
| Electricity (scope 2) | 60,403 | 9,248 | 9,021 | (85.07%) | (84.69%) | (2.45%) |
| Natural gas (scope 1) | 39,269 | 40,252 | 39,140 | (0.33%) | 2.5% | (2.76%) |
| Fuel oil (scope 1) | 813 | 729 | 617 | (24.01%) | (10.25%) | (15.33%) |
| District chilled water (scope 2) | 0 | 11 | 10 | N/A | N/A | (5.29%) |
| Propane (scope 1) | 641 | 629 | 596 | (7.02%) | (1.98%) | (5.13%) |
| District steam (scope 2) | 17,316 | 15,273 | 12,242 | (29.3%) | (11.8%) | (19.85%) |
| District hot water (scope 2) | 67 | 86 | 69 | 4.07% | N/A | (19.36%) |
| Total | 118,508 | 66,227* | 61,695 | (47.94%) | (44.12%) | (6.84%) |
Table 3 — IO-managed buildings Greenhouse gas emissions in 2006, 2015 and 2016 by energy type (tCO2e)
* Previously reported data (i.e. CY2015) is reviewed and retroactively corrected based on reporting improvements and confirmed NIR emissions factors, so data reported for the previous year will reflect these updates.
Water performance
CY2016 is the fourth year that water is being reported. Although no targets have been set for water, the Province continues to gather and analyze data in anticipation of a water reduction program. Currently across Ontario municipalities there are a variety of billing methods and fee allocations being used to charge for water and water related services. This variability makes it more difficult to track water usage and plan for cost-effective water conservation actions when managing a portfolio of buildings across different jurisdictions.
| 2006 | 2015 | 2016 | |
|---|---|---|---|
| Assembly | 19.0 | 11.9 | 13.6 |
| Classrooms | 10.6 | 9.6 | 10.6 |
| Courthouse | 6.1 | 4.7 | 4.6 |
| Detachment | 14.9 | 10.0 | 10.6 |
| Detention | 5.4 | 4.8 | 3.8 |
| Garage-vehicle | 8.2 | 5.6 | 5.3 |
| IT facility | 0.0 | 3.2 | 5.9 |
| Laboratory | 15.8 | 21.9 | 19.6 |
| Museum | 14.9 | 1.5 | 1.6 |
| Office A | 8.5 | 5.4 | 5.9 |
| Office B | 7.5 | 4.0 | 4.3 |
| Office C | 9.5 | 3.9 | 3.8 |
| Public info | 83.3 | 27.7 | 31.7 |
| Storage A | 0.8 | 2.6 | 2.4 |
| Warehouse | 0.0 | 7.3 | 3.9 |
| Grand total | 8.9 | 6.4 | 6.5 |
Table 4 — IO-managed water consumption per gross square feet from 2006, 2015 and 2016 (100 m3/GSF)
Updated water datasets by building type are outlined in table 4. Water is tracked on an intensity basis that is more indicative of performance than absolute values would be. Like electricity, water consumption over time fluctuates significantly depending on the occupancy of the buildings. Overall water consumption in the IO-managed portfolio has trended downward since 2006, while between 2015 and 2016 it remained relatively static. Larger reductions since the 2006 baseline seen in offices and public info sites are partially attributable to properties exiting the portfolio causing a reduction in gross square footage (GSF). Year over year increases seen at IT facilities, public info sites, and assembly halls are attributable to increases in use or occupancy.
Ministry of Infrastructure energy programs and initiatives
IO Energy Team is responsible for building energy management and has developed a comprehensive strategy, including several programs and initiatives that link together to form a high performing and integrated energy management approach. The programs and initiatives outlined in this section do not (although they can) operate as singular entities, but work together to achieve greater energy conservation. Chart 2 outlines how this process works and shows how each of the components support one another.
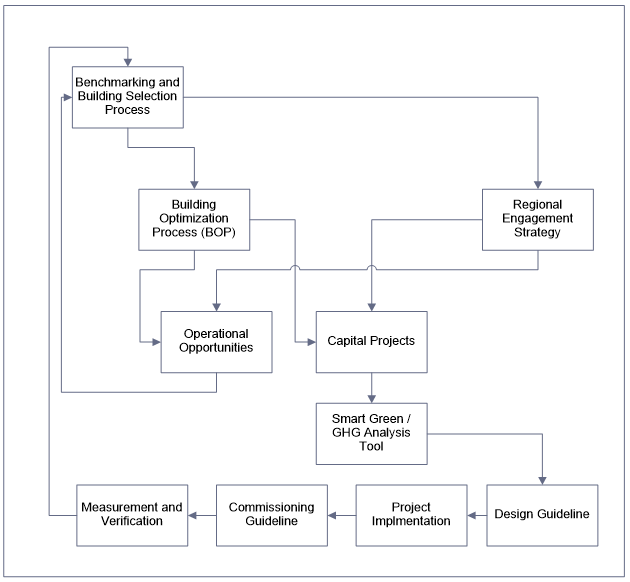
Chart 2 — IO energy strategy workflow
Benchmarking
Internal benchmarking
Infrastructure Ontario, in collaboration with their service provider CBRE, has developed a robust internal benchmarking program, with a data visualization interface that can compare and map groups of buildings based on their energy performance and building type. The program was developed in-house and draws on the expertise of both the IO and CBRE energy teams. The program is weather normalized and tracks building performance, while identifying and prioritizing those that need further improvement. It is updated quarterly with consumption data and used by CBRE staff, particularly Regional Energy Managers for ongoing building energy management. The results of benchmarking are brought forward to facility managers as part of the Regional Engagement Strategy (section 8.3) and further investigation is assigned. Investigations often result in operational changes or proposals for capital projects.
External benchmarking
In 2013, Natural Resources Canada (NRCan) released the Energy Star Portfolio Manager (ESPM) for Canada. In support of this program IO uploaded three years’ worth of energy data for over 10 million square feet of office space at 174 buildings. The energy dataset for these buildings is now updated for 2012 through to 2016. Currently IO’s internal benchmarking program is used as a primary benchmarking resource, but ESPM is often used as a secondary perspective that can in some cases provide additional support in prioritizing candidates for IO's Building Optimization process.
Building Optimization Process
The Building Optimization Process (BOP) documents the process developed to help Infrastructure Ontario improve energy and water performance for buildings owned and managed by the Ontario Government. This helps service providers and IO identify improvement measures and projects. Working together, this process improves the performance of the buildings, and continues IO’s recognized leadership in high-performance building operations. This process applies to all Infrastructure Ontario-managed (MOI owned) buildings and covers all building sizes and types. Buildings are selected through a site-by-site review process analyzing energy, project, and occupancy data among many other factors. A list of scheduled buildings for BOP implementation are selected and presented to IO on an annual basis. Starting 2017/18 fiscal year, IO has dedicated a Key Performance Indicator (KPI) for tracing the progress of the BOP program, IO locations selected will be audited throughout the year and results will be reviewed for final approval. The KPI will track the energy audits and go beyond to review the recommendations implemented out of the reviews.
Regional engagement strategy
Engagement of regional facilities staff is crucial to understanding what is actually happening at the building level. Longstanding quarterly meetings have been held for the purpose of discussing policy and long-term strategy, between regional facility managers, service providers, and the IO Energy Team. Additionally, monthly meetings are now held between energy managers and building operators to discuss equipment and operational savings. By including staff that are actually working in the buildings, it opens up the opportunity to discuss what is actually happening inside each facility. Facilities staff are encouraged to have their voices heard and are given the opportunity to put forth ideas on best energy management practices for their buildings. Through these discussions program opportunities such as BOP are identified, which result in operational or capital building improvements.
Capital projects
Capital projects are run through the Capital Repair Program (CRP). This program develops projects to ensure health and safety, code compliance and imminent equipment breakdown. Historically energy projects were run through a separate funding stream which ran in parallel with the CRP. Due to funding restraints in 2014/15, energy-specific funding was put on hold. Every CRP project is an opportunity to improve the performance of IO’s-managed portfolio, applying the IO Design and Commissioning Guidelines to all CRP projects captures these opportunities and participates in the enhancement of IO-managed portfolio. Starting 2017/18 fiscal year, IO applied more precise technical reviews for all technical CRP projects. The IO/CBRE technical teams review all design phases of the projects, participate in substantial completion meetings and the review of the change orders.
Smart Green Portfolio Strategy
The Smart Green Portfolio Strategy is a high performance building automation strategy being implemented one site at a time throughout the portfolio. The Strategy utilizes advanced automation and integration to measure, monitor, and control operations and maintenance at the lowest cost and environmental impact during day-to-day building operations. The strategy involves integrating relevant building systems including, but not limited to, HVAC and Lighting control and when possible integrate the security, elevators, fire protection, and life safety systems in order to improve performance and to reduce energy consumption in a facility. Smart Green also includes the infrastructure required for centralized remote monitoring of building systems. The combination of integrated automation with centralized monitoring allows for all relevant building system information to be available to a supervisor for:
- alarm and event management
- troubleshooting
- dispatch for service or repair
- historical record keeping
- utility metering including sub-metering for individual tenants
Design Guidelines
The purpose of IO Building Systems Design Guidelines is to standardize design and construction objectives and technical requirements across the full portfolio of IO-managed buildings to ensure higher performing buildings are designed and constructed in accordance with the Smart Green Portfolio strategy. IO Project Managers and service providers use the guideline to ensure consistency and unity of IO-managed sites and to integrate all relevant IO guidelines and systems, in order to achieve increased occupant comfort and satisfaction, improved operational performance, improved energy efficiency, and the provision of technologies and tools to efficiently monitor, control and manage building systems. New versions of IO design guidelines were released in May 2017. New versions are more advanced, addresses issues previously faced on building projects and reflects an enhanced process.
Commissioning Guideline
The intent of the Commissioning Guideline is to ensure:
- building equipment performs as specified and originally intended as per IO Design Guidelines
- installation of equipment meets contract specification
- the commissioning of building systems/equipment and sequence of operations have been verified to on-site conditions
- the total performance/integration of new equipment/systems are fully commissioned
A new version of the IO Commissioning Guideline was released in 2017 with process enhancements to better suit the IO portfolio of projects.
Measurement and Verification
Measurement and Verification (M&V) plays a key role in quantifying savings from energy conservation projects. In the 2015/16 fiscal year, IO performed M&V on a variety of projects and undertook a refocusing and revision of the M&V program. The program has become more refined and has been integrated into the Design Guidelines as a requirement. Results from the M&V program will be used to help better inform operational decisions and future capital projects. This program is currently expanding in scope to do further oversight of set projects within the Greater Toronto Area.
GHG asset management planning tool
IO is moving towards achieving a Carbon Neutral Real Estate Portfolio and is working to meet interim GHG emission reduction targets over the 2006 baseline of 27% by 2020, 50% by 2030 and 80% by 2050. Without the provision of dedicated program funding in support of these targets, IO continues to employ the following strategies in support of target achievement:
- reduce energy demand within the portfolio
- improve on-site energy efficiency
- implement low-carbon and carbon neutral energy sources for government buildings
Current successes in energy savings at government facilities and subsequent GHG emissions reductions are due to a variety of IO initiatives including:
- major building retrofits
- retro-commissioning
- implementation of the Building Optimization Process (BOP)
- Smart Green Portfolio Strategy to achieve high performance buildings
- implementation of design and commissioning guidelines/standards
- Measurement and Verification practices
- energy benchmarking
The GHG emissions over the life cycle of building systems and components can be separated into the life cycle emissions from the development and assembly of building systems and components, and the life cycle emissions from the operation of building systems and components.
IO has developed a GHG project identification and approval process which reviews the operational life cycle carbon emissions of building systems and components. This approval process was developed specifically to support Greenhouse Gas reduction project applications.
The tool that informed the portfolio GHG analysis reviewed the capital \costs, GHG reduction potential, and operational cost benefits of systems that are planned for replacement in the next 10 years, across the MOI-owned building portfolio.
The overall analysis results show that the top 150 projects would require a capital investment of $150M over the next decade, and would save a total of over 16,000 tonnes annually in building-related GHG emissions, while offering a return on investment through the future utility and repairs savings. The GHG savings from these equipment upgrades and replacements with low-carbon alternatives would be enough to achieve the 2030 reduction target.
Challenges, risks and opportunities
Energy program funding
Drawing on lessons learned from the last three years of no funding, the IO Central Operations team will continue to maximize operational opportunities and utilize alternate funding sources to ensure continued energy savings. The IO energy management program has been in a no-funding scenario in recent years. During this time the IO energy team looked to stabilize and maintain past successes, so as not to let a lack of funding erode past achievements. Although there is now a process to implement energy projects through alternate funding streams this funding is restrictive. IO is now playing catch-up in order to get ahead of risks outside their control.
2020 target uncertainty
The province achieved its 2014 GHG emissions target with a 33% reduction compared to the 2006 baseline (target was 19%) for Enterprise-wide GHG emissions. This was achieved by implementing energy efficiency equipment, energy management strategies, and through the dramatic cleaning of the Ontario electricity grid with the shutting down of the last coal plants in 2014. The 2020 target is a 27% reduction compared to the 2006 baseline. There are several factors that will influence whether that target is met, mainly any significant increases in the electricity grid emission factor due to the increased use of natural gas-fired power plants during the nuclear refurbishment process, slow uptake of energy and GHG-saving technology into the portfolio, the risk of increased fossil fuel use for heating due to severe winter weather, and the net new emissions from AFP buildings being added to the portfolio.
Electricity generation mix
Currently Ontario is relying on nuclear electricity generation at about 61% of its base load with the remainder made up of large-scale hydro and natural gas and some renewables (IESO, 2017). Nuclear, along with hydro, generation are essentially emissions neutral electricity sources, whereas natural gas has associated emissions due to burning of fuel. From an emissions perspective the province is benefitting from the phase out of coal and nuclear base load generation, and as a result is experiencing the lowest electricity emission factor in over 25 years.
Ontario saw significant changes in its electricity generation in October 2016 as Darlington Nuclear Generating Station was taken offline for refurbishment, and the Ontario and Quebec governments signed an electricity agreement that will bring more clean hydro-powered electricity to Ontario’s grid. Ontario began the 10-year process of refurbishing the Darlington Nuclear Generating Station in October 2016, which supplies approximately 20% of the province’s electricity. Last year’s report assumed that natural gas-fired generation would be used as a swing resource to cover losses due to nuclear fleet refurbishments, leading to a more GHG intensive electricity grid. News releases on the historic electricity agreement between Ontario and Quebec, cite the trade of clean electricity and the reduction of GHG as key outcomes of the deal, in which Hydro-Québec promises fixed volumes of 2 TWh for a period of 7 years between 2017 and 2023 to Ontario’s Independent Electricity System Operator (IESO). However with 2 TWh representing only 1.3% of Ontario’s annual electricity demand and the suspension of all renewable energy procurement programs in Ontario by December 2017, the shutdown of Darlington will still create a significant gap to fill in Ontario’s electricity generation. Energy conservation programs as well as the option that comes with the new agreement to store surplus energy on Quebec’s grid, can help to offset gas-fired power in Ontario, but the GHG intensity of future Ontario electricity grid emission factors remains in play.
Energy management program
New buildings
Ontario’s infrastructure is constantly being renewed and as new facilities are being built they are added to the province’s GHG emissions accounting. As per the GHG Protocol, base year emissions are not recalculated for new facilities that did not exist in the base year. Thus each of these new builds is accounted for with a value of zero in the base year and their energy and emissions are reported annually following their date of construction. For example, a courthouse built in 2012 would not show any savings as the 2006 baseline would be zero. So although new builds are built to the highest LEED standards and utilize the most modern energy management practices, the GHG reduction target is negatively impacted as each new build is net new added energy and emissions. New buildings are listed in this report as IO-AFP.
Enterprise wide summary
Enterprise-wide GHG emissions for CY2016 were 37% below the 2006 baseline emissions. Key drivers for emission reductions since 2006 include the electricity emission factor, marketplace improvements in the energy performance of building components, along with ongoing building-level energy conservation measures. The closing of coal-fired generators in Ontario drastically reduced Ontario’s electricity emission factor (EF) by as much as 79% in 2016 over the 2006 base year.
Marketplace improvements in like-for-like end-of-life equipment replacements provide an ongoing contribution to emissions reductions, as do energy conservation measures taken across government buildings. The 2015 electricity emission factor released in the National Inventory Report by the Federal Government, also contributed to enterprise-wide reductions as it was finalized at 40 gCO2e/kWh, rather than 45.5 gCO2e/kWh as was first estimated for CY2015 and published in last year’s 2016 report.
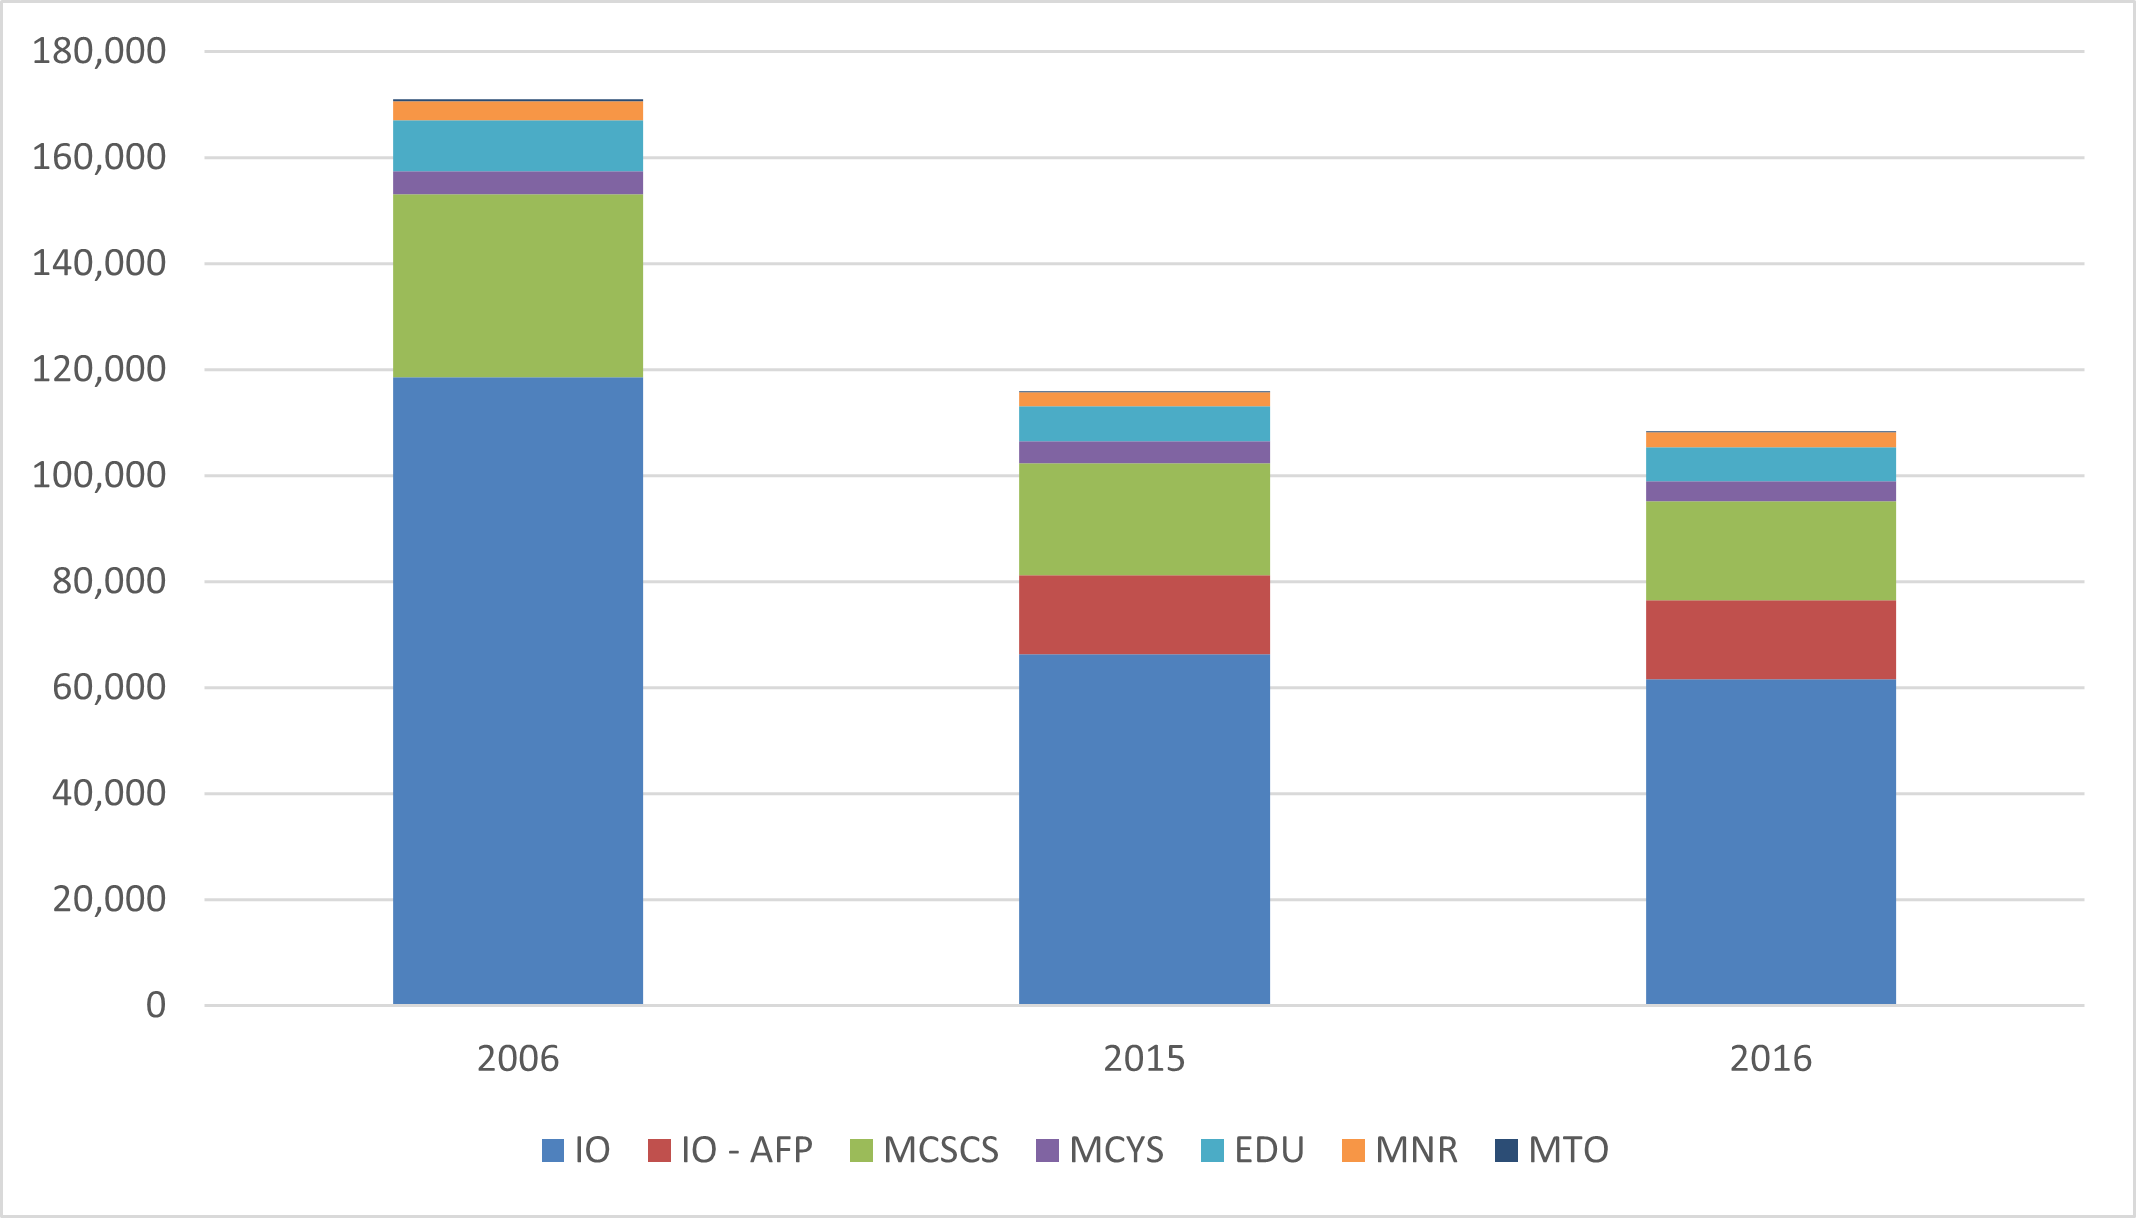
Graph 5 — Enterprise-wide GHG emissions by emitters from 2006, 2015 and 2016 (tCO2e)
Scope 1 emissions from direct fossil fuel combustion is the most significant source of GHGs enterprise-wide. These are emissions due to heating needs, mainly from the combustion of natural gas, fuel oil and propane. Scope 2 emissions are from the purchase of energy generated offsite, mainly from: electricity and district energy sources (steam, hot water and chilled water).
| 2006 | 2015 | 2016 | 2006 vs. 2015 | 2006 vs. 2016 | 2015 vs. 2016 | |
|---|---|---|---|---|---|---|
| IO | 118,508 | 66,227 | 61,695 | (44%) | (48%) | (7%) |
| IO-AFP | 0 | 14,954 | 14,849 | N/A | N/A | (1%) |
| MCSCS | 34,524 | 21,249 | 18,676 | (38%) | (46%) | (12%) |
| MCYS | 4,452 | 3,981 | 3,795 | (11%) | (15%) | (5%) |
| EDU | 9,486 | 6,652 | 6,404 | (30%) | (32%) | (4%) |
| MNRF | 3,770 | 2,602 | 2,758 | (31%) | (27%) | 6% |
| MTO | 255 | 111 | 96 | (56%) | (62%) | (14%) |
| Total | 170,994 | 111,777 | 108,274 | (32%) | (37%) | (6%) |
Table 6 — Enterprise-wide GHG emissions for 2016, compared to 2006 baseline and 2015 (tCO2e)
Roles and responsibilities
Infrastructure Ontario
IO manages the majority of the province’s portfolio on behalf of MOI. IO is a crown agency that oversees the day-to-day operations of the real-estate portfolio and implements ministry policies for buildings, lands, and leases.
IO has three separate GHG reporting responsibilities:
- Reporting emissions publicly for MOI-owned facilities building by building, this includes: IO managed and, Alternative Financing and Procurement (AFP)
- Reporting on OPS and Enterprise-wide summary status
- A 5-year energy conservation strategy
Infrastructure Ontario — Alternative Financing Procurement (AFP)
The AFP model brings together private and public sector expertise in a unique structure that transfers the risk of project cost increases and scheduling delays, typically associated with traditional project delivery.
AFP sites are required to report their GHG emissions; however IO does not have direct operational control of the facilities (managed by private service providers). As a result, reporting is presented in a separate line item to track IO’s AFP sector progress.
Custodial ministries
Custodial ministries have day-to-day operational control over their own facilities. For the CY2016, these ministries include:
- Ministry of Transportation (MTO)
- Ministry of Education (EDU)
- Ministry of Child and Youth Services (MCYS)
- Ministry of Community Safety and Correctional Services (MCSCS)
- The Ministry of Natural Resources and Forestry (MNRF)
Custodial Ministries have two primary responsibilities:
- Reporting emissions publicly for facilities managed on a day-to-day basis and,
- A 5-year energy conservation strategy (for each Custodial ministry)
Methodology
IO follows the direction from the Ontario Facilities Energy Reporting Directive (2013), which outlines the Target and Non-target Facilities required for reporting, and the sources for emission factors. IO follows the Greenhouse Gas (GHG) Protocol for the GHG emission calculation method. The GHG Protocol was developed by World Resources Institute (WRI) and World Business Council on Sustainable Development (WBCSD). The GHG Protocol is the most commonly used GHG accounting tool for government and business leaders to quantify, and manage greenhouse gas emissions. IO follows this accounting standard as a guideline in its reporting of the enterprise GHG emissions but sets the Directive as its primary guide.
For the CY2016 reporting year, the following emission factors sources are used:
- Federal Government NIR 2017 (CY2015 grid electricity and fossil fuels)
- Ontario MOE (CY2016 preliminary grid electricity emission factor)
- Enwave (for district steam and chilled water- all years)
- IO internal calculation (for district hot water based on NIR natural gas values — all years)
- Ontario Government (all ekWh conversion factors)
As previously mentioned, the major driver of emissions savings in the last several years is a result of the phase out of coal-fired electricity generation. The electricity grid emission factor in Ontario in 2006 was 191 gCO2e/kWh and has decreased to 39.9 gCO2e/kWh in the 2016 year (preliminary estimation by the MOE). Going forward into the 2020 reporting year it is not expected that there will be EF increases or decreases due to the coal power-plant phase out. Although there is some stabilization of the grid emissions factor there are variables such as the nuclear refurbishment program, importation of low emission-electricity from Quebec and inclement weather events that could impact progress negatively. It is estimated that outside variables could raise the electricity grid emission factor as much as 20%, putting the 2020 target at risk.
In accordance with the latest Federal government's National Inventory Report (NIR) (2017), the 100-year Global Warming Potential (GWP) values are applied in this GHG report, based on the second commitment period (2013–2020) from the Kyoto Protocol.
In-line with the principle of continuous improvement, the underlying data and methodology for estimating emissions are revised over time; hence, total emissions in all years are subject to change as both data and methods are improved. Improvements include:
- Applying more up-to-date and accurate emission factors retroactively to previous years’ data. The Canadian Federal Government releases its NIR annually, with a two-year lag of data. These figures are seen as the most accurate. This inventory thus updated the CY2015 data to apply the latest NIR emission factors for fuel and grid electricity for Ontario. Since the NIR does not provide CY2016 emission factors, the Ontario Ministry of Energy provides a preliminary value in the meantime. Next year's GHG report will update the CY2016 data to include the NIR's official value at that time.
- Updating utility data (energy and water) based on delayed invoicing. Due to the nature of utility billing, there are sometimes delays in receiving the energy/water data in time for the GHG Inventory release. A small amount of data is thus estimated, but is corrected later in the year. Small differences from the previous year's report data could change due to this correction.
Organizational boundary
An equity approach for the GHG emission inventory is used for all government-owned facilities. All of the real estate portfolio is owned by the Province of Ontario and the Ministry of Infrastructure (MOI) manages the bulk of the portfolio through Infrastructure Ontario, while Custodial Ministries and AFP service providers manage the remainder. This is reflected in IO’s GHG accounting methodology that follows MOI’s Directive in that GHG emissions from all government owned facilities are accounted for, while the responsibility to track, report upon, and implement the 5-year energy conservation strategy for each facility rests with the ministry that has day-to-day operational control over that facility.
Within these upper level organizational boundaries, different accounting and reporting requirements apply to two separate classes of government-owned facilities: Target Class Facilities and Non-Target Class Facilities.
Target Class Facilities are a subset of all government-owned facilities that have been identified as having energy conservation potential that does not adversely affect operations. For MOI they represent about 90% of the overall portfolio’s GSF, and for the majority of Custodial Ministries all their buildings are considered Target Class (see table 7). Target Class facilities energy and water consumption must be tracked at the building level within each facility and reported to both MOI and the public as a requirement of the Directive.
Non-Target Class Facilities are facilities where MOI does not have direct operational control or it may be difficult to conserve energy due to safety considerations or programmatic impacts and constraints. Energy and water consumption associated with these facilities/buildings are not required to be reported.
Leased Facilities are not subject to the Directive and thus facilities leased by government from third parties are not within the boundary of this inventory. Further Government does not have ownership or financial control of leased facilities, and thus emissions associated with their fuel combustion and purchased electricity are categorized as scope 3.
| Custodial Target Class Facilities | Custodial Non-Target Class Facilities | |
|---|---|---|
| MTO | Truck inspection stations | Patrol yards, remote airports, street lights |
| MNR | Parks | Fish hatcheries, ranger camps, forward fire stations |
| EDU | Provincial schools | All facilities included |
| MCSCS | Adult detention centres | All facilities included |
| MCYS | Youth detention centres | All facilities included |
Table 7 – Target and non-target facilities for reporting as directed by the Ontario Government
The following facilities are included in this report:
- MCSCS: 30 facilities
- MCYS: 12 facilities
- EDU: 78 facilities
- MNRF: 75 parks
- MTO: 34 sites
- IO-AFP: 26 sites. IO does not have operational control of these buildings, but maintains a responsibility to report on them. AFP hospitals are not required to report their emissions, and only fully operational AFP facilities are being reported upon. AFP sites register zero consumption for the 2006 base year and will only add to the Enterprise-wide emission inventories as more sites are added (regardless of their level of energy efficiency).
- IO-Managed: 415 sites
The sources of GHG emissions from the portfolio includes:
| Scope 1 | Scope 2 |
|---|---|
| Production of heat from boilers, steam and electricity on-site from the combustion of: fuel oil, natural gas and propane | Purchased electricity, district hot water, district chilled water and district steam |
Table 8 — Sources of GHG emissions from the Inventory CY2016
The Ontario Government uses a fixed target Base Year — which is 2006. The Ontario Government has set GHG reduction targets, using an “absolute” emissions over time. The baseline emissions are as follows:
| Total (tCO2e) | MOI-managed | MOI-AFP | MCYS | MCSCS | MTO | EDU | MNR | |
|---|---|---|---|---|---|---|---|---|
| Total | 170,994 | 118,508 | 0 | 4,452 | 34,524 | 255 | 9,486 | 3,770 |
Table 9 — GHG emissions Enterprise-wide for the base year 2006 (tCO2e)
The AFP portfolio are new buildings whose GHG emissions are not included in the base year.
Datasets
2017 Energy Consumption and Greenhouse Gas (GHG) Emission Report
Learn more about accessing data using different formats.