2025–26 First Quarter Finances
The First Quarter Finances report contains information about Ontario’s 2025–26 fiscal outlook, primarily as of June 30, 2025.
Highlights
- Ontario's real gross domestic product (GDP) increased by 0.6 per cent in the first calendar quarter of 2025, matching growth in the previous quarter. Real GDP growth in the first quarter was supported by higher exports and household spending.
- Private-sector expectations for real GDP growth are unchanged for 2025 since the 2025 Budget. Uncertainty related to U.S. trade policy continues to impact the global economic outlook and presents downside risk to the Ontario economy.
- As of the 2025–26 First Quarter Finances, the province’s 2025–26 deficit is projected to be $14.6 billion, consistent with the outlook published in the 2025 Budget.
- Total revenues and expenses in the 2025–26 First Quarter Finances are projected to be $219.9 billion and $232.5 billion, respectively, unchanged from the outlook in the 2025 Budget.
Introduction
Ontario’s economy proved to be resilient in 2024 and continued to grow in early 2025. However, there are significant downside risks to the economic outlook. Uncertainty related to U.S. trade policy continues to impact the global economy. Ontario’s significant trading relationship with the United States presents elevated risks and uncertainty, which is expected to weigh on consumer spending and business investment decisions over the near term.
The 2025 Budget outlined a plan to protect Ontario’s workers, businesses and communities from U.S. tariffs and the economic uncertainty, while maintaining a prudent and responsible approach to public finances. The government’s plan will continue to protect Ontario by fostering the most competitive economy in the G7, and promoting investment, job creation and business growth, while retaining a path to budget balance by 2027–28.
Ontario’s finances are in the strongest position they have been in over a decade, with all four major credit rating agencies—Moody’s, Fitch, Morningstar DBRS and S&P Global—affirming Ontario’s credit rating, and the outlook is stable. This reflects Ontario’s commitment to maintaining its targets for debt sustainability measures, despite the economic and geopolitical uncertainties the province is currently facing.
The government will provide its next economic and fiscal update as part of the 2025 Ontario Economic Outlook and Fiscal Review, to be released by November 15, 2025.
Section A: Ontario’s 2025–26 Fiscal Outlook
The province’s 2025–26 deficit is projected to be unchanged from the outlook of $14.6 billion published in the 2025 Budget.
Revenues in 2025–26 are projected to be $219.9 billion, unchanged from the 2025 Budget.
Program expense in 2025–26 is projected to be $216.3 billion, unchanged from the 2025 Budget.
Interest and Other Debt Servicing Charges in 2025–26 is projected to remain unchanged at $16.2 billion, as forecasted in the 2025 Budget.
The net debt-to-GDP ratio is projected to be 37.9 per cent in 2025–26, consistent with the forecast in the 2025 Budget.
The 2025 Budget included a $2.0 billion reserve in 2025–26, to protect the fiscal outlook against any unforeseen changes in the province’s revenue and expense forecasts. The $2.0 billion reserve has been maintained as part of the current fiscal outlook. The reserve provides additional prudence in the government’s fiscal framework and is distinct from the Contingency Fund that provides dedicated funding to be allocated in response to emerging needs.
| Item | 2025 Budget | Current Outlook | In-Year Change |
|---|---|---|---|
| Revenue | 219,887 | 219,887 | – |
| Expense — Programs | 216,298 | 216,298 | – |
| Expense — Interest and Other Debt Servicing Charges | 16,198 | 16,198 | – |
| Total Expense | 232,497 | 232,497 | – |
| Surplus/(Deficit) Before Reserve | (12,609) | (12,609) | – |
| Reserve | 2,000 | 2,000 | – |
| Surplus/(Deficit) | (14,609) | (14,609) | – |
Notes: Numbers may not add due to rounding. Current outlook primarily reflects information available as of June 30, 2025.
Sources: Ontario Treasury Board Secretariat and Ontario Ministry of Finance.
Revenue
The 2025–26 revenue outlook is projected to be $219.9 billion, unchanged from the 2025 Budget.
The revenue outlook is based on information available at the end of the first quarter of 2025–26. There are further upside and downside risks that could materially affect the revenue outlook. These include changes to the economic growth outlook, new information on tax assessments based on 2024 and prior-year tax return filings received throughout the summer, and collections. The government will monitor these economic and revenue developments, and will provide further details in future fiscal updates as new information becomes available.
Expense
Total expense is projected to be $232.5 billion, unchanged from the 2025 Budget projection.
Program Expense Update
The 2025–26 total program expense outlook, at $216.3 billion, is on track with the projection in the 2025 Budget. The government continues to manage spending within the fiscal plan.
Interest and Other Debt Servicing Charges Update
Interest and Other Debt Servicing Charges is projected to be $16.2 billion, unchanged from the forecast in the 2025 Budget.
Fiscal Prudence
The Fiscal Sustainability, Transparency and Accountability Act, 2019 requires Ontario’s fiscal plan to incorporate prudence in the form of a reserve to protect the fiscal outlook against unforeseen changes in the province’s revenue and expense, including those resulting from Ontario’s economic performance. The 2025 Budget included a reserve of $2.0 billion in 2025–26, which has been maintained as part of the current fiscal outlook.
In addition, the Contingency Fund is maintained to help mitigate expense risks—for example, in cases where health and safety may be compromised, or unforeseen events which may otherwise adversely affect Ontario’s fiscal performance. The current balance of the Contingency Fund is $3.0 billion for 2025–26.
Section B: Ontario’s Recent Economic Performance and Outlook
In the first calendar quarter of 2025, Ontario's real gross domestic product (GDP) increased by 0.6 per cent, matching growth in the previous quarter. Real GDP growth in the first quarter was supported by higher exports and household spending.
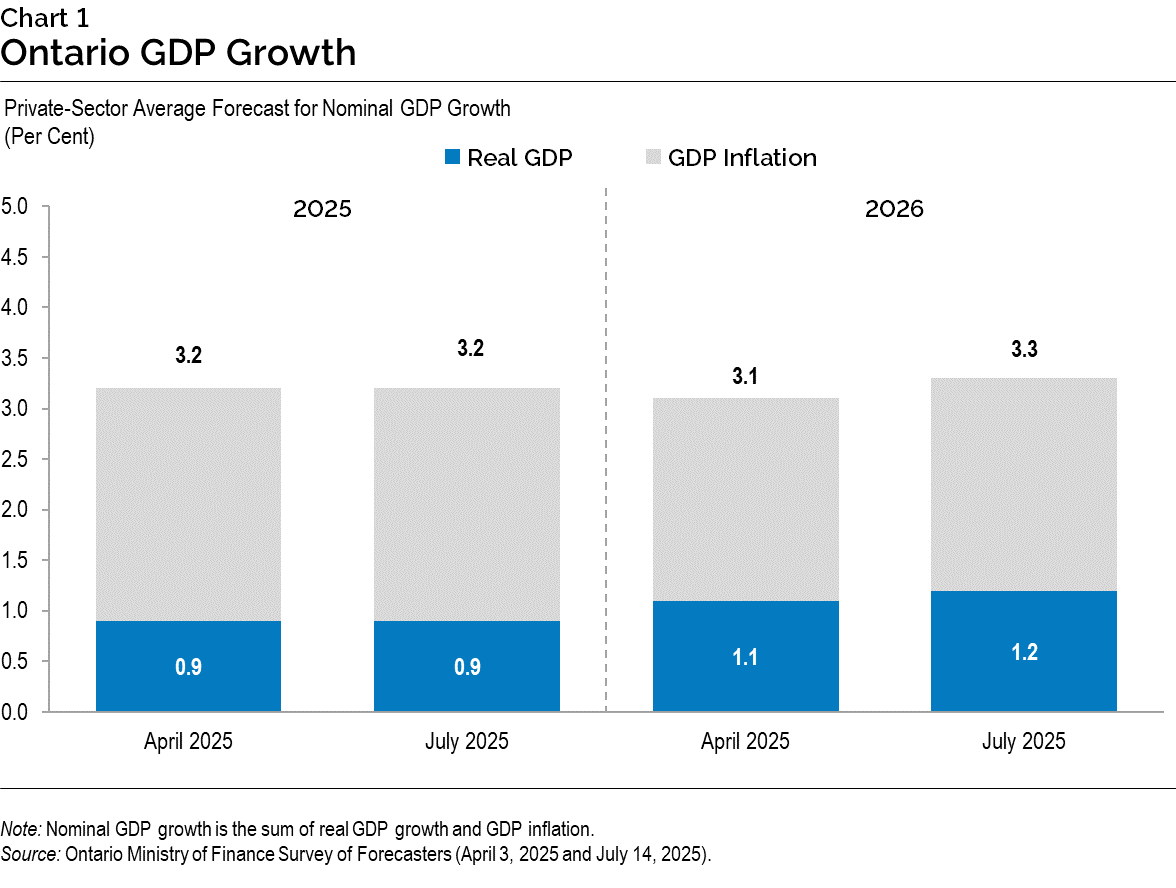
Since the release of the 2025 Budget, Ontario’s real GDP growth expectations from private-sector forecasters have, on average, remained little-changed. Private-sector forecasters, on average, project Ontario’s real GDP to rise by 0.9 per cent in 2025, the same rate projected at the time of the 2025 Budget. The private-sector average forecast for 2026 has been revised slightly upward to 1.2 per cent from 1.1 per cent at the time of the 2025 Budget.
The private-sector average forecast for Ontario’s nominal GDP growth for 2025 is 3.2 per cent, unchanged from the projection at the time of the 2025 Budget. The private-sector average forecast for 2026 has risen to 3.3 per cent from 3.1 per cent at the time of the 2025 Budget.
Global economic growth has been resilient, despite elevated uncertainty and shifting U.S. trade policy. The International Monetary Fund projects global real GDP to rise by 3.0 per cent in 2025 and 3.1 per cent in 2026, compared to the projected increases of 2.8 per cent in 2025 and 3.0 per cent in 2026 at the time of the 2025 Budget.
In the U.S., forecasters anticipate real GDP to increase by 1.4 per cent in both 2025 and 2026, unchanged from growth projections at the time of the 2025 Budget, according to the Blue Chip Economic Indicators July survey.
Uncertainty related to U.S. trade policy continues to impact the global economic outlook. Ontario’s significant trading relationships with the United States present elevated risks and uncertainty which are expected to weigh on consumer spending and business investment decisions over the near-term.
Consumer price inflation in advanced economies has eased from recent highs, although certain price pressures remain persistent. Higher tariffs and potential supply chain disruptions could raise prices and prompt central banks to maintain higher interest rates for longer.
Global conflicts continue to raise risks for key commodity markets, including for energy products and global supply chains.
Section C: Details of Ontario’s Finances
| Item | 2025–26 2025 Budget | 2025–26 Current Outlook | 2025–26 In-Year Change |
|---|---|---|---|
| Taxation Revenue — Personal Income Tax | 57,811 | 57,811 | – |
| Taxation Revenue — Sales Tax | 40,073 | 40,073 | – |
| Taxation Revenue — Corporations Tax | 25,980 | 25,980 | – |
| Taxation Revenue — Education Property Tax | 5,853 | 5,853 | – |
| Taxation Revenue — Employer Health Tax | 9,466 | 9,466 | – |
| Taxation Revenue — Ontario Health Premium | 5,366 | 5,366 | – |
| Taxation Revenue — Gasoline Tax | 1,664 | 1,664 | – |
| Taxation Revenue — Land Transfer Tax | 3,875 | 3,875 | – |
| Taxation Revenue — Tobacco Tax | 667 | 667 | – |
| Taxation Revenue — Fuel Tax | 522 | 522 | – |
| Taxation Revenue — Beer, Wine and Spirits Taxes | 388 | 388 | – |
| Taxation Revenue — Electricity Payments in Lieu of Taxes | 634 | 634 | – |
| Taxation Revenue — Ontario Portion of the Federal Cannabis Excise Duty | 376 | 376 | – |
| Taxation Revenue — Other Taxes | 1,027 | 1,027 | – |
| Taxation Revenue — Total | 153,702 | 153,702 | – |
| Government of Canada — Canada Health Transfer | 21,332 | 21,332 | – |
| Government of Canada — Canada Social Transfer | 6,794 | 6,794 | – |
| Government of Canada — Equalization | 546 | 546 | – |
| Government of Canada — Infrastructure Programs | 1,055 | 1,055 | – |
| Government of Canada — Labour Market Programs | 923 | 923 | – |
| Government of Canada — Social Housing Agreement | 133 | 133 | – |
| Government of Canada — Other Federal Payments | 7,554 | 7,554 | – |
| Government of Canada — Direct Transfers to Broader Public Sector Organizations | 509 | 509 | – |
| Government of Canada — Total | 38,846 | 38,846 | – |
| Income from Government Business Enterprises — Liquor Control Board of Ontario | 1,851 | 1,851 | – |
| Income from Government Business Enterprises — Ontario Power Generation Inc./Hydro One Ltd. | 1,599 | 1,599 | – |
| Income from Government Business Enterprises — Ontario Lottery and Gaming Corporation | 2,405 | 2,405 | – |
| Income from Government Business Enterprises — Ontario Cannabis Store | 215 | 215 | – |
| Income from Government Business Enterprises — iGaming Ontario | 247 | 247 | – |
| Income from Government Business Enterprises — Total | 6,317 | 6,317 | – |
| Other Non-Tax Revenue — Fees, Donations and Other Revenues from Hospitals, School Boards and Colleges | 10,852 | 10,852 | – |
| Other Non-Tax Revenue — Vehicle and Driver Registration Fees | 1,242 | 1,242 | – |
| Other Non-Tax Revenue — Miscellaneous Other Non-Tax Revenue | 1,710 | 1,710 | – |
| Other Non-Tax Revenue — Other Fees and Licences | 1,874 | 1,874 | – |
| Other Non-Tax Revenue — Sales and Rentals | 1,964 | 1,964 | – |
| Other Non-Tax Revenue — Reimbursements | 1,074 | 1,074 | – |
| Other Non-Tax Revenue — Royalties | 309 | 309 | – |
| Other Non-Tax Revenue — Power Supply Contract Recoveries | 44 | 44 | – |
| Other Non-Tax Revenue — Interest and Investment Income | 1,953 | 1,953 | – |
| Other Non-Tax Revenue — Total | 21,022 | 21,022 | – |
| Total Revenue | 219,887 | 219,887 | – |
Notes: Numbers may not add due to rounding. Current outlook primarily reflects information available as of June 30, 2025.
Source: Ontario Ministry of Finance.
| Ministry Expense | 2025–26 2025 Budget | 2025–26 Current Outlook | 2025–26 In-Year Change |
|---|---|---|---|
| Agriculture, Food and Agribusiness (Base) | 474.9 | 474.9 | – |
| Agriculture, Food and Agribusiness — Demand-Driven Risk Management and Time-Limited Programs | 575.3 | 575.3 | – |
| Agriculture, Food and Agribusiness (Total) | 1,050.1 | 1,050.1 | – |
| Attorney General (Base) | 2,274.4 | 2,274.4 | – |
| Attorney General — Bad Debt Expense | 5.3 | 5.3 | – |
| Attorney General (Total) | 2,279.7 | 2,279.7 | – |
| Board of Internal Economy (Total) | 352.2 | 352.2 | – |
| Children, Community and Social Services (Total) | 20,358.7 | 20,358.7 | – |
| Citizenship and Multiculturalism (Total) | 92.7 | 92.7 | – |
| Colleges, Universities, Research Excellence and Security (Base) | 11,462.7 | 11,462.7 | – |
| Colleges, Universities, Research Excellence and Security — Student Financial Assistance | 1,523.5 | 1,523.5 | – |
| Colleges, Universities, Research Excellence and Security (Total) | 12,986.2 | 12,986.2 | – |
| Economic Development, Job Creation and Trade (Base) | 205.8 | 205.8 | – |
| Economic Development, Job Creation and Trade — Tax Credits for Business Investment and Research and Development | 691.6 | 691.6 | – |
| Economic Development, Job Creation and Trade — Time-Limited Investments | 1,508.0 | 1,508.0 | – |
| Economic Development, Job Creation and Trade (Total) | 2,405.4 | 2,405.4 | – |
| Education (Base) | 40,987.4 | 40,987.4 | – |
| Education — Teachers’ Pension Plan | 1,733.0 | 1,733.0 | – |
| Education (Total) | 42,720.4 | 42,720.4 | – |
| Emergency Preparedness and Response (Total) | 66.2 | 66.2 | – |
| Energy and Mines (Base) | 661.5 | 661.5 | – |
| Energy and Mines — Electricity Cost Relief Programs | 6,463.0 | 6,463.0 | – |
| Energy and Mines — High-Speed Internet | 1,734.4 | 1,734.4 | – |
| Energy and Mines — Time-Limited Investments | 84.1 | 84.1 | – |
| Energy and Mines (Total) | 8,943.0 | 8,943.0 | – |
| Environment, Conservation and Parks (Total) | 1,041.8 | 1,041.8 | – |
| Executive Offices (Total) | 79.4 | 79.4 | – |
| Finance (Base) | 1,163.3 | 1,163.3 | – |
| Finance — Investment Management Corporation of Ontario | 330.1 | 330.1 | – |
| Finance — Ontario Municipal Partnership Fund | 562.5 | 562.5 | – |
| Finance — Temporary and Other Local Assistance | 21.1 | 21.1 | – |
| Finance — Power Supply Contract Costs | 44.1 | 44.1 | – |
| Finance — Time-Limited Investments | 52.5 | 52.5 | – |
| Finance (Total) | 2,173.6 | 2,173.6 | – |
| Francophone Affairs (Base) | 8.7 | 8.7 | – |
| Francophone Affairs — Time-Limited Investments | 2.6 | 2.6 | – |
| Francophone Affairs (Total) | 11.3 | 11.3 | – |
| Health (Total) | 81,851.6 | 81,851.6 | – |
| Indigenous Affairs and First Nations Economic Reconciliation (Total) | 144.8 | 144.8 | – |
| Infrastructure (Base) | 747.0 | 747.0 | – |
| Infrastructure — Federal–Provincial Infrastructure Programs | 213.6 | 213.6 | – |
| Infrastructure — Waterfront Toronto Revitalization (Port Lands Flood Protection) | 32.5 | 32.5 | – |
| Infrastructure — Municipal Infrastructure Program Investments | 1,243.9 | 1,243.9 | – |
| Infrastructure — Realty | 1,437.6 | 1,437.6 | – |
| Infrastructure (Total) | 3,674.7 | 3,674.7 | – |
| Labour, Immigration, Training and Skills Development (Base) | 160.0 | 160.0 | – |
| Labour, Immigration, Training and Skills Development — Co-operative Education Tax Credit | 102.5 | 102.5 | – |
| Labour, Immigration, Training and Skills Development — Demand-Driven Employment and Training Programs | 1,840.2 | 1,840.2 | – |
| Labour, Immigration, Training and Skills Development (Total) | 2,102.7 | 2,102.7 | – |
| Long-Term Care (Total) | 9,279.3 | 9,279.3 | – |
| Municipal Affairs and Housing (Base) | 798.5 | 798.5 | – |
| Municipal Affairs and Housing — Time-Limited Investments | 830.7 | 830.7 | – |
| Municipal Affairs and Housing — Social Housing Agreement – Payments to Service Managers | 128.3 | 128.3 | – |
| Municipal Affairs and Housing (Total) | 1,757.4 | 1,757.4 | – |
| Natural Resources (Base) | 740.4 | 740.4 | – |
| Natural Resources — Emergency Forest Firefighting | 135.0 | 135.0 | – |
| Natural Resources (Total) | 875.4 | 875.4 | – |
| Northern Economic Development and Growth (Total) | 805.2 | 805.2 | – |
| Public and Business Service Delivery and Procurement (Total) | 1,712.3 | 1,712.3 | – |
| Rural Affairs (Base) | 14.3 | 14.3 | – |
| Rural Affairs — Time-Limited Investments | 5.0 | 5.0 | – |
| Rural Affairs (Total) | 19.3 | 19.3 | – |
| Seniors and Accessibility (Base) | 76.8 | 76.8 | – |
| Seniors and Accessibility — Seniors Tax Credit | 104.3 | 104.3 | – |
| Seniors and Accessibility (Total) | 181.1 | 181.1 | – |
| Solicitor General (Total) | 4,463.0 | 4,463.0 | – |
| Sport (Base) | 62.9 | 62.9 | – |
| Sport — Time-Limited Investments | 150.0 | 150.0 | – |
| Sport (Total) | 212.9 | 212.9 | – |
| Tourism, Culture and Gaming (Base) | 869.2 | 869.2 | – |
| Tourism, Culture and Gaming — Ontario Cultural Media Tax Credits | 1,028.4 | 1,028.4 | – |
| Tourism, Culture and Gaming (Total) | 1,897.6 | 1,897.6 | – |
| Transportation (Base) | 7,198.6 | 7,198.6 | – |
| Transportation — Federal–Provincial Infrastructure Programs | 629.9 | 629.9 | – |
| Transportation (Total) | 7,828.6 | 7,828.6 | – |
| Treasury Board Secretariat (Base) | 403.9 | 403.9 | – |
| Treasury Board Secretariat — Employee and Pensioner Benefits | 1,528.0 | 1,528.0 | – |
| Treasury Board Secretariat — Operating Contingency Fund | 2,825.0 | 2,825.0 | – |
| Treasury Board Secretariat — Capital Contingency Fund | 175.0 | 175.0 | – |
| Treasury Board Secretariat (Total) | 4,931.9 | 4,931.9 | – |
| Interest and Other Debt Servicing Charges | 16,198.1 | 16,198.1 | – |
| Total Expense | 232,496.6 | 232,496.6 | – |
Notes: Numbers may not add due to rounding. Current outlook primarily reflects information available as of June 30, 2025.
Sources: Ontario Treasury Board Secretariat and Ontario Ministry of Finance.
| Sector | 2025–26 Current Outlook Investment in Capital Assets | 2025–26 Current Outlook Transfers and Other Infrastructure Expenditures | 2025–26 Current Outlook Total Infrastructure Expenditures | 2025 Budget Total Infrastructure Expenditures | In-Year Change Total Infrastructure Expenditures |
|---|---|---|---|---|---|
| Transportation — Transit | 9,671 | 1,079 | 10,749 | 10,749 | – |
| Transportation — Provincial Highways | 3,864 | 395 | 4,259 | 4,259 | – |
| Transportation — Other Transportation, Property and Planning | 177 | 145 | 321 | 321 | – |
| Health — Hospitals | 4,455 | 15 | 4,470 | 4,470 | – |
| Health — Other Health | 53 | 679 | 732 | 732 | – |
| Education | 3,957 | 260 | 4,216 | 4,216 | – |
| Postsecondary Education — Colleges and Other | 636 | 72 | 708 | 708 | – |
| Postsecondary Education — Universities | – | 185 | 185 | 185 | – |
| Social | 32 | 613 | 644 | 644 | – |
| Justice | 936 | 37 | 973 | 973 | – |
| Other Sectors | 3,323 | 4,455 | 7,778 | 7,778 | – |
| Total Infrastructure Expenditures | 27,103 | 7,934 | 35,037 | 35,037 | – |
| Less: Other Partner Funding | 1,690 | – | 1,690 | 1,690 | – |
| Total | 25,412 | 7,934 | 33,346 | 33,346 | – |
Notes: Numbers may not add due to rounding. Current outlook primarily reflects information available as of June 30, 2025.
Source: Ontario Treasury Board Secretariat.
| Item | Actual 2021–22 | Actual 2022–23 | Actual 2023–24 | Interim 2024–25 | Current Outlook 2025–26 |
|---|---|---|---|---|---|
| Revenue | 185,847 | 194,431 | 209,021 | 221,602 | 219,887 |
| Expense — Programs | 170,520 | 186,364 | 195,207 | 212,374 | 216,298 |
| Expense — Interest and Other Debt Servicing Charges | 13,302 | 13,935 | 14,461 | 15,224 | 16,198 |
| Total Expense | 183,822 | 200,299 | 209,668 | 227,598 | 232,497 |
| Reserve | – | – | – | – | 2,000 |
| Surplus/(Deficit) | 2,025 | (5,868) | (647) | (5,996) | (14,609) |
| Net Debt | 382,842 | 399,806 | 407,969 | 428,125 | 460,758 |
| Accumulated Deficit | 238,160 | 246,007 | 244,309 | 250,305 | 264,914 |
| Gross Domestic Product (GDP) at Market Prices | 970,146 | 1,061,714 | 1,119,545 | 1,178,353 | 1,214,882 |
| Primary Household Income | 642,144 | 692,033 | 736,585 | 791,627 | 823,292 |
| Population — July (000s) | 14,842 | 15,141 | 15,623 | 16,124 | 16,348 |
| Net Debt Per Capita (dollars) | 25,794 | 26,405 | 26,113 | 26,552 | 28,184 |
| Household Income Per Capita (dollars) | 43,264 | 45,705 | 47,147 | 49,033 | 50,359 |
| Net Debt as a Per Cent of Operating Revenue | 206.8% | 207.3% | 198.1% | 195.4% | 211.4% |
| Net Interest as a Per Cent of Operating Revenue | 6.8% | 6.4% | 5.5% | 5.8% | 6.5% |
| Net Debt as a Per Cent of GDP | 39.5% | 37.7% | 36.4% | 36.3% | 37.9% |
| Accumulated Deficit as a Per Cent of GDP | 24.5% | 23.2% | 21.8% | 21.2% | 21.8% |
Notes: Numbers may not add due to rounding. Current outlook primarily reflects information available as of June 30, 2025.
Sources: Statistics Canada, Ontario Treasury Board Secretariat and Ontario Ministry of Finance.
Section D: Ontario’s 2025–26 Borrowing Program
| Item | 2025–26 2025 Budget | 2025–26 Current Outlook | 2025–26 Change from 2025 Budget |
|---|---|---|---|
| Deficit/(Surplus) | 14.6 | 14.6 | – |
| Provincial Investment in Capital Assets | 23.1 | 23.1 | – |
| Amortization of Capital Assets | (9.1) | (9.1) | – |
| Non-Cash and Cash Timing Adjustments | (3.1) | (3.1) | – |
| Net Loans and Investments | 1.2 | 1.2 | – |
| Debt Maturities and Redemptions | 33.1 | 33.1 | – |
| Total Funding Requirement | 59.8 | 59.8 | – |
| Decrease/(Increase) in Short-Term Borrowing | (5.0) | (5.0) | – |
| Increase/(Decrease) in Year-End Cash and Cash Equivalents | (12.0) | (12.0) | – |
| Total Long-Term Public Borrowing | 42.8 | 42.8 | – |
Note: Numbers may not add due to rounding.
Source: Ontario Financing Authority.
Ontario’s current funding requirements and long-term borrowing for 2025–26 are projected to remain unchanged from the forecast in the 2025 Budget.
As of July 31, 2025, Ontario had completed $20.9 billion or 48.9 per cent of its $42.8 billion 2025–26 long‑term borrowing program. Approximately $14.3 billion or 68.5 per cent was completed in Canadian dollars, with the remaining $6.6 billion or 31.5 per cent completed primarily in U.S. dollars and euros.
Green Bonds remain a core component of Ontario’s borrowing program and are an important tool to help finance public transit initiatives, extreme weather-resilient infrastructure, as well as energy efficiency and conservation projects. Ontario remains the largest issuer of Canadian dollar Green Bonds, totalling $21.5 billion issued since 2014–15, with $16.8 billion outstanding.
Ontario plans to continue its leadership in the Canadian dollar Green Bond market and, subject to market conditions, will issue multiple Green Bonds each fiscal year, including in 2025–26.
Ontario’s cost of borrowing for 2025–26 remains at 4.0 per cent, as long-term rates have remained within the range forecasted in the 2025 Budget through the first quarter. The province will continue to monitor movements in interest rates and provide regular updates on the Interest and Other Debt Servicing Charges expense in future fiscal updates.
2025–26 Long-Term Borrowing
| Item | Amount |
|---|---|
| Canadian Dollar Issues | 14.3 |
| Foreign Currency Issues | 6.6 |
| Total | 20.9 |
Notes: Numbers may not add due to rounding. As of July 31, 2025.
Source: Ontario Financing Authority.
Ministry of Finance: www.ontario.ca/finance
For general inquiries regarding the 2025–26 First Quarter Finances, please call or email:
Toll-free English and French inquiries:
Teletypewriter:
Email: FinanceCommunications.fin@ontario.ca
© King’s Printer for Ontario, 2025
Chart Descriptions: Alternative Text for Web Accessibility
Chart 1: Ontario GDP Growth
This stacked bar chart shows private-sector average forecasts in April 2025 and July 2025 for Ontario real GDP growth, GDP inflation and nominal GDP growth in 2025 and 2026. Note that nominal GDP growth is the sum of real GDP growth and GDP inflation.
In April 2025, the average of private-sector forecasts projected Ontario’s real GDP to rise by 0.9 per cent in 2025 and nominal GDP to increase by 3.2 per cent. For 2026, real GDP was projected to rise by 1.1 per cent and nominal GDP to grow by 3.1 per cent.
In July 2025, the average of private-sector forecasts projects Ontario’s real GDP to rise by 0.9 per cent in 2025 and nominal GDP to grow by 3.2 per cent. For 2026, real GDP is projected to rise by 1.2 per cent and nominal GDP to increase by 3.3 per cent.
Source: Ontario Ministry of Finance Survey of Forecasters (April 3, 2025 and July 14, 2025).
Footnotes
- footnote[1] Back to paragraph Numbers reflect current ministry structure.
- footnote[2] Back to paragraph Includes the estimated cost of tax credit claims for the Regional Opportunities Investment Tax Credit, the Ontario Innovation Tax Credit, the Ontario Business-Research Institute Tax Credit and the Ontario Made Manufacturing Investment Tax Credit (OMMITC). These costs include impacts for an enhancement to the OMMITC proposed in the 2025 Budget, with costs starting in 2025–26. They do not include an expansion of the OMMITC that was also proposed in the 2025 Budget, with impacts reported separately as a revenue decrease.
- footnote[3] Back to paragraph The Ontario Ministry of Long-Term Care total includes expenses incurred by Ontario Health for funding for long-term care. These amounts will be consolidated in the total expense of the Ontario Ministry of Health, including $5.7 billion in 2025–26.
- footnote[4] Back to paragraph Interest and Other Debt Servicing Charges is net of interest capitalized during construction of tangible capital assets of $1,415 million in 2025–26.
- footnote[5] Back to paragraph Includes $1,415 million in interest capitalized during construction.
- footnote[6] Back to paragraph Includes provincial investment in capital assets of $23.1 billion.
- footnote[7] Back to paragraph Includes transfers to municipalities, universities and non-consolidated agencies.
- footnote[8] Back to paragraph Includes high-speed internet infrastructure, government administration, natural resources and culture and tourism industries.
- footnote[9] Back to paragraph Other Partner Funding refers to third-party investments, primarily in hospitals, colleges and schools.
- footnote[10] Back to paragraph Includes Federal–Municipal contributions to provincial infrastructure investments.
- footnote[11] Back to paragraph Interim represents the 2025 Budget projection for the 2024–25 fiscal year, updated for the latest available information for GDP, household income and net debt.
- footnote[12] Back to paragraph Interest and Other Debt Servicing Charges is net of interest capitalized during construction of tangible capital assets of $694 million in 2022–23, $978 million in 2023–24, $1,195 million in 2024–25 and $1,415 million in 2025–26.
- footnote[13] Back to paragraph Population figures are for July 1 of the fiscal year indicated (i.e., for 2025–26, the population on July 1, 2025 is shown).