2025–26 Third Quarter Finances
The Third Quarter Finances report contains information about Ontario’s 2025–26 fiscal outlook, primarily as of December 31, 2025.
Highlights
- Ontario’s real gross domestic product (GDP) increased 0.5 per cent in the third quarter of 2025, following a 0.7 per cent decline in the second quarter. Ontario’s real GDP rose by an estimated 1.2 per cent in 2025, which is higher than projected at the time of the 2025 Ontario Economic Outlook and Fiscal Review, while the private-sector average projection for real GDP growth in 2026 has increased slightly to 1.1 per cent.
- As of the 2025–26 Third Quarter Finances, the province’s 2025–26 deficit is projected to be $13.4 billion—an improvement of $0.1 billion compared to the 2025 Ontario Economic Outlook and Fiscal Review. The 2025 Budget, published in May 2025, projected a deficit of $14.6 billion.
- Revenues in 2025–26 are projected to be $223.7 billion, $3.8 billion higher than forecasted in the 2025 Budget and $0.6 billion higher than expected in the 2025 Ontario Economic Outlook and Fiscal Review.
- Overall program expense in 2025–26 is projected to be $219.9 billion, $3.6 billion higher than forecasted in the 2025 Budget and $1.5 billion higher than the forecast in the 2025 Ontario Economic Outlook and Fiscal Review.
Section A: Ontario’s 2025–26 Fiscal Outlook
The 2025–26 Third Quarter Finances provides the final update on the province’s economic and fiscal outlook for the 2025–26 fiscal year, ahead of the 2026 Budget, demonstrating the government’s leadership and commitment to transparency and accountability. Protecting Ontario through building a more competitive, resilient and self-reliant economy remains the focus of the government's economic plan. In the face of global economic uncertainty driven by evolving U.S. trade policy, the government will continue making investments to support growth and keep costs down for families, while maintaining a prudent and targeted path to balance.
Ontario’s finances are in the strongest position they have been in for over a decade. In 2024, S&P Global and Morningstar DBRS upgraded Ontario's credit rating. This reverses the trend of credit downgrades and shows that Ontario’s prudent and responsible fiscal plan is working. A higher credit rating means Ontario is seen as a lower-risk borrower. This reduces Ontario’s borrowing costs and supports investment in the province, creating more jobs while financing the government’s historic infrastructure plans. Since the credit rating upgrades, Ontario has seen new international buyers of its bonds and continues to have the lowest interest rate of all provinces in the 30-year term.
In 2025, all four major credit rating agencies—Moody’s, Fitch, Morningstar DBRS and S&P Global—affirmed Ontario’s credit rating, and the outlook is stable. This reflects Ontario’s commitment to maintaining its targets for debt sustainability measures, despite the economic and geopolitical uncertainties the province is currently facing.
Ontario’s 2025–26 deficit is projected to be $13.4 billion—an improvement of $0.1 billion from the outlook published in the 2025 Ontario Economic Outlook and Fiscal Review. The 2025 Budget, published in May 2025, projected a deficit of $14.6 billion.
Revenues in 2025–26 are projected to be $3.8 billion higher than forecasted in the 2025 Budget and $0.6 billion higher than expected in the 2025 Ontario Economic Outlook and Fiscal Review.
Overall program expense in 2025–26 is projected to be $219.9 billion, $3.6 billion higher than the 2025 Budget projection, and $1.5 billion higher than the forecast in the 2025 Ontario Economic Outlook and Fiscal Review. New commitments since the 2025 Ontario Economic Outlook and Fiscal Review primarily relate to investments to support the Ontario Student Assistance Program, hospital funding, emergency firefighting and evacuation services, road safety, and agreements with First Nation communities to unlock the Ring of Fire.
Interest and Other Debt Servicing Charges in 2025–26 is projected to be $16.2 billion, consistent with the forecasts in the 2025 Budget and the 2025 Ontario Economic Outlook and Fiscal Review.
At the time of the 2025–26 Third Quarter Finances, the net debt-to-GDP ratio is projected to be 36.9 per cent in 2025–26, 1.0 percentage point lower than the 37.9 per cent forecast in the 2025 Budget and 0.8 percentage points lower than the 37.7 per cent forecast in the 2025 Ontario Economic Outlook and Fiscal Review.
The 2025 Budget included a $2.0 billion reserve in 2025–26, to protect the fiscal outlook against any unforeseen changes in the province’s revenue and expense forecasts. With the release of the 2025–26 Third Quarter Finances, the reserve has been reduced to $1.0 billion. The reserve provides prudence in the government’s fiscal framework and is distinct from contingency funds that set aside dedicated funding. The remaining reserve can be used to safeguard against any events and uncertainty that may arise or can be eliminated if not needed as part of year-end projections, supporting the government’s ability to protect the fiscal plan and uphold prudent financial management.
The government’s next economic and fiscal update, including the province’s final projection for 2025–26, will be released by March 31, 2026, as part of the 2026 Budget.
| Item | 2025 Budget | Current Outlook | In-Year Change |
|---|---|---|---|
| Revenue | 219,887 | 223,682 | 3,795 |
| Expense — Programs | 216,298 | 219,929 | 3,631 |
| Expense — Interest and Other Debt Servicing Charges | 16,198 | 16,177 | (21) |
| Total Expense | 232,497 | 236,106 | 3,609 |
| Surplus/(Deficit) Before Reserve | (12,609) | (12,424) | 186 |
| Reserve | 2,000 | 1,000 | (1,000) |
| Surplus/(Deficit) | (14,609) | (13,424) | 1,186 |
Notes: Numbers may not add due to rounding. Current outlook primarily reflects information available as of December 31, 2025.
Sources: Ontario Treasury Board Secretariat and Ontario Ministry of Finance.
Revenue
The outlook for revenue in 2025–26 is projected to be $223.7 billion, an increase of $3.8 billion compared to the 2025 Budget and $0.6 billion higher than the 2025 Ontario Economic Outlook and Fiscal Review.
Key changes in the revenue outlook compared to the 2025 Ontario Economic Outlook and Fiscal Review include:
- Government of Canada Transfers projections have increased by $178 million, mainly due to higher Canada Health Transfer and Canada Social Transfer, as well as additional funding for emergency evacuation support services for First Nations.
- Net Income from Government Business Enterprises increased by $399 million, driven mainly by
a higher net income forecast for Ontario Power Generation, reflecting stronger realized gains in Ontario nuclear funds.
| Item | 2025–26 |
|---|---|
| 2025 Budget Total Revenue | 219,887 |
| Revenue Changes in the 2025–26 First Quarter Finances | – |
| Revenue Changes in the 2025 Ontario Economic Outlook and Fiscal Review | 3,219 |
| Revenue Changes Since the 2025 Ontario Economic Outlook and Fiscal Review — Government of Canada Transfers | 178 |
| Revenue Changes Since the 2025 Ontario Economic Outlook and Fiscal Review — Government Business Enterprises | 399 |
| Total Revenue Changes Since the 2025 Ontario Economic Outlook and Fiscal Review | 577 |
| Total Revenue Changes Since the 2025 Budget | 3,795 |
| 2025–26 Third Quarter Finances Total Revenue Outlook | 223,682 |
Notes: Numbers may not add due to rounding. Current outlook primarily reflects information available as of December 31, 2025.
Source: Ontario Ministry of Finance.
Additional developments could materially affect the 2025–26 revenue outlook as new information becomes available during and well after the end of the 2025–26 fiscal year. These include changes to the economic growth outlook, the results from tax return processing, revenue collections from Ontario‑administered taxes and the earnings of government business enterprises. The government will monitor these developments and provide further details in future fiscal updates.
Expense
Total expense is projected to be $236.1 billion, $3.6 billion higher than the 2025 Budget projection and $1.5 billion higher than the projection at the time of the 2025 Ontario Economic Outlook and Fiscal Review.
| Item | 2025–26 |
|---|---|
| 2025 Budget Total Expense | 232,497 |
| Total Expense Changes in the 2025–26 First Quarter Finances | – |
| Total Expense Changes in the 2025 Ontario Economic Outlook and Fiscal Review | 2,130 |
| Total Program Expense Changes Since the 2025 Ontario Economic Outlook and Fiscal Review — Ontario Student Assistance Program | 1,429 |
| Total Program Expense Changes Since the 2025 Ontario Economic Outlook and Fiscal Review — Targeted Hospital Funding and Other Hospital Supports | 664 |
| Total Program Expense Changes Since the 2025 Ontario Economic Outlook and Fiscal Review — Emergency Firefighting | 60 |
| Total Program Expense Changes Since the 2025 Ontario Economic Outlook and Fiscal Review — Emergency Evacuation Support Services — First Nations | 51 |
| Total Program Expense Changes Since the 2025 Ontario Economic Outlook and Fiscal Review — Road Safety Initiatives Fund | 42 |
| Total Program Expense Changes Since the 2025 Ontario Economic Outlook and Fiscal Review — Ring of Fire Community Partnership Agreements with Webequie and Marten Falls First Nations | 22 |
| Total Program Expense Changes Since the 2025 Ontario Economic Outlook and Fiscal Review — Rebuilding and Re-Imagining Samuel de Champlain Provincial Park | 2 |
| Total Program Expense Changes Since the 2025 Ontario Economic Outlook and Fiscal Review | 2,270 |
| Drawdown of the Contingency Fund | (790) |
| Total Net Program Expense Changes Since the 2025 Ontario Economic Outlook and Fiscal Review | 1,480 |
| Interest and Other Debt Servicing Charges Change Since the 2025 Ontario Economic Outlook and Fiscal Review | – |
| Total Expense Changes Since the 2025 Ontario Economic Outlook and Fiscal Review | 1,480 |
| Total Expense Changes Since the 2025 Budget | 3,609 |
| 2025–26 Third Quarter Finances Total Expense Outlook | 236,106 |
Notes: Numbers may not add due to rounding. Current outlook primarily reflects information available as of December 31, 2025.
Sources: Ontario Treasury Board Secretariat and Ontario Ministry of Finance.
Program Expense Update
Total program expense in 2025–26 is projected to be $219.9 billion, $3.6 billion higher than forecasted in the 2025 Budget and $1.5 billion higher than the 2025 Ontario Economic Outlook and Fiscal Review. New commitments since the release of the 2025 Ontario Economic Outlook and Fiscal Review include supports for the Ontario Student Assistance Program, hospital funding, emergency firefighting and evacuation services, road safety, and agreements with First Nations to unlock the economic benefits of the Ring of Fire.
Key changes to program expense projections since the release of the 2025 Ontario Economic Outlook and Fiscal Review include:
- $1,429.0 million for the Ontario Student Assistance Program, due to higher-than-forecasted uptake;
- $664.1 million in health sector supports, to address hospital operational pressures;
- $60.0 million to meet requirements for wildfire management and suppression activities for the 2025 fire season, which saw a 300 per cent increase in hectares burned, compared to 2024;
- $50.7 million to support evacuation services for First Nation communities affected by spring flooding and wildland fires;
- $42.0 million, as part of the Road Safety Initiatives Fund, to support traffic-calming measures in school zones and community safety zones that previously deployed municipal speed cameras;
- $21.5 million for community supports, as part of the implementation of the Community Partnership Agreements with the Webequie and Marten Falls First Nations, to unlock the economic benefits of
the Ring of Fire; and - $2.5 million as part of the government’s $4.8 million investment to rebuild and upgrade the storm‑damaged Samuel de Champlain Provincial Park. The revitalization will attract visitors, create jobs and help more people enjoy the outdoors.
Interest and Other Debt Servicing Charges Expense Update
Interest and Other Debt Servicing Charges expense is projected to be $16.2 billion, consistent with the forecast in the 2025 Budget and the 2025 Ontario Economic Outlook and Fiscal Review. Interest rates have been within the range anticipated since the 2025 Budget. As a result, Ontario’s cost of borrowing for 2025–26 remains unchanged at 4.0 per cent.
Fiscal Prudence
The Fiscal Sustainability, Transparency and Accountability Act, 2019 requires Ontario’s fiscal plan to incorporate prudence in the form of a reserve to protect the fiscal outlook against unforeseen changes in the province’s revenue and expenses, including those resulting from Ontario’s economic performance. With the release of the 2025–26 Third Quarter Finances, the reserve has been reduced to $1.0 billion. The remaining reserve can be used to safeguard against any events and uncertainty that may arise, or can be eliminated if not needed as part of year-end projections, supporting the government’s ability to protect the fiscal plan and uphold prudent financial management.
In addition, the Contingency Fund is maintained to help mitigate expense risks—for example, in cases where health and safety may be compromised, or in case of unforeseen events which may otherwise adversely affect Ontario’s fiscal performance. The remaining balance of the Contingency Fund is $3.8 billion for 2025–26.
Section B: Ontario’s Economic Outlook
Economic Outlook
In the third calendar quarter of 2025, Ontario’s real gross domestic product (GDP) increased 0.5 per cent, following a 0.7 per cent decrease in the second quarter of 2025. Growth in the third quarter was supported by gains in net trade, as exports edged up and imports declined. The outlook for global growth has remained resilient, despite the impacts of changing trade policies and the associated rise in uncertainty. The International Monetary Fund estimates that global real GDP grew by 3.3 per cent in 2025, and projects real GDP to again increase by 3.3 per cent in 2026. United States real GDP is estimated to have increased by 2.1 per cent in 2025 and is projected to also rise by 2.1 per cent in 2026, according to Blue Chip Economic Indicators.
Ontario’s real GDP rose by an estimated 1.2 per cent in 2025, which is higher than was expected at the time of the 2025 Ontario Economic Outlook and Fiscal Review. Private-sector forecasters, on average, project Ontario’s real GDP to rise by 1.1 per cent in 2026, which is slightly higher than the private-sector average of 1.0 per cent at the time of the 2025 Ontario Economic Outlook and Fiscal Review.
The evolution of United States trade policy remains the most significant risk to Ontario’s economic outlook. Ontario’s significant trading relationship with the U.S. exposes the economy to shifts in U.S. trade policy and related uncertainty. In addition to the direct impacts of trade disruptions, elevated uncertainty can also impact consumer and business spending and investment decisions. Shifting trade policies and elevated geopolitical tensions are a risk to global supply chains and commodity markets. Significant shocks could contribute to a rise in inflation, which could lead to higher interest rates.
Section C: Details of Ontario’s Finances
| Item | 2025–26 2025 Budget | 2025–26 Current Outlook | 2025–26 In-Year Change |
|---|---|---|---|
| Taxation Revenue — Personal Income Tax | 57,811 | 59,268 | 1,457 |
| Taxation Revenue — Sales Tax | 40,073 | 40,096 | 23 |
| Taxation Revenue — Corporations Tax | 25,980 | 27,000 | 1,020 |
| Taxation Revenue — Education Property Tax | 5,853 | 5,905 | 52 |
| Taxation Revenue — Employer Health Tax | 9,466 | 9,390 | (76) |
| Taxation Revenue — Ontario Health Premium | 5,366 | 5,392 | 26 |
| Taxation Revenue — Gasoline Tax | 1,664 | 1,705 | 41 |
| Taxation Revenue — Land Transfer Tax | 3,875 | 3,299 | (576) |
| Taxation Revenue — Tobacco Tax | 667 | 646 | (21) |
| Taxation Revenue — Fuel Tax | 522 | 513 | (9) |
| Taxation Revenue — Beer, Wine and Spirits Taxes | 388 | 415 | 27 |
| Taxation Revenue — Electricity Payments in Lieu of Taxes | 634 | 564 | (70) |
| Taxation Revenue — Ontario Portion of the Federal Cannabis Excise Duty | 376 | 385 | 9 |
| Taxation Revenue — Other Taxes | 1,027 | 994 | (33) |
| Taxation Revenue — Total | 153,702 | 155,571 | 1,869 |
| Government of Canada Transfers — Canada Health Transfer | 21,332 | 21,393 | 60 |
| Government of Canada Transfers — Canada Social Transfer | 6,794 | 6,813 | 19 |
| Government of Canada Transfers — Equalization | 546 | 546 | – |
| Government of Canada Transfers — Infrastructure Programs | 1,055 | 1,055 | – |
| Government of Canada Transfers — Labour Market Programs | 923 | 923 | – |
| Government of Canada Transfers — Social Housing Agreement | 133 | 133 | – |
| Government of Canada Transfers — Other Federal Payments | 7,554 | 7,704 | 150 |
| Government of Canada Transfers — Direct Transfers to Broader Public Sector Organizations | 509 | 509 | – |
| Government of Canada Transfers — Total | 38,846 | 39,076 | 230 |
| Income from Government Business Enterprises — Liquor Control Board of Ontario | 1,851 | 1,851 | – |
| Income from Government Business Enterprises — Ontario Power Generation Inc./Hydro One Ltd. | 1,599 | 2,187 | 588 |
| Income from Government Business Enterprises — Ontario Lottery and Gaming Corporation | 2,405 | 2,412 | 7 |
| Income from Government Business Enterprises — Ontario Cannabis Store | 215 | 225 | 10 |
| Income from Government Business Enterprises — iGaming Ontario | 247 | 253 | 6 |
| Income from Government Business Enterprises — Total | 6,317 | 6,928 | 611 |
| Other Non-Tax Revenue — Fees, Donations and Other Revenues from Hospitals, School Boards and Colleges | 10,852 | 11,852 | 1,000 |
| Other Non-Tax Revenue — Vehicle and Driver Registration Fees | 1,242 | 1,242 | – |
| Other Non-Tax Revenue — Miscellaneous Other Non-Tax Revenue | 1,710 | 1,710 | – |
| Other Non-Tax Revenue — Other Fees and Licences | 1,874 | 1,874 | (0) |
| Other Non-Tax Revenue — Sales and Rentals | 1,964 | 1,964 | – |
| Other Non-Tax Revenue — Reimbursements | 1,074 | 1,076 | 2 |
| Other Non-Tax Revenue — Royalties | 309 | 309 | – |
| Other Non-Tax Revenue — Power Supply Contract Recoveries | 44 | 44 | – |
| Other Non-Tax Revenue — Interest and Investment Income | 1,953 | 2,037 | 84 |
| Other Non-Tax Revenue — Total | 21,022 | 22,108 | 1,086 |
| Total Revenue | 219,887 | 223,682 | 3,795 |
Notes: Numbers may not add due to rounding. Current outlook primarily reflects information available as of December 31, 2025.
Source: Ontario Ministry of Finance.
| Ministry Expense | 2025–26 2025 Budget | 2025–26 Current Outlook | 2025–26 In-Year Change |
|---|---|---|---|
| Agriculture, Food and Agribusiness (Base) | 474.9 | 478.2 | 3.3 |
| Agriculture, Food and Agribusiness — Demand-Driven Risk Management and Time-Limited Programs | 575.3 | 575.3 | – |
| Agriculture, Food and Agribusiness (Total) | 1,050.1 | 1,053.4 | 3.3 |
| Attorney General (Base) | 2,274.4 | 2,274.4 | – |
| Attorney General — Bad Debt Expense | 5.3 | 5.3 | – |
| Attorney General (Total) | 2,279.7 | 2,279.7 | – |
| Board of Internal Economy (Total) | 352.2 | 352.2 | – |
| Children, Community and Social Services (Total) | 20,358.7 | 20,358.7 | – |
| Citizenship and Multiculturalism (Total) | 92.7 | 92.7 | – |
| Colleges, Universities, Research Excellence and Security (Base) | 11,462.7 | 11,462.9 | 0.2 |
| Colleges, Universities, Research Excellence and Security — Student Financial Assistance | 1,523.5 | 2,952.5 | 1,429.0 |
| Colleges, Universities, Research Excellence and Security (Total) | 12,986.2 | 14,415.4 | 1,429.2 |
| Economic Development, Job Creation and Trade (Base) | 205.8 | 205.8 | – |
| Economic Development, Job Creation and Trade — Tax Credits for Business Investment and Research and Development | 691.6 | 691.6 | – |
| Economic Development, Job Creation and Trade — Time-Limited Investments | 1,508.0 | 1,508.0 | – |
| Economic Development, Job Creation and Trade (Total) | 2,405.4 | 2,405.4 | – |
| Education (Base) | 40,987.4 | 40,987.4 | – |
| Education — Teachers’ Pension Plan | 1,733.0 | 1,733.0 | – |
| Education (Total) | 42,720.4 | 42,720.4 | – |
| Emergency Preparedness and Response (Total) | 66.2 | 216.2 | 150.0 |
| Energy and Mines (Base) | 661.5 | 661.5 | – |
| Energy and Mines — Electricity Cost Relief Programs | 6,463.0 | 6,463.0 | – |
| Energy and Mines — High-Speed Internet | 1,734.4 | 1,734.4 | – |
| Energy and Mines — Time-Limited Investments | 84.1 | 84.1 | – |
| Energy and Mines (Total) | 8,943.0 | 8,943.0 | – |
| Environment, Conservation and Parks (Total) | 1,041.8 | 1,046.3 | 4.5 |
| Executive Offices (Total) | 79.4 | 79.4 | – |
| Finance (Base) | 1,163.3 | 1,163.3 | – |
| Finance — Investment Management Corporation of Ontario | 330.1 | 330.1 | – |
| Finance — Ontario Municipal Partnership Fund | 562.5 | 562.5 | – |
| Finance — Temporary and Other Local Assistance | 21.1 | 21.1 | – |
| Finance — Power Supply Contract Costs | 44.1 | 44.1 | – |
| Finance — Time-Limited Investments | 52.5 | 52.5 | – |
| Finance (Total) | 2,173.6 | 2,173.6 | – |
| Francophone Affairs (Base) | 8.7 | 8.7 | – |
| Francophone Affairs — Time-Limited Investments | 2.6 | 3.6 | 1.0 |
| Francophone Affairs (Total) | 11.3 | 12.3 | 1.0 |
| Health (Total) | 81,851.6 | 82,885.4 | 1,033.8 |
| Indigenous Affairs and First Nations Economic Reconciliation(Total) | 144.8 | 166.3 | 21.5 |
| Infrastructure (Base) | 747.0 | 747.0 | – |
| Infrastructure — Federal-Provincial Infrastructure Programs | 213.6 | 213.6 | – |
| Infrastructure — Waterfront Toronto Revitalization (Port Lands Flood Protection) | 32.5 | 32.5 | – |
| Infrastructure — Municipal Infrastructure Program Investments | 1,243.9 | 1,243.9 | – |
| Infrastructure — Realty | 1,437.6 | 1,437.6 | – |
| Infrastructure (Total) | 3,674.7 | 3,674.7 | – |
| Labour, Immigration, Training and Skills Development (Base) | 160.0 | 160.0 | – |
| Labour, Immigration, Training and Skills Development — Co-operative Education Tax Credit | 102.5 | 102.5 | – |
| Labour, Immigration, Training and Skills Development — Demand-Driven Employment and Training Programs | 1,840.2 | 1,840.2 | – |
| Labour, Immigration, Training and Skills Development (Total) | 2,102.7 | 2,102.7 | – |
| Long-Term Care (Total) | 9,279.3 | 9,279.3 | – |
| Municipal Affairs and Housing (Base) | 798.5 | 798.5 | – |
| Municipal Affairs and Housing — Time-Limited Investments | 830.7 | 830.7 | – |
| Municipal Affairs and Housing — Social Housing Agreement—Payments to Service Managers | 128.3 | 128.3 | – |
| Municipal Affairs and Housing (Total) | 1,757.4 | 1,757.4 | – |
| Natural Resources (Base) | 740.4 | 770.4 | 30.0 |
| Natural Resources — Emergency Forest Firefighting | 135.0 | 285.0 | 150.0 |
| Natural Resources (Total) | 875.4 | 1,055.4 | 180.0 |
| Northern Economic Development and Growth (Total) | 805.2 | 805.2 | – |
| Public and Business Service Delivery and Procurement (Total) | 1,712.3 | 1,712.3 | – |
| Rural Affairs (Base) | 14.3 | 14.3 | – |
| Rural Affairs — Time-Limited Investments | 5.0 | 5.0 | – |
| Rural Affairs (Total) | 19.3 | 19.3 | – |
| Seniors and Accessibility (Base) | 76.8 | 76.8 | – |
| Seniors and Accessibility — Seniors Tax Credits | 104.3 | 104.3 | – |
| Seniors and Accessibility (Total) | 181.1 | 181.1 | – |
| Solicitor General (Total) | 4,463.0 | 4,473.0 | 10.0 |
| Sport (Base) | 62.9 | 62.9 | – |
| Sport — Time-Limited Investments | 150.0 | 150.0 | – |
| Sport (Total) | 212.9 | 212.9 | – |
| Tourism, Culture and Gaming (Base) | 869.2 | 871.4 | 2.2 |
| Tourism, Culture and Gaming — Ontario Cultural Media Tax Credits | 1,028.4 | 1,028.4 | – |
| Tourism, Culture and Gaming (Total) | 1,897.6 | 1,899.8 | 2.2 |
| Transportation (Base) | 7,198.6 | 7,240.6 | 42.0 |
| Transportation — Federal-Provincial Infrastructure Programs | 629.9 | 629.9 | – |
| Transportation (Total) | 7,828.6 | 7,870.6 | 42.0 |
| Treasury Board Secretariat (Base) | 403.9 | 403.9 | – |
| Treasury Board Secretariat — Employee and Pensioner Benefits | 1,528.0 | 1,528.0 | – |
| Treasury Board Secretariat — Operating Contingency Fund | 2,825.0 | 3,599.6 | 774.6 |
| Treasury Board Secretariat — Capital Contingency Fund | 175.0 | 153.5 | (21.5) |
| Treasury Board Secretariat (Total) | 4,931.9 | 5,685.0 | 753.1 |
| Interest and Other Debt Servicing Charges | 16,198.1 | 16,177.0 | (21.1) |
| Total Expense | 232,496.6 | 236,106.0 | 3,609.5 |
Notes: Numbers may not add due to rounding. Current outlook primarily reflects information available as of December 31, 2025.
Sources: Ontario Treasury Board Secretariat and Ontario Ministry of Finance.
| Sector | 2025 Budget Total Infrastructure Expenditures | 2025–26 Current Outlook Investment in Capital Assets | 2025–26 Current Outlook Transfers and Other Infrastructure Expenditures | 2025–26 Current Outlook Total Infrastructure Expenditures | Change from 2025 Budget Total Infrastructure Expenditures |
|---|---|---|---|---|---|
| Transportation — Transit | 10,749 | 10,871 | 1,079 | 11,949 | 1,200 |
| Transportation — Provincial Highways | 4,259 | 3,864 | 395 | 4,259 | – |
| Transportation — Other Transportation, Property and Planning | 321 | 177 | 145 | 321 | – |
| Health — Hospitals | 4,470 | 4,455 | 15 | 4,470 | – |
| Health — Other Health | 732 | 53 | 680 | 733 | 0 |
| Education | 4,216 | 3,957 | 260 | 4,216 | – |
| Postsecondary Education — Colleges and Other | 708 | 636 | 72 | 708 | – |
| Postsecondary Education — Universities | 185 | – | 185 | 185 | – |
| Social | 644 | 32 | 613 | 644 | – |
| Justice | 973 | 936 | 37 | 973 | – |
| Other Sectors | 7,778 | 3,350 | 4,450 | 7,800 | 22 |
| Total Infrastructure Expenditures | 35,037 | 28,330 | 7,929 | 36,259 | 1,222 |
| Less: Other Partner Funding | 1,690 | 1,691 | – | 1,691 | 1 |
| Total | 33,346 | 26,639 | 7,929 | 34,568 | 1,222 |
Notes: Numbers may not add due to rounding. Current outlook primarily reflects information available as of December 31, 2025.
Source: Ontario Treasury Board Secretariat.
| Item | 2021–22 | 2022–23 | 2023–24 | Actual 2024–25 | Current Outlook 2025–26 |
|---|---|---|---|---|---|
| Revenue | 185,847 | 194,431 | 208,975 | 226,161 | 223,682 |
| Expense —Programs | 170,520 | 186,364 | 195,207 | 212,129 | 219,929 |
| Expense —Interest and Other Debt Servicing Charges | 13,302 | 13,935 | 14,461 | 15,122 | 16,177 |
| Total Expense | 183,822 | 200,299 | 209,668 | 227,251 | 236,106 |
| Reserve | – | – | – | – | 1,000 |
| Surplus/(Deficit) | 2,025 | (5,868) | (693) | (1,090) | (13,424) |
| Net Debt | 382,842 | 399,806 | 409,761 | 427,050 | 459,724 |
| Accumulated Deficit | 238,160 | 246,007 | 246,101 | 247,060 | 260,484 |
| Gross Domestic Product (GDP) at Market Prices | 970,146 | 1,065,260 | 1,138,592 | 1,197,020 | 1,246,922 |
| Primary Household Income | 642,144 | 689,842 | 740,660 | 797,253 | 831,850 |
| Population — July (000s) | 14,842 | 15,156 | 15,632 | 16,145 | 16,258 |
| Net Debt Per Capita (dollars) | 25,794 | 26,380 | 26,212 | 26,451 | 28,276 |
| Household Income Per Capita (dollars) | 43,264 | 45,517 | 47,380 | 49,381 | 51,165 |
| Net Debt as a Per Cent of Operating Revenue | 206.8% | 207.3% | 199.0% | 191.2% | 207.4% |
| Net Interest as a Per Cent of Operating Revenue | 6.8% | 6.4% | 5.5% | 5.5% | 6.4% |
| Net Debt as a Per Cent of GDP | 39.5% | 37.5% | 36.0% | 35.7% | 36.9% |
| Accumulated Deficit as a Per Cent of GDP | 24.5% | 23.1% | 21.6% | 20.6% | 20.9% |
Notes: Numbers may not add due to rounding. Current outlook primarily reflects information available as of December 31, 2025.
Sources: Statistics Canada, Ontario Treasury Board Secretariat and Ontario Ministry of Finance.
Section D: Ontario’s 2025–26 Borrowing Program
| Item | 2025–26 2025 Budget | 2025–26 Current Outlook | 2025–26 Change from 2025 Budget |
|---|---|---|---|
| Deficit/(Surplus) | 14.6 | 13.4 | (1.2) |
| Provincial Investment in Capital Assets | 23.1 | 24.3 | 1.2 |
| Amortization of Capital Assets | (9.1) | (9.1) | – |
| Non-Cash and Cash Timing Adjustments | (3.1) | (2.1) | 1.0 |
| Net Loans and Investments | 1.2 | 2.4 | 1.2 |
| Debt Maturities/Redemptions | 33.1 | 33.1 | – |
| Total Funding Requirement | 59.8 | 62.0 | 2.2 |
| Decrease/(Increase) in Short-Term Borrowing | (5.0) | (5.5) | (0.5) |
| Increase/(Decrease) in Year-End Cash and Cash Equivalents | (12.0) | (5.6) | 6.4 |
| Total Long-Term Borrowing | 42.8 | 50.9 | 8.1 |
Note: Numbers may not add due to rounding.
Source: Ontario Financing Authority.
As of February 5, 2026, Ontario completed $50.9 billion of long-term borrowing in 2025–26 and has begun pre-borrowing for the next fiscal year. Approximately $32.3 billion, or 63 per cent, was completed in Canadian dollars, with the remaining $18.6 billion, or 37 per cent, completed in U.S. dollars, euros and Swiss francs.
Green Bonds remain a core component of Ontario’s borrowing program and are an important tool to help finance public transit initiatives, extreme weather-resilient infrastructure, as well as energy efficiency and conservation projects. Ontario remains the largest issuer of Canadian dollar Green Bonds, totalling $24.6 billion issued since 2014–15, with $19.85 billion outstanding.
Interest rates have been within the range forecasted in the 2025 Budget and the 2025 Ontario Economic Outlook and Fiscal Review. As a result, Ontario’s cost of borrowing for 2025–26 remains unchanged at 4.0 per cent. Ontario is estimated to pay Interest and Other Debt Servicing Charges of $16.2 billion, consistent with the 2025 Budget and the 2025 Ontario Economic Outlook and Fiscal Review.
2025–26 Long-Term Borrowing
| Item | Amount |
|---|---|
| Canadian Dollar Issues | 32.3 |
| Foreign Currency Issues | 18.6 |
| Total | 50.9 |
Notes: Numbers may not add due to rounding. As of February 5, 2026.
Source: Ontario Financing Authority.
Ministry of Finance: www.ontario.ca/finance
For general inquiries regarding the 2025–26 Third Quarter Finances, please call or email:
Toll-free English and French inquiries:
Teletypewriter:
Email: FinanceCommunications.fin@ontario.ca
© King’s Printer for Ontario, 2026
Chart Descriptions: Alternative Text for Web Accessibility
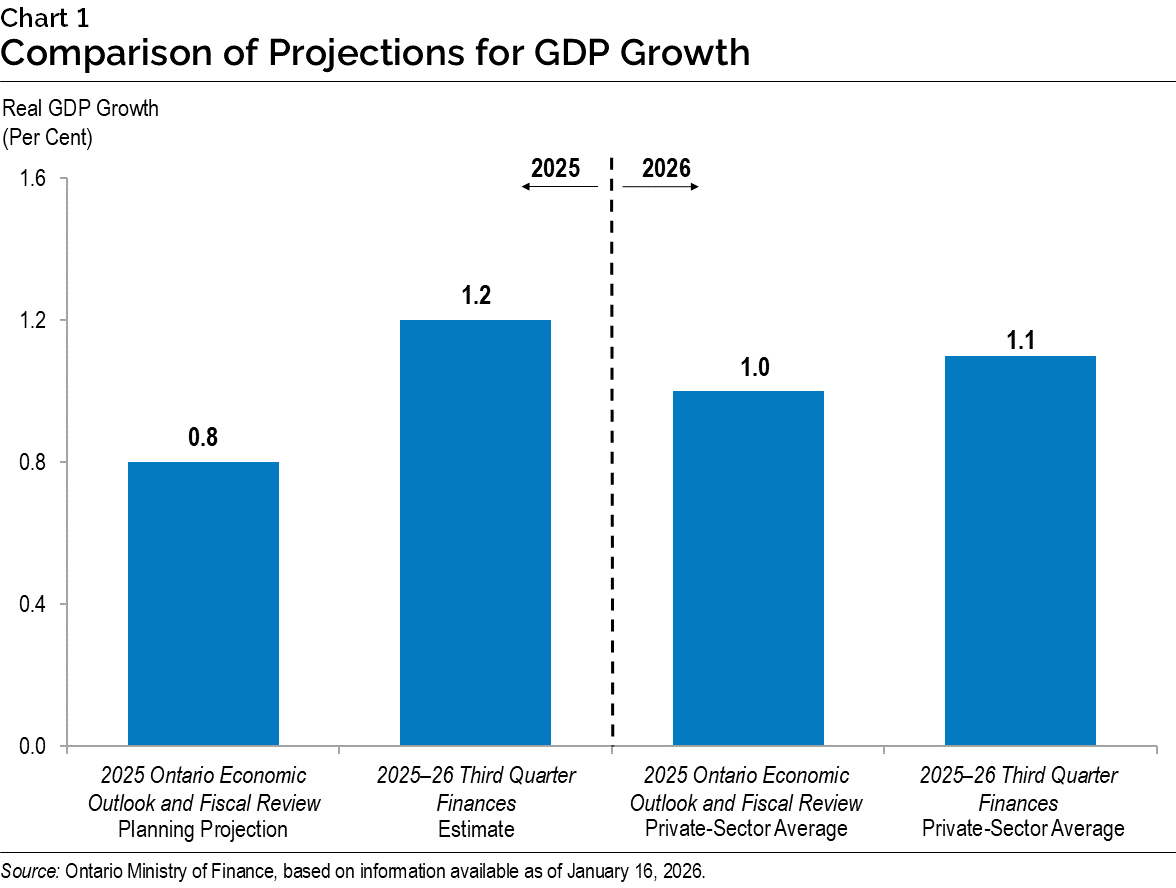
Chart 1: Comparison of Projections for GDP Growth
The bar graph shows the 2025 Ontario Economic Outlook and Fiscal Review planning projection and the 2025–26 Third Quarter Finances estimates for Ontario real GDP growth for 2025, and the 2025 Ontario Economic Outlook and Fiscal Review private-sector average and the 2025–26 Third Quarter Finances private-sector average for Ontario real GDP growth for 2026.
The 2025 Ontario Economic Outlook and Fiscal Review planning projection for Ontario real GDP growth in 2025 was 0.8 per cent. The 2025–26 Third Quarter Finances estimate for Ontario real GDP growth in 2025 is 1.2 per cent.
The 2025 Ontario Economic Outlook and Fiscal Review private-sector average for Ontario real GDP growth in 2026 was 1.0 per cent. The 2025–26 Third Quarter Finances private-sector average for Ontario real GDP growth in 2026 is 1.1 per cent.
Source: Ontario Ministry of Finance, based on information available as of January 16, 2026.
Footnotes
- footnote[1] Back to paragraph Beginning in the 2025 Budget, the Total Revenue, Interest and Other Debt Servicing Charges (IOD), and Total Expense figures for all years have been restated to report interest and investment income as part of revenue and separate from IOD. These changes are fiscally neutral.
- footnote[2] Back to paragraph Beginning in the 2025 Budget, the Total Revenue, Interest and Other Debt Servicing Charges (IOD), and Total Expense figures for all years have been restated to report interest and investment income as part of revenue and separate from IOD. These changes are fiscally neutral.
- footnote[3] Back to paragraph Beginning in the 2025 Budget, the Total Revenue, Interest and Other Debt Servicing Charges (IOD), and Total Expense figures for all years have been restated to report interest and investment income as part of revenue and separate from IOD. These changes are fiscally neutral.
- footnote[4] Back to paragraph Beginning in the 2025 Budget, the Total Revenue, Interest and Other Debt Servicing Charges (IOD), and Total Expense figures for all years have been restated to report interest and investment income as part of revenue and separate from IOD. These changes are fiscally neutral.
- footnote[5] Back to paragraph Ministry expenses have been restated for reclassification and program transfer changes. These changes are fiscally neutral.
- footnote[6] Back to paragraph Includes the estimated cost of tax credit claims for the Regional Opportunities Investment Tax Credit, the Ontario Innovation Tax Credit, the Ontario Business‑Research Institute Tax Credit and the Ontario Made Manufacturing Investment Tax Credit (OMMITC). The OMMITC costs commence in 2023–24 and include costs starting in 2025–26 for the proposed OMMITC enhancement, but not the proposed OMMITC expansion, the impacts of which are reported separately as a revenue decrease.
- footnote[7] Back to paragraph The Ontario Ministry of Long-Term Care total includes expenses incurred by Ontario Health and hospitals for funding for long-term care. These amounts will be consolidated in the total expense of the Ontario Ministry of Health, including $5.7 billion in 2025–26.
- footnote[8] Back to paragraph Interest and Other Debt Servicing Charges is net of interest capitalized during construction of tangible capital assets of $1,412 million in 2025–26.
- footnote[9] Back to paragraph Beginning in the 2025 Budget, the Total Revenue, Interest and Other Debt Servicing Charges (IOD), and Total Expense figures for all years have been restated to report interest and investment income as part of revenue and separate from IOD. These changes are fiscally neutral.
- footnote[10] Back to paragraph Includes provincial investment in capital assets of $24.3 billion.
- footnote[11] Back to paragraph Includes $1,412 million in interest capitalized during construction.
- footnote[12] Back to paragraph Includes transfers to municipalities, universities and non-consolidated agencies.
- footnote[13] Back to paragraph Includes high-speed internet infrastructure, government administration, natural resources, and the culture and tourism industries.
- footnote[14] Back to paragraph Other Partner Funding refers to third–party investments, primarily in hospitals, colleges and schools.
- footnote[15] Back to paragraph Includes federal–municipal contributions to provincial infrastructure investments.
- footnote[16] Back to paragraph Beginning in the 2025 Budget, the Total Revenue, Interest and Other Debt Servicing Charges (IOD), and Total Expense figures for all years have been restated to report interest and investment income as part of revenue and separate from IOD. These changes are fiscally neutral.
- footnote[17] Back to paragraph Actual results for 2023–24 are restated to present an accounting policy change implemented in the Public Accounts of Ontario 2024–25 regarding the calculation of accrued Corporations Tax Revenue.
- footnote[18] Back to paragraph Interest and Other Debt Servicing Charges is net of interest capitalized during construction of tangible capital assets of $694 million in 2022–23, $978 million in 2023–24, $1,221 million in 2024–25 and $1,412 million in 2025–26.
- footnote[19] Back to paragraph Population figures are for July 1 of the fiscal year indicated (i.e., for 2025–26, the population on July 1, 2025 is shown).
- footnote[20] Back to paragraph Starting in the 2025 Budget, Amortization of Capital Assets will be reflected in a separate line in this table to reflect the increasing impact of the capital plan on the borrowing program.