Labour market report, August 2020
Employment in Ontario increased by 141,800 in August. Get the details in this report.
Quick facts
In August 2020:
- There were 12.3 million people in Ontario aged 15 years or older
- 7.9 million (64%) were in the labour force, including those who had worked, were unemployed or did not work at their job, which includes people on temporary layoff because of ongoing COVID-related business closures. The labour force increased by 1.2% (96,600) compared to July
- 7.1 million (57%) were employed, up 2.0% (141,800 jobs) from July. August’s increase marked the third straight month of employment increases
- Ontario's unemployment rate decreased to 10.6% in August from 11.3% in July and 841,400 people were unemployed, down 5.1% (45,200) from July
Important note:
This report is based on the Labour Force Survey (LFS), a household survey carried out by Statistics Canada. August’s LFS results covers labour market conditions as of the week of August 9 to 15.
Ontario’s mandatory closure of non-essential businesses and other measures aimed at addressing the impact of COVID-19 took effect on March 24.
Stage 3 of the Ontario government’s plan for reopening the economy came into effect on July 17 on a regional basis, with Toronto, Peel moving to Stage 3 end of July and Windsor-Essex in early August. (See Stage 3 openings).
The types of businesses that were deemed essential and remained open during the COVID-19 economic shutdown and the types of businesses that reopened at the different stages of the Ontario government’s plan for reopening the economy should be considered in the context of information provided in this report.
Employment increased in August
Employment increased by 141,800 (2.0%) in August, the third consecutive monthly increase since the COVID-19 economic downturn began. In July, Ontario gained 150,700 jobs compared to June.
Over the February to May period, Ontario employment declined by almost 1.2 million, the largest three-month employment decline on record. With August’s increase and net job gains of 670,000 over the past three months, employment is now 6.4% within February’s level.
The total number of hours worked at a main job in Ontario decreased by 8.9% in August 2020 year-to-date compared with August 2019 year-to-date. The decline is even larger for hours worked at all jobs over the same period, at 9.9%.
Chart 1 shows employment in Ontario from January 2015 to August 2020.
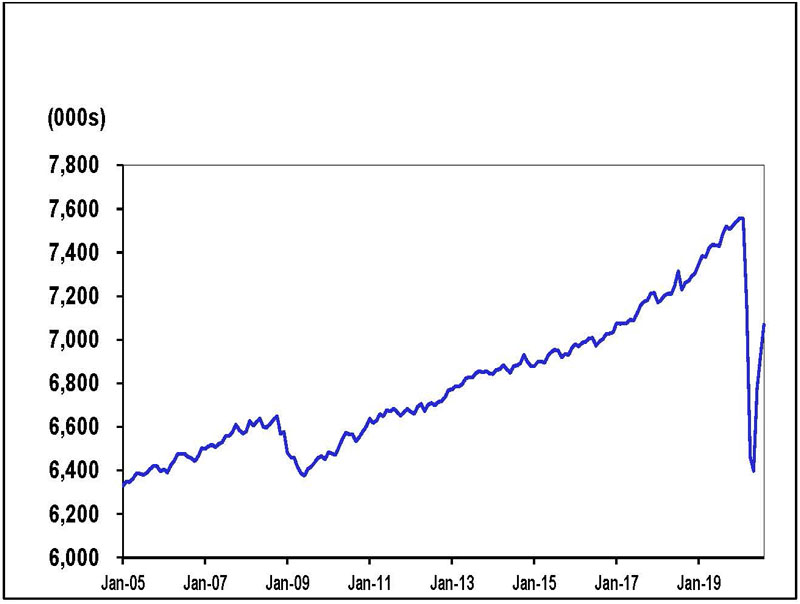
Source: Statistics Canada, Labour Force Survey, Table 14-10-0287-01, (seasonally adjusted data).
Full-time vs. part-time
Full-time jobs accounted for 80% (113,600) of the employment increase in August, while part-time jobs increased by 28,100 in August.
Employment increase by age
Youth employment (those aged 15 to 24) increased by 16,400 in August, after increasing by 58,600 jobs in July. Youth were disproportionally impacted by job losses during the February-May downturn period and generally during downturns. They are also slower to recover jobs after downturns.
Employment for people aged 25 to 54 increased by 86,200 in August, compared to July. Employment for those aged 55 and older increased by 39,200 jobs.
Employment in Canada rose by 245,800 (1.4%) in August. Employment in Canada was still 5.7% below its February 2020 level and now totals 18,091,700.
Employment increase and decrease by industry
The types of businesses that were deemed essential and other measures aimed at addressing the impact of COVID-19 should be considered in the context of employment change by sector.
Most sectors recorded job gains in August. Employment gains were led by accommodation and food services (32,800) followed by educational services (30,100); professional, scientific, and technical services (21,500) and healthcare and social assistance (19,900).
There were notable losses in construction (−15,200), finance, insurance and real estate (−6,200), forestry, fishing, mining, quarrying and oil (−2,200), and transportation and warehousing (−1,400).
Over half (57.0%) of the job losses over the February to May period were concentrated in four sectors — wholesale and retail trade, accommodation and food services, manufacturing and health care and social assistance. These sectors account for almost two-thirds (64.5%) of the jobs gained since May.
Chart 2 shows industries by employment change in Ontario, July 2020 to August 2020.
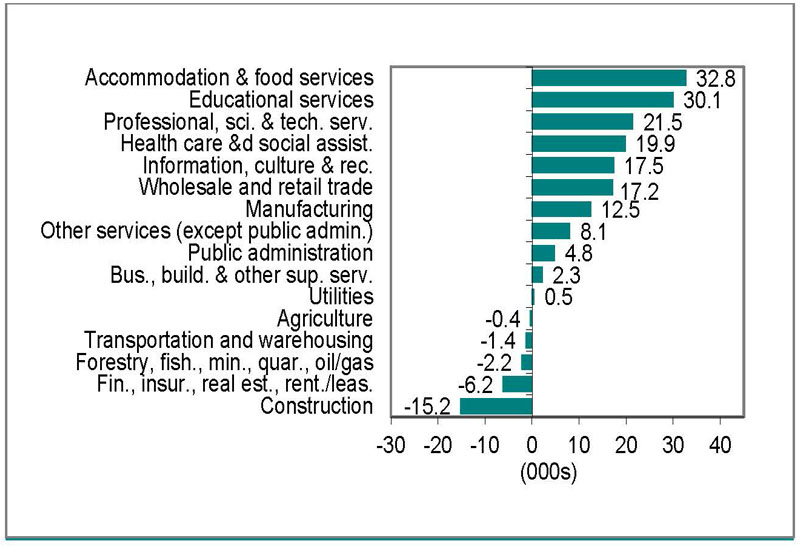
Source: Statistics Canada, Labour Force Survey, Table 14-10-0355-02, (seasonally adjusted data).
Unemployment rate decreased to 10.6%
Chart 3 shows unemployment rates, Ontario and Canada, January 2005 to August 2020.
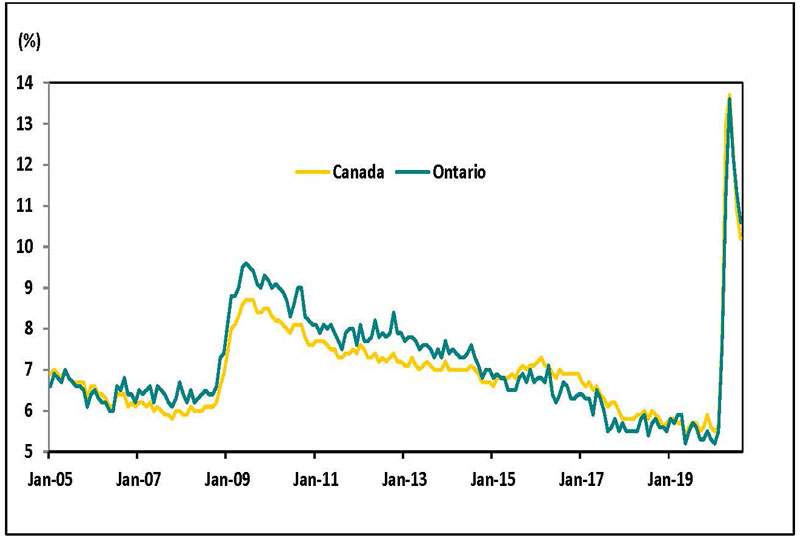
Source: Statistics Canada, Labour Force Survey, Table 14-10-0287-01, (seasonally adjusted data).
Ontario’s unemployment rate in August was 10.6%, down from 11.3% in July. The rate is nearly double the rate in February (5.5%).
Canada’s unemployment rate fell to 10.2% in August from 10.9% in July. In July, the national unemployment rate fell below Ontario’s unemployment rate for the first time since April 2019. The businesses that were fully opened in July and August varied in Ontario by region, as well between Ontario and the rest of Canada due to when some measures aimed at addressing the impact of COVID-19 were lifted. This should be considered in the context of the difference between Ontario’s and the national unemployment rate.
Unemployment rate by age
For individuals aged 15 to 24, the unemployment rate declined to 27.7% from 28.4% in July and remains highest among all age groups. The youth unemployment rate was recorded at a record high of 30.0% in May and June.
The unemployment rate for individuals aged 25 to 54 decreased to 7.6% in August from 8.8% in July and increased to 8.5% from 7.8% for those aged 55 and older.
Employment and unemployment in urban centres
Employment increase in urban centres
Chart 4 shows the rate of employment change for Ontario Census Metropolitan Areas (CMAs) from July 2020 to August 2020.
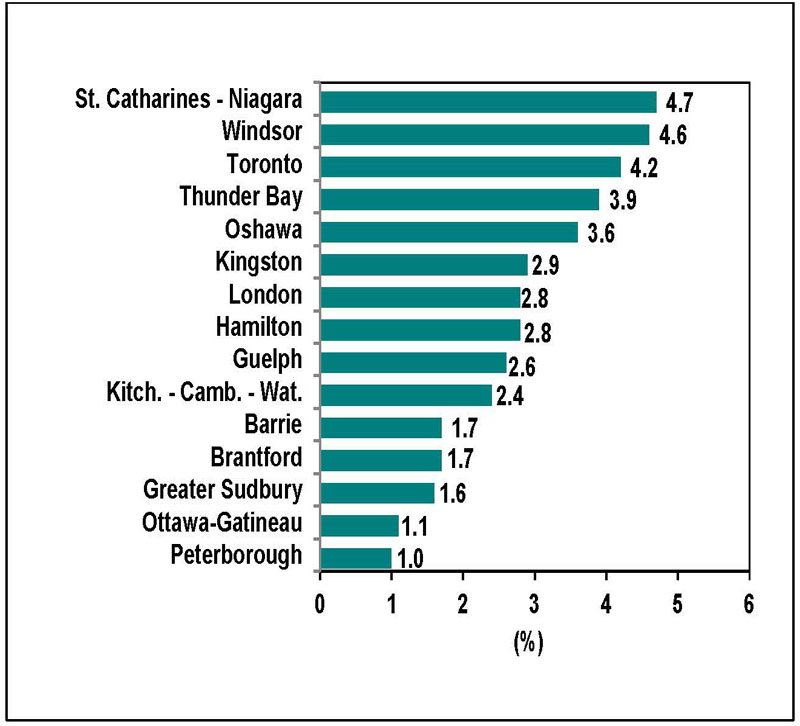
Source: Statistics Canada, Labour Force Survey, Table 14-10-0294-01, (seasonally adjusted data three-month moving average to reduce volatility caused by small sample size).
St. Catharines-Niagara (4.7% or 8,200) recorded the highest percentage employment increase in August compared to July, followed by Windsor (4.6% or 6,800), Toronto (4.2% or 129,500) and Thunder Bay (3.9% or 2,100). The smallest percentage increases were recorded in Peterborough (1.0% or 500), Ottawa-Gatineau, Ontario part (1.1% or 6,200), Greater Sudbury (1.6% or 1,600), Barrie (1.7% or 2,100) and Brantford (1.7% or 1,200).
Employment in all urban centres was below February 2020 levels in August, led by Kitchener-Cambridge-Waterloo (−12.6% or −38,900), Thunder Bay (−12.0% or −7,600), St. Catharines-Niagara (−9.9% or −20,000) and Toronto (−9.8% or −350,300).
Lowest and highest unemployment rates in urban centres
Chart 5 shows Census Metropolitan Areas (CMAs) with highest and lowest unemployment rates in Canada, August 2020.
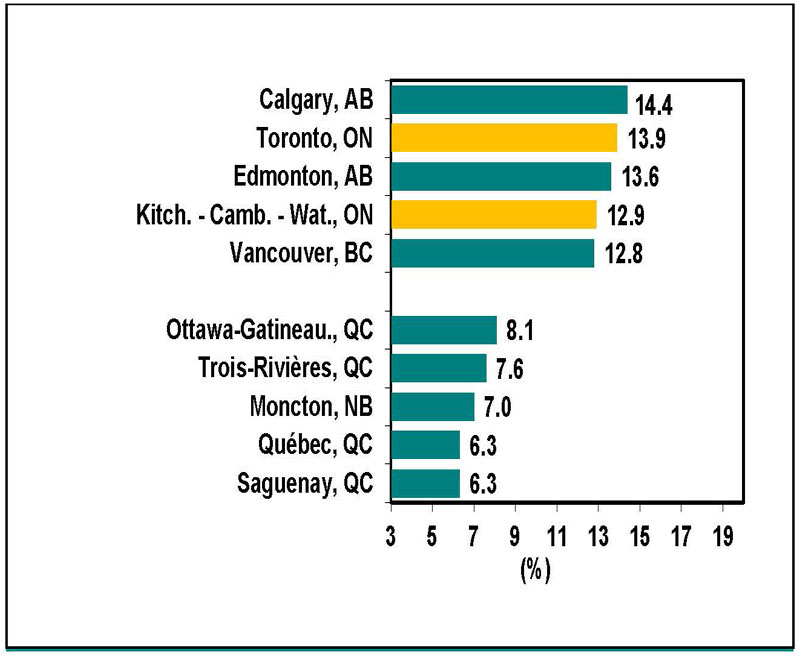
Source: Statistics Canada, Labour Force Survey, Table 14-10-0294-01, (seasonally adjusted data three-month moving average to reduce volatility caused by small sample size).
Toronto recorded the second-highest unemployment rate in Canada in August (13.9%) behind Calgary (14.4%). Toronto did not move to Stage 3 of the Ontario government’s plan for reopening Ontario’s economy until the end of July.
Greater Sudbury recorded the lowest unemployment rate in Ontario in August (8.6%), while the City of Quebec and Saguenay, Quebec were tied for the lowest unemployment rate in Canada (6.3%).
Download data
Source: Statistics Canada, Labour Force Survey
August 2020 Labour Market Report:
- CSV, Chart 1, employment in Ontario from January 2015 to August 2020, 1 Kb
- CSV, Chart 2, industries with highest and lowest employment change in Ontario, July 2020 to August 2020, 2 Kb
- CSV, Chart 3, unemployment rates, Ontario and Canada, January 2015 to August 2020, 2 Kb
- CSV, Chart 4, the rate of employment change for Ontario Census Metropolitan Areas (CMAs) from July 2020 to August 2020, 99 Kb
- CSV, Chart 5, Census Metropolitan Areas (CMAs) highest and lowest unemployment rates, August 2020, 12 Kb