Labour market report, January 2017
Employment in Ontario increased in January. Get the details in this report.
Quick facts
In January 2017, there were 11.6 million people in Ontario aged 15 years or older. Of this population, 7.6 million people, or 65%, were either working or actively looking for work. 7.1 million people were employed and 80% of them had a full time job.
The unemployment rate was 6.4% and 484,800 people were unemployed.
Employment increased in January
Chart 1 shows employment in Ontario, January 2012 to January 2017.

Source: Statistics Canada, Labour Force Survey (seasonally adjusted data).
Ontario gained 28,800 net-new jobs in January 2017, following an increase of 6,400 jobs in December 2016. This is the largest monthly gain since December 2015, when 30,100 jobs were added.
Employment in Canada rose by 48,300 jobs in January. This follows a gain of 46,100 the previous month.
Full-time vs. part-time
The number of full-time jobs grew by 5,300 in January 2017. Part-time jobs increased by 23,500.
Employment increase/decrease by age
People ages 25 to 54 years old recorded job gains of 25,700, as well as another 6,500 job gains from those aged 55 and older, in January 2017.
At the same time, youth employment fell in January. Jobs for 15 to 24 year olds decreased by 3,400, after a decrease of 12,500 jobs in December 2016.
Unemployment rate unchanged at 6.4%
Chart 2 shows unemployment rates, Ontario and Canada, January 2012 to January 2017.
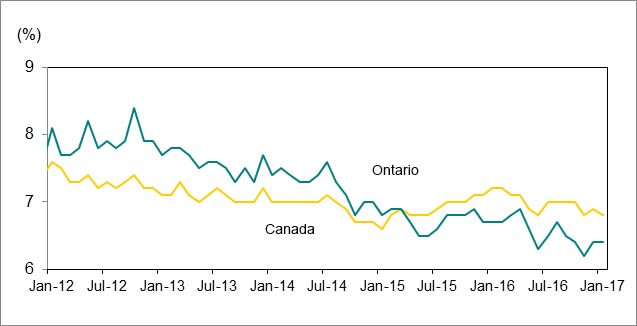
Source: Statistics Canada, Labour Force Survey (seasonally adjusted data).
Ontario’s unemployment rate remained at 6.4% in January 2017, as the number of people unemployed or looking for work increased by 34,300.
This continues a trend of an unemployment rate under 7.0% that started two years earlier – in January 2015.
The provincial unemployment rate has been lower than the Canadian rate for more than a year and a half. The national unemployment rate fell to 6.8% in January 2017 from 6.9% in December 2016.
Rise in youth unemployment rate
Ontario’s youth unemployment rate, 15 to 24 years old, increased to 15.6% in January from 14.2% in December 2016.
Unemployment rate for adults
The unemployment rate for people 25 to 54 years old decreased to 4.9% in January from 5.2% in December 2016.
The rate for those 55 years and older was unchanged at 4.7%.
Lowest and highest unemployment rates
Chart 3 shows Census Metropolitan Areas (CMAs) with highest and lowest unemployment rates in Canada, January 2017.
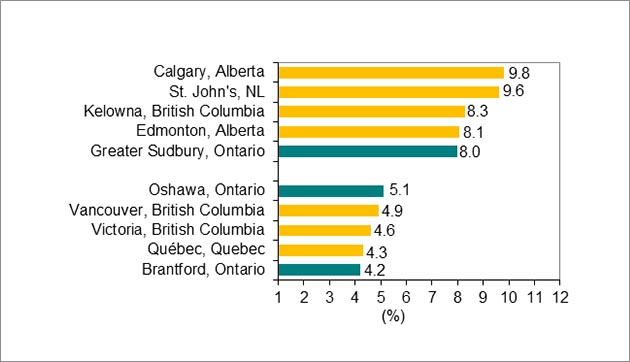
Source: Statistics Canada, Labour Forces Survey, (seasonally adjusted, 3-month moving average data). Estimates are 3-month moving averages to reduce volatility caused by small sample size.
Brantford, a city in southwestern Ontario, had the lowest unemployment rate for January 2017 at 4.2%. Oshawa ranked among those Census Metropolitan Areas (CMAs) with the lowest unemployment rate, at 5.1%.
The highest unemployment rate in Ontario for January 2017 occurred in northeastern Ontario. Greater Sudbury had a rate of 8.0%.
Calgary recorded the highest unemployment rate nationally, at 9.8%.
Year-over-year comparisons
Employment increase/decrease by education level
Employment increased by 103,600 jobs for people 25 years of age and between January 2016 and January 2017:
- People with a high-school level of education gained the most jobs (71,300) between January 2016 and January 2017.
- People who have completed a level of post-secondary education (PSE) also gained jobs between January 2016 and January 2017. How many jobs were added differed depending on the type of certification:
- university degree (60,300)
- certificate or diploma (+15,400)
People with less than high-school education lost jobs (38,700), as was the case for. those with some PSE lost 4,700 jobs. These are people who have some post-secondary education but who have not graduated.
Chart 4 shows Ontario employment change by highest level of educational attainment, aged 25 and older, between January 2016 and January 2017.
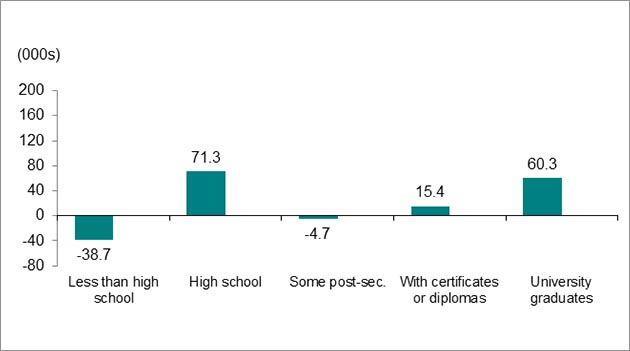
Source: Statistics Canada, Labour Force Survey (unadjusted data).
Unemployment rate by education level
The unemployment rate in January 2017 was:
- 4.4% for people aged 25 and older with a post-secondary degree, diploma or certificate, down from 4.9% a year earlier
- 6.8% for people aged 25 and older without a post-secondary degree, diploma or certificate, down from 8.2% a year earlier
Employment increase and decrease by occupation
Chart 5 shows Ontario employment growth by occupation change between January 2016 and January 2017.

Source: Statistics Canada, Labour Forces Survey (unadjusted data).
Seven of the ten major occupational groups in Ontario recorded employment growth in January 2017 compared to a year earlier.
Learn more about the National Occupation Classification (NOC) system.
These occupations gained the most jobs:
- Management (41,200)
- Art, culture, recreation and sport (30,900)
- Trades, transport, equipment operators and related trades (30,500)
People in these occupations lost jobs:
- Business, finance and administration sales and service (56,200)
- Natural resources and related (4,100)
- Education, law, social, community and government services (900)
Long-term unemployment decreased
Chart 6 shows Ontario’s long-term unemployed (27 weeks or more) as a share of total unemployment, January 2009 to January 2017.
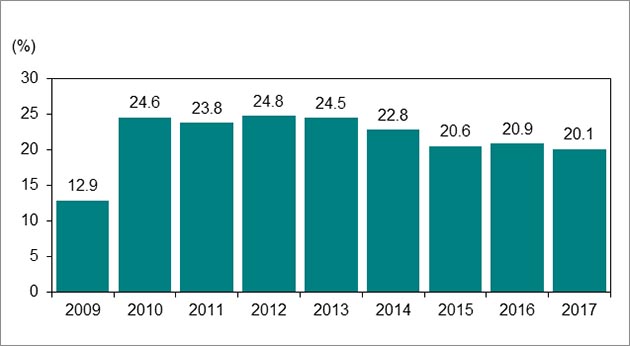
Source: Statistics Canada, Labour Force Survey (unadjusted data).
In January 2017, an estimated 97,900 people in Ontario were long-term unemployed for 27 weeks or more, defined as long-term unemployment. This is down from 105,000 in January 2016.
Long-term unemployed individuals accounted for 20.1% of the total number of unemployed people. Compare this to:
- 20.9% in January 2016
- 11.7% in January 2008, the year of the recession
Average time in long-term unemployment
The average time in long-term unemployment increased to 19.3 weeks In January 2017 from 19.1 weeks a year earlier.