Ontario energy quarterly: oil and gas in Q3 2020
Read an up-to-date snapshot of Ontario’s oil and gas sector for July to September 2020.
Overview
Download the data used to create this report from the Ontario open data catalogue.
| Regular gasoline | $1.04 |
|---|---|
| Diesel | $0.98 |
Source: Ministry of Energy, Northern Development and Mines (ENDM) fuel prices.
| Dawn (ON) | $2.31 |
|---|---|
| Henry Hub (US) | $2.52 |
| AECO (AB) | $2.14 |
Source: Dawn and AECO from Canadian Enerdata Ltd.; Henry Hub from U.S. Energy Information Administration.
| Enbridge Gas Inc. Enbridge Gas Distribution (EGD) Zone | 14.55¢ |
|---|---|
| Union Gas (Union) North East Zone | 16.19¢ |
| Union North West Zone | 8.21¢ |
| Union South Zone | 12.96¢ |
| EPCOR | 12.91¢ |
Source: OEB Natural Gas Rates effective July 1, 2020.
Ontario natural gas storage level (at quarter end)
308.8 Petajoule (PJ) (closing inventories, August 2020)
Source: Statistics Canada.
In Ontario, natural gas is stored primarily at the Dawn hub near Sarnia.
Natural gas transmission infrastructure

This map displays Ontario's Natural Gas Transmission infrastructure, including the TC Energy Mainline, Enbridge Gas Inc., storage area, and interconnection points.
Regular gasoline retail prices
| Year (Q3) | Ontario average | Southern Ontario average | Northern Ontario average | Toronto average | Ottawa | Sudbury | Thunder Bay |
|---|---|---|---|---|---|---|---|
| 2011 | 1.28 | 1.27 | 1.32 | 1.28 | 1.27 | 1.31 | 1.32 |
| 2012 | 1.28 | 1.27 | 1.33 | 1.28 | 1.24 | 1.32 | 1.35 |
| 2013 | 1.3 | 1.29 | 1.35 | 1.3 | 1.29 | 1.34 | 1.37 |
| 2014 | 1.32 | 1.31 | 1.39 | 1.32 | 1.29 | 1.38 | 1.41 |
| 2015 | 1.11 | 1.1 | 1.19 | 1.12 | 1.08 | 1.15 | 1.24 |
| 2016 | 1.01 | 1 | 1.07 | 1.01 | 0.98 | 1.03 | 1.15 |
| 2017 | 1.12 | 1.12 | 1.16 | 1.14 | 1.08 | 1.15 | 1.17 |
| 2018 | 1.32 | 1.31 | 1.38 | 1.33 | 1.26 | 1.36 | 1.45 |
| 2019 | 1.21 | 1.2 | 1.27 | 1.2 | 1.19 | 1.25 | 1.34 |
| 2020 | 1.04 | 1.03 | 1.11 | 1.03 | 1.02 | 1.08 | 1.17 |
Source: ENDM. All prices in Current Dollars per litre. Provincial, Southern and Northern Ontario averages are weighted by population.
Fuels price survey information
Toronto
Note: Retail gasoline prices are affected by crude oil prices, wholesale gasoline prices, and competition in the local retail gasoline market. Prices vary from city to city because of differences in market size and structure, costs, and the degree of local competition.
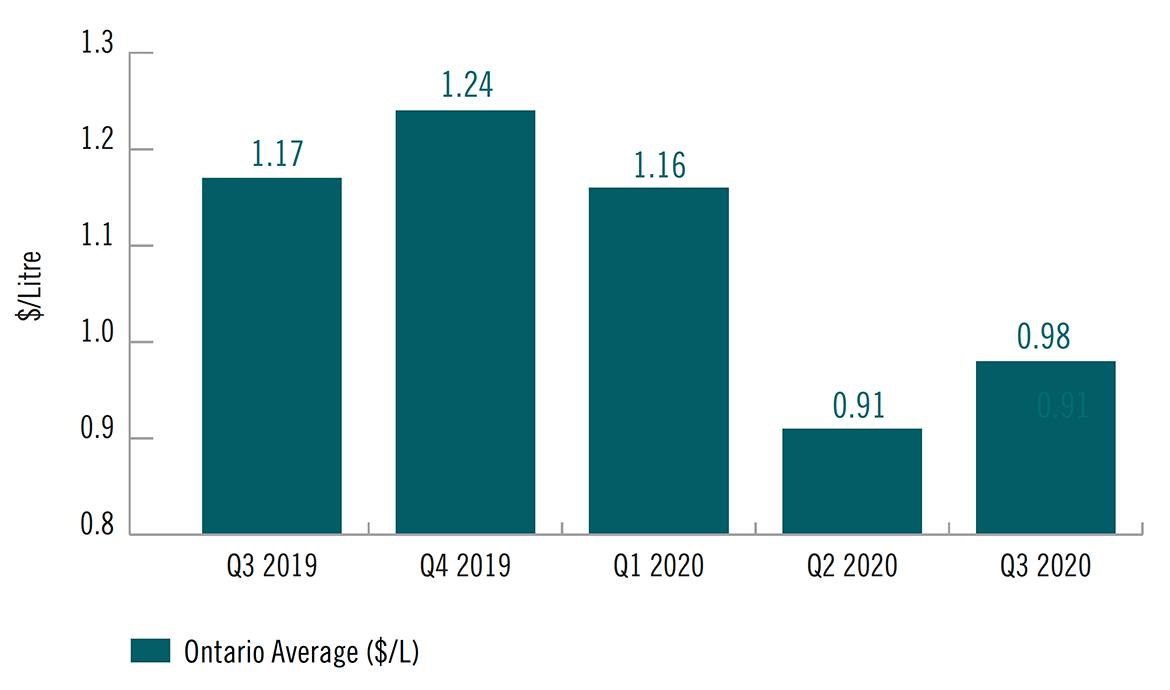
Ontario average retail gasoline price ($/L)

This bar graph displays the average regular gasoline price in Ontario by quarter between Q3 2019 and Q3 2020, in dollars per litre.
Pump price revenue shares, regular unleaded, Toronto

This bar graph displays a comparison of the average regular gasoline prices in Ontario for Q3 2019 and Q3 2020, in dollars per litre.
Retail diesel prices
| Year (Q3) | Ontario average | Southern Ontario average | Northern Ontario average | Toronto average | Ottawa | Sudbury | Thunder Bay |
|---|---|---|---|---|---|---|---|
| 2011 | 1.23 | 1.23 | 1.24 | 1.23 | 1.24 | 1.25 | 1.24 |
| 2012 | 1.21 | 1.21 | 1.25 | 1.21 | 1.22 | 1.23 | 1.27 |
| 2013 | 1.25 | 1.25 | 1.29 | 1.25 | 1.27 | 1.28 | 1.33 |
| 2014 | 1.28 | 1.27 | 1.32 | 1.27 | 1.29 | 1.28 | 1.38 |
| 2015 | 1.05 | 1.04 | 1.08 | 1.05 | 1.04 | 1.05 | 1.1 |
| 2016 | 0.93 | 0.93 | 0.98 | 0.93 | 0.92 | 0.92 | 1.04 |
| 2017 | 1.03 | 1.02 | 1.06 | 1.02 | 1.02 | 1.04 | 1.09 |
| 2018 | 1.29 | 1.28 | 1.33 | 1.28 | 1.29 | 1.3 | 1.37 |
| 2019 | 1.17 | 1.16 | 1.22 | 1.16 | 1.17 | 1.16 | 1.29 |
| 2020 | 0.98 | 0.97 | 1.02 | 0.97 | 0.98 | 0.99 | 1.06 |
Source: ENDM. All prices in Current Dollars per litre. Provincial, Southern and Northern Ontario averages are weighted by population.
Fuels price survey information
Toronto
Note: Retail diesel prices are affected by crude oil prices, wholesale diesel prices, and competition in the local retail diesel market. Prices vary from city to city because of differences in market size and structure, costs, and the degree of local competition.
Ontario average retail diesel price ($/L)
This bar graph displays the average regular diesel price in Ontario by quarter between Q3 2019 and Q3 2020, in dollars per litre.
Pump price revenue shares, ultra-low sulphur diesel, Toronto

This bar graph displays a comparison of the average regular diesel prices in Ontario for Q3 2019 and Q3 2020, in dollars per litre.
Natural gas prices with storage and transportation costs for Enbridge Gas Inc., and EPCOR
| Q3 ¢/m3 | 2016 | 2017 | 2018 | 2019 | 2020 |
|---|---|---|---|---|---|
| Enbridge Gas Inc. EGD Zone |
17.33 | 19.86 | 15.98 | 17.72 | 14.55 |
| Enbridge Gas Inc. Union North East Zone |
19.28 | 27.53 | 22.21 | 22.87 | 16.19 |
| Enbridge Gas Inc. Union North West Zone |
17.24 | 21.22 | 17.58 | 17.29 | 8.21 |
| Enbridge Gas Inc. Union South Zone |
14.53 | 19.95 | 14.67 | 17.03 | 12.96 |
| EPCOR |
15.58 | 19.19 | 15.28 | 16.89 | 12.91 |
Source: OEB Natural Gas Rates effective July 1, 2020.
Ontario’s OEB rate-regulated natural gas rate zones

Source: Enbridge Gas Inc, ENDM.
A map showing the regions of Ontario with access to Ontario Energy Board rate regulated natural gas and where each rate zone is.
Ontario has five primary natural gas rate zones, which are rate-regulated by the Ontario Energy Board (OEB). Kitchener Utilities, and Utilities Kingston also operate in Ontario, but are not rate-regulated by the OEB.
Each quarter, OEB rate-regulated natural gas utilities adjust their gas supply charges based on a forecast of natural gas market prices over the next 12 months. Some components of these rates, such as the transportation charge, may change at the same time. Other components follow a different timeline, like delivery rates, which generally change once a year. Additionally, the “gas supply cost adjustment” is updated through the OEB's Quarterly Rate Adjustment Mechanism (QRAM),
Following approval from the OEB, effective January 1, 2017, the price for the Union South Rate zone combined commodity and transportation costs into one gas supply charge going forward. For consistency of reporting, storage and transportation costs have been included in this section for all rate zones.
Effective October 1, 2018, the OEB removed provincial cap-and-trade costs in conjunction with the QRAM for Q4 2018. The removal of cap-and-trade costs resulted in a reduction of about 3.3 ¢/m3 from the delivery charge component of natural gas bills.
Effective January 1, 2019, Enbridge Gas Distribution (EGD) and Union Gas (Union) amalgamated to become Enbridge Gas Inc., however EGD and Union will continue to operate as distinct rate zones for the immediate term.
On April 1, 2019, the federal carbon tax came into effect at a rate of 3.91 ¢/m3 for natural gas. Effective August 1, 2019, the OEB approved the collection of the federal carbon tax through a new line item on natural gas bills. The federal carbon tax was therefore absent from Ontario natural gas bills during Q3 2019. Effective April 1, 2020, the federal carbon tax increased to 5.87 ¢/m3 for natural gas.
In light of economic pressures from the COVID-19 pandemic, the OEB granted Enbridge a deferral to its July 1, 2020 QRAM application and postponed commodity cost increases. Enbridge customers did not see changes to their natural gas rates for Q3 2020. EPCOR did not seek such a deferral, and EPCOR customers saw slight decreases to their bills effective July 1, 2020.
Natural gas price, including storage and transportation by quarter (¢/m3)

Source: Ontario Energy Board, Enbridge Gas Inc.
These bar graphs display natural gas prices, including storage and transportation, in cents per cubic metre, for each quarter from Q3 2019 to Q3 2020. The prices are for the EGO Zone, Union North East Zone, Union North West Zone, Union South Zone and EPCOR.
Average natural gas spot prices
Monthly average natural gas spot prices at select trading hubs ($/GJ)

Source: Dawn and AECO from Canadian Enerdata Ltd.; Henry Hub from U.S. Energy Information Administration; forecasts from Deloitte Price Forecast - Oil, Natural Gas, & Chemicals - June 30, 2020. Forecast prices are in "Current" dollars, prior to unit conversion and dollar exchange.
Note: Prices for Dawn, Henry Hub, and AECO between Jan. 2019 and September 2019 are based upon daily closing spot prices. Prices prior to Jan 2019, and between September 2019 and May 2020, Dawn and AECO are based upon daily traded averages. As of June 2020, the monthly Dawn is based upon the month ahead price.
This line graph displays the monthly average natural gas spot prices at Dawn, Ontario, in dollars per gigajoule, every month from September 2019 to September 2020.
Quarterly average natural gas spot prices at select trading hubs ($/GJ)
| Trading Hub | Q3 2019 | Q3 2019 | Q3 2019 | Q4 2019 | Q3 2020 |
|---|---|---|---|---|---|
| Dawn (ON) | 2.67 | 2.8 | 2.23 | 2.1 | 2.31 |
| Henry Hub (US) | 2.97 | 2.99 | 2.45 | 2.15 | 2.52 |
| AECO (AB) | 0.95 | 2.33 | 1.93 | 1.89 | 2.14 |
Source: Dawn and AECO from Canadian Enerdata Ltd.; Henry Hub from U.S. Energy Information Administration.
Note: Note: Prices for Dawn, Henry Hub, and AECO between Jan. 2019 and September 2019 are based upon daily closing spot prices. Prices prior to Jan 2019, and between September 2019 and May 2020, Dawn and AECO are based upon daily traded averages. As of June 2020, the monthly Dawn is based upon the month ahead price.
Annual Average Natural Gas Spot Prices at Select Trading Hubs ($/GJ)
| Trading Hub | 2019 | 2020 (YTD) |
|---|---|---|
| Dawn (ON) | 3.03 | 2.21 |
| Henry Hub (US) | 3.22 | 2.37 |
| AECO (AB) | 1.69 | 1.99 |
Source: Dawn and AECO from Canadian Enerdata Ltd.; Henry Hub from U.S. Energy Information Administration.
Note: Prices for Dawn, Henry Hub, and AECO between Jan. 2019 and September 2019 are based upon daily closing spot prices. Prices prior to Jan 2019, and between September 2019 and May 2020, Dawn and AECO are based upon daily traded averages. As of June 2020, the monthly Dawn is based upon the month ahead price.
Natural Gas Price Forecasts for Select Trading Hubs, 2021-2022 ($/GJ)
| Trading Hub | 2021 | 2022 (YTD) |
|---|---|---|
| Dawn (ON) | 3.13 | 3.32 |
| Henry Hub (US) | 3.49 | 3.62 |
| AECO (AB) | 2.52 | 2.57 |
Source: Deloitte Price Forecast - Oil, Natural Gas, & Chemicals - June 30, 2020.
Ontario natural gas storage balances
Monthly closing inventories in Ontario (PJ)

Source: Statistics Canada.
Note: Previous editions of this table featured total Eastern Canadian storage levels in billion cubic feet (bcf) and million cubic meteres (mcm).
This line graph displays Ontario natural gas storage balances every quarter from Nov 2016 to Aug 2020.
In Ontario, natural gas is stored primarily at Dawn, ON.
According to seasonal patterns, storage levels normally peak in late October or early November as withdrawals for natural gas heating begin to outpace storage injections. Prices are also more likely to see a cyclical rise during the winter heating season. Utilities buy a certain amount of natural gas during the summer months when the price is cheaper. The supply is stored, and then delivered to customers during the colder months.
Average Monthly Natural Gas Bills
While natural gas prices are set quarterly, natural gas customers are billed on a monthly basis. As natural gas consumption patterns change from month to month, so too does the size of a customer's natural gas bill. Therefore, while natural gas rates stay the same over a three month period, the size of the bill can vary based upon the level of consumption, with seasonality being the greatest factor (i.e., heating demand during periods of cold weather).
The natural gas bill for a residential customer in Ontario has five primary components:
- Customer Charge: a fixed charge that is typically set annually, and is the same every month, regardless of the level of consumption;
- Gas Supply: a volumetric charge based upon consumption, set quarterly;
- Delivery Charges: volumetric charges based upon consumption, typically set annually;
- Federal Carbon Charge (FCC): a volumetric charge based upon consumption, set annually by the federal government; and
- Harmonised Sales Tax (HST): a 13% tax on the retail price (i.e., the combination of all charges mentioned above).
Average Monthly EGD Bill

Average Monthly Union NE Bill

Average Monthly Union NW Bill

Average Monthly Union S Bill

Average Monthly EPCOR Bill

Source: OEB
Note: All data based on averages of monthly consumption provided in OEB Bill Calculator for residential customers.
Propane Market
Ontario’s propane market is not subject to economic regulation or oversight by the Ontario Energy Board (OEB). Wholesale propane commodity prices are determined in a competitive, integrated North American market. In Ontario, propane distributors compete to supply end-users and retail prices are set through transactions between a distributor and a customer based on a number of factors including: local supply and demand; time of year; and transportation costs.
Mont Belvieu, Texas is the benchmark pricing point for North American propane markets, as it is the largest producing region.
Sarnia has significant underground storage infrastructure for propane and is a wholesale storage and trading hub for propane markets in Eastern Canadian and the U.S. Great Lakes region. Demand for propane is highly seasonal so storage inventories are replenished in the summer months to be drawn upon for the next winter heating season.
Similar to natural gas, propane prices tend to decrease in the summer months, and increase in the winter heating season. The length and severity of the winter will typically have a corresponding impact on the price of propane.
Due to the unregulated nature of the propane market and limited pricing data from private sector suppliers, ENDM does not maintain historical retail prices for the residential propane market.
Monthly Average Wholesale Propane Prices

Source: U.S. Energy Information Administration, Kent Group Ltd..
Eastern Canadian Propane Inventories
Monthly Propane Storage Supplies for Eastern Canada

Source: Canada Energy Regulator.
Footnotes
- footnote[1] Back to paragraph Toronto was selected for the pump price analysis because it is the largest gasoline market in Ontario.
- footnote[2] Back to paragraph The federal carbon tax on gasoline came into effect on April 1, 2019 at a rate of 4.4 cents per litre. Effective April 1, 2020, the federal carbon tax Increased to 6.6 cents per litre of gasoline.
- footnote[3] Back to paragraph EGD residential Rate Number 1.
- footnote[4] Back to paragraph Union residential North East Rate Zone 01A. Note: 2016 rates are a combined average of the former “Northern” and “Eastern” rate zones.
- footnote[5] Back to paragraph Union residential North West Rate Zone 01A. Note: 2016 rates are a combined average of the former “Fort Frances”, “Western”, and “Northern” rate zones.
- footnote[6] Back to paragraph Union residential Southern Rate Zone M1.
- footnote[7] Back to paragraph On August 3, 2017, the OEB released its decision approving the application by Natural Resource Gas Limited (NRG) to transfer its natural gas distribution system assets and OEB regulatory approvals to EPCOR. On November 1, 2017,the transaction was completed.
- footnote[8] Back to paragraph For more information on the OEB's QRAM prices please see: Natural gas rates page on the OEB website
- footnote[9] Back to paragraph EGD pricing includes an estimated storage component.