Technical Guide
Introduction
This guide outlines the grant parameters for the 2026 Ontario Municipal Partnership Fund (OMPF). It is intended to provide a technical overview of the funding program.
Overview
The OMPF is the Province’s main general assistance grant to municipalities.
The program primarily supports northern and rural municipalities across the province. Its objectives are to:
- recognize the challenges of northern and rural municipalities, while targeting funding to those with more challenging fiscal circumstances
- support areas with limited property assessment
- assist municipalities that are adjusting to year-over-year funding changes.
2026 OMPF — Program Details
In 2026, the Province will provide a total of $600 million in unconditional funding to 388 municipalities through the OMPF. This includes an additional $50 million enhancement to the program that is distributed across all core grant components of the OMPF to further support small, northern, and rural municipalities.
The program will continue to be responsive to municipal circumstances through annual data updates and related adjustments.
What’s New For 2026
On October 30, 2024, the government announced that the program will be increasing by $100 million over two years, beginning with a $50 million enhancement in 2025 and a further $50 million enhancement in 2026.
Following consultations with municipalities in 2025 to inform the program design, the 2026 program will:
- Further recognize the challenges of northern municipalities by enhancing the Northern Communities Grant component to $121 million from $105 million in 2025.
- Continue supporting rural and small communities across the province through the Rural Communities Grant component, which will increase to $187 million from $171 million in 2025. The farm enhancement of the Rural Communities Grant component will grow by $2 million in 2026 to further support municipalities with the highest levels of farm land.
- Increase targeted support to northern and rural municipalities with more challenging fiscal circumstances by increasing the Northern and Rural Fiscal Circumstances Grant component to $125 million from $109 million in 2025.
- Enhance support to municipalities with limited property assessment by increasing the Assessment Equalization Grant component to $161 million from $155 million in 2025.
In addition to the enhancements to the four core grant components, the program will continue to include Transitional Assistance minimum funding guarantees for core grant recipient municipalities. Specifically, for municipalities receiving core grant funding, minimum funding guarantees have been set at 85 per cent for southern Ontario and 90 per cent for northern Ontario. This means that municipalities receiving core grants in southern Ontario will receive at least 85 per cent of their 2025 OMPF allocation and northern municipalities receiving core grants will receive at least 90 per cent of their 2025 OMPF allocation.
These minimum levels of support will continue to be enhanced, up to 100 per cent, for eligible northern and rural municipalities across the province with more challenging fiscal circumstances, as measured by the Northern and Rural Municipal Fiscal Circumstances Index (MFCI).
Furthermore, the program will introduce an adjustment to Transitional Assistance for municipalities that are ineligible for core grant components. For these municipalities, where funding is entirely composed of Transitional Assistance, the percentage funding guarantees used in Transitional Assistance will be adjusted to gradually phase out this funding over a five-year period. Beginning in 2026, municipalities that do not qualify for OMPF core grants and only receive Transitional Assistance will receive 80 per cent of their 2025 OMPF allocation. See Transitional Assistance for details.
2026 Ontario Municipal Partnership Fund
The 2026 OMPF will provide a total of $600 million to 388 municipalities across the province through the following four core grant components and Transitional Assistance.
1. Assessment Equalization Grant Component — $161 million
Provides funding to eligible municipalities with limited property assessment.
2. Northern Communities Grant Component — $121 million
Provides funding to all northern municipalities in recognition of their unique challenges.
3. Rural Communities Grant Component — $187 million*
Provides funding to rural municipalities, including targeted funding for rural farming communities, in recognition of their unique challenges.
4. Northern and Rural Fiscal Circumstances Grant Component — $125 million
Provides additional, targeted funding to northern and rural municipalities based on their fiscal circumstances.
In addition, the OMPF program provides:
Transitional Assistance — $6 million
Ensures a guaranteed level of support to municipalities based on their 2025 OMPF allocation.
*Note: Funding allocated through the Rural Communities Grant component includes the Minimum Base Funding Top-Up to ensure small, northern, and rural municipalities receive at least $100,000 in combined base funding through the Northern Communities and Rural Communities Grant components.
Figures are rounded.
2026 OMPF Core Grant Components
1. Assessment Equalization Grant
The Assessment Equalization Grant provides funding to eligible single- and lower-tier municipalities with limited property assessment due to lower property values and/or limited non-residential assessment.
To determine the grant amount, a total assessment differential (that is, the total municipal assessment below the provincial median per-household threshold of $307,000) is calculated for each municipality. Single- and lower-tier municipalities receive funding based on the total assessment differential. Funding provided through this grant increases the further a municipality’s total weighted assessment per household is below the provincial median.
Every $10,000 increment in a municipality’s total assessment differential results in an additional $30.80 in funding.
Example 1.1
Municipality A:
- Weighted assessment per household: $200,000
- Assessment per household below the $307,000 threshold: $307,000 − $200,000 = $107,000
- Number of households: 2,000
- Total assessment differential: $107,000 × 2,000 = $214,000,000
Grant Amount: $214,000,000 / $10,000 × $30.80 = $659,120
2. Northern Communities
The Northern Communities Grant provides funding to all northern municipalities in recognition of the unique challenges they face.
The grant is based on the number of households, and the per-household amount is $318.
Example 2.1
Municipality A (Northern):
- Number of households: 1,300
Grant Amount: 1,300 × $318 = $413,400
3. Rural Communities Grant
The Rural Communities Grant recognizes the unique challenges of rural municipalities and particularly those of rural farming communities.
The Rural Communities Grant provides funding to single- and lower-tier municipalities across the province based on the proportion of their population residing in rural areas and/or small communities, as measured by the Rural and Small Community Measure (RSCM).
Municipalities with an RSCM of 75 per cent or more receive $152 per household. Municipalities with an RSCM between 25 per cent and 75 per cent receive a portion of this funding on a sliding scale. For additional information on the RSCM, see Appendix A.
Every 5-percentage point increase in the RSCM between 25 per cent and 75 per cent results in an additional $15.20 per household:
| Item | RSCM 25% | RSCM 30% | RSCM 35% | RSCM 40% | RSCM 45% | RSCM 50% | RSCM 55% | RSCM 60% | RSCM 65% | RSCM 70% | RSCM 75+% |
|---|---|---|---|---|---|---|---|---|---|---|---|
| Per‑household amount ($) | 0.00 | 15.20 | 30.40 | 45.60 | 60.80 | 76.00 | 91.20 | 106.40 | 121.60 | 136.80 | 152.00 |
[*]The per-household amounts above are for municipalities where 70 per cent or less of municipal land area is comprised of farm land.
Example 3.1
Municipality A:
- RSCM: 80%
- Number of households: 3,000
Grant Amount: 3,000 × $152 = $456,000
Municipality B:
- RSCM: 55%
- Number of households: 3,000
Grant Amount: 3,000 × $91.20 = $273,600
Minimum Base Funding Top-Up
The Minimum Base Funding Top-Up ensures that small, northern, and rural municipalities receive at least $100,000 in combined base funding through the Northern Communities and Rural Communities Grant components.
Municipalities are eligible for the Minimum Base Funding Top-Up if they have less than 1,000 households and receive less than $100,000 in combined northern and rural base funding. Northern and rural base funding refers to funding provided through the Northern Communities Grant and Rural Communities Grant (excluding farm enhancement provided to municipalities with the highest levels of farm land).
Example 3.2
Municipality A (Northern and Rural, less than 1,000 households):
- Households: 120
- Northern Communities Grant Allocation: $38,160
- Rural Communities Grant Base Allocation (excludes farm enhancement): $18,240
- Minimum Base Funding Amount: $100,000
- Northern and Rural Communities Combined Base Funding: $38,160 + $18,240 = $56,400
Minimum Base Funding Top-Up: $100,000 − $56,400 = $43,600
Example 3.3
Municipality B (Southern and Rural, less than 1,000 households):
- Households: 400
- Northern Communities Grant Allocation: $0
- Rural Communities Grant Base Allocation (excludes farm enhancement): $60,800
- Minimum Base Funding Amount: $100,000
- Northern and Rural Communities Combined Base Funding: $60,800
Minimum Base Funding Top-Up: $100,000 − $60,800 = $39,200
Rural municipalities where farmland represents more than 70 per cent of their land area
Per-household funding provided through the Rural Communities Grant includes an enhancement for municipalities with the highest levels of farmland (where farmland represents more than 70 per cent of municipal land area), in recognition of their particular challenges.
This funding enhancement is provided based on the Farm Area Measure (FAM), which reflects the percentage of a municipality’s land area comprised of farm land (See Appendix B for further information on the FAM).
Single- and lower-tier rural municipalities with a FAM of more than 70 per cent and an RSCM of 75 per cent or greater receive funding according to the table outlined below.
Every 2-percentage point increase in the FAM between 70 per cent and 90 per cent results in an additional $14.50 per household:
| Item | FAM 70% | FAM 72% | FAM 74% | FAM 76% | FAM 78% | FAM 80% | FAM 82% | FAM 84% | FAM 86% | FAM 88% | FAM 90+% |
|---|---|---|---|---|---|---|---|---|---|---|---|
| Per‑household amount ($) | 152.00 | 166.50 | 181.00 | 195.50 | 210.00 | 224.50 | 239.00 | 253.50 | 268.00 | 282.50 | 297.00 |
Example 3.4
Municipality A (FAM < 70%):
- RSCM: 100%
- FAM: 50%
- Number of households: 3,000
Grant Amount: 3,000 × $152 = $456,000
Municipality B (FAM > 70%):
- RSCM: 100%
- FAM: 80%
- Number of households: 3,000
Grant Amount: 3,000 × $224.50 = $673,500
Municipality C (FAM > 90%):
- RSCM: 100%
- FAM: 93%
- Number of households: 3,000
Grant Amount: 3,000 × $297 = $891,000
Rural municipalities with an RSCM between 25 and 75 per cent
Single- and lower-tier rural municipalities with a FAM of more than 70 per cent and an RSCM between 25 per cent and 75 per cent receive a portion of the funding according to their RSCM.
The following table provides the per-household funding for a municipality with an RSCM of 50 per cent. see Appendix C for a summary of Rural Communities Grant parameters based on the RSCM and FAM.
| Item | FAM 70% | FAM 72% | FAM 74% | FAM 76% | FAM 78% | FAM 80% | FAM 82% | FAM 84% | FAM 86% | FAM 88% | FAM 90+% |
|---|---|---|---|---|---|---|---|---|---|---|---|
| Per‑household amount ($) | 76.00 | 83.25 | 90.50 | 97.75 | 105.00 | 112.25 | 119.50 | 126.75 | 134.00 | 141.25 | 148.50 |
Example 3.5
Municipality A:
- RSCM: 50%
- FAM: 80%
- Number of households: 3,000
Grant Amount: 3,000 × $112.25 = $336,750
4. Northern and Rural Fiscal Circumstances Grant
This grant is provided to municipalities eligible for funding through the Northern Communities Grant and/or Rural Communities Grant, both of which provide a fixed per-household funding amount to northern as well as single- and lower-tier rural municipalities. In addition to these fixed per-household amounts, the Northern and Rural Fiscal Circumstances Grant provides targeted support in recognition that not all northern and rural municipalities have the same fiscal circumstances.
The Northern and Rural Fiscal Circumstances Grant provides targeted funding to eligible municipalities based on their relative fiscal circumstances, as measured by the Northern and Rural Municipal Fiscal Circumstances Index (MFCI). For additional details on the Northern and Rural MFCI, see Appendix D.
In 2026, the Northern and Rural Fiscal Circumstances Grant will provide $125 million to support northern and rural municipalities with challenging fiscal circumstances.
See Appendix E for additional information on the Northern and Rural Fiscal Circumstances Grant parameters.
Northern and rural municipalities with an RSCM of 75 per cent or greater
Northern municipalities, as well as single- and lower-tier rural municipalities with an RSCM of 75 per cent or greater, receive funding according to their MFCI as outlined in the table below.
| Item | MFCI 0 | MFCI 1 | MFCI 2 | MFCI 3 | MFCI 4 | MFCI 5 | MFCI 6 | MFCI 7 | MFCI 8 | MFCI 9 | MFCI 10 |
|---|---|---|---|---|---|---|---|---|---|---|---|
| Per‑household amount ($) | 0 | 10 | 20 | 30 | 40 | 90 | 140 | 195 | 260 | 335 | 420 |
Example 4.1
Municipality A (Northern):
- MFCI: 7
- Number of households: 1,200
Grant Amount: 1,200 × $195 = $234,000
Rural municipalities with an RSCM between 25 and 75 per cent
Single- and lower-tier rural municipalities with an RSCM between 25 per cent and 75 per cent receive a portion of the per-household funding according to their RSCM.
| Item | RSCM 25% | RSCM 35% | RSCM 50% | RSCM 65% | RSCM 75% |
|---|---|---|---|---|---|
| Per-household amount ($) | 0 | 8 | 20 | 32 | 40 |
See Appendix E for more detailed information.
Example 4.2
Municipality A (Rural):
- MFCI: 4
- RSCM: 65%
- Number of households: 1,200
Grant Amount: 1,200 × $32 = $38,400
Additional municipality-specific details are provided in the customized 2026 Northern and Rural MFCI Workbooks.
5. Transitional Assistance
Transitional Assistance assists municipalities in adjusting to year-over-year funding changes. This funding ensures that municipalities that are eligible for core grants receive a guaranteed level of support based on their previous year’s OMPF allocation.
In 2026, the minimum funding guarantees for municipalities that are eligible for core grants have been set at 85 per cent for southern Ontario and 90 per cent for northern Ontario. This means that municipalities receiving core grants in southern Ontario will receive at least 85 per cent of their 2025 OMPF allocation and northern municipalities receiving core grants will receive at least 90 per cent of their 2025 OMPF allocation.
These minimum levels of support will continue to be enhanced, up to 100 per cent, for eligible northern and rural municipalities across the province with more challenging fiscal circumstances, as measured by the Northern and Rural MFCI.
| Item | MFCI 0 | MFCI 1 | MFCI 2 | MFCI 3 | MFCI 4 | MFCI 5 | MFCI 6 | MFCI 7 | MFCI 8 | MFCI 9 | MFCI 10 |
|---|---|---|---|---|---|---|---|---|---|---|---|
| Northern Ontario (%) | 90.0 | 90.0 | 90.0 | 91.5 | 93.0 | 94.5 | 96.0 | 97.5 | 99.0 | 100.0 | 100.0 |
| Southern Ontario (%) | 85.0 | 85.0 | 85.0 | 86.0 | 88.0 | 90.0 | 92.5 | 95.0 | 97.5 | 100.0 | 100.0 |
Example 5.1
Municipality A (Northern):
- 2025 OMPF allocation: $250,000
- 2026 minimum level of support for northern municipality: 90%
- MFCI: 8
- 2026 enhanced guaranteed level of support for MFCI 8: 99%
- 2026 guaranteed funding amount: $250,000 × 99% = $247,500
- Sum of 2026 OMPF grants prior to Transitional Assistance: $180,000
2026 Transitional Assistance: $247,500 − $180,000 = $67,500
Example 5.2
Municipality B (Southern Rural):
- 2025 OMPF allocation: $350,000
- 2026 minimum level of support for southern municipality: 85%
- MFCI: 7
- 2026 enhanced guaranteed level of support for MFCI 7: 95%
- 2026 guaranteed funding amount: $350,000 × 95% = $332,500
- Sum of 2026 OMPF grants prior to Transitional Assistance: $205,000
2026 Transitional Assistance: $332,500 − $205,000 = $127,500
Example 5.3
Municipality C (Southern Urban Core Grant Recipient):
- 2025 OMPF allocation: $250,000
- 2026 minimum level of support for southern municipality: 85%
- MFCI: n/a
- 2026 guaranteed funding amount: $250,000 × 85% = $212,500
- Sum of 2026 OMPF grants prior to Transitional Assistance: $125,000
2026 Transitional Assistance: $212,500 − $125,000 = $87,500
Transitional Assistance for municipalities that are ineligible for core grants
In 2026, the program is introducing an adjustment to Transitional Assistance for municipalities that are ineligible for core grants. For these municipalities, where funding is entirely composed of Transitional Assistance, the percentage funding guarantees used in Transitional Assistance funding will be adjusted to gradually phase out this funding over a five-year period.
For municipalities that receive OMPF funding but are ineligible for core grants (i.e., Transitional Assistance only recipients), Transitional Assistance is based on a percentage of their 2025 OMPF allocation.
Transitional Assistance only recipients will receive funding according to the table outlined below.
| OMPF Year | 2026 | 2027 | 2028 | 2029 | 2030 |
|---|---|---|---|---|---|
| Per Cent of 2025 OMPF Allocation (%) | 80 | 60 | 40 | 20 | 0 |
Example 5.4
Municipality D (Ineligible for OMPF core grants – Transitional Assistance only recipient):
- 2025 OMPF (Transitional Assistance) allocation: $200,000
- 2026 level of support for Transitional Assistance only recipient: 80%
- 2026 funding amount based on level of support: $200,000 × 80% = $160,000
2026 Transitional Assistance: $160,000
Implementation
OMPF allocations are announced annually in time to support the municipal budget planning process, and payments are issued in quarterly installments to municipalities. All OMPF allocations are provided to municipalities as unconditional grants.
The Ministry of Finance calculates OMPF municipal allocations based on a defined set of data elements (see Appendix F).
Municipal Workbooks
In order to assist municipalities in better understanding the 2026 program, the Ministry of Finance has developed a customized set of municipal workbooks for each municipality. These include:
- 2026 Ontario Municipal Partnership Fund Workbook
- 2026 Northern and Rural Municipal Fiscal Circumstances Index Workbook
The workbooks provide municipality-specific details and are shared electronically with municipal treasurers and clerk-treasurers.
2026 Reporting Obligations
OMPF payments are subject to compliance with the program’s reporting obligations.
Municipalities are required to submit Financial Information Returns (FIR) to the Ministry of Municipal Affairs and Housing (MMAH) and tax-rate bylaws through the Online Property Tax Analysis (OPTA) system or to MMAH as outlined in the following schedule:
| 2025 FIRs | By May 31, 2026 |
|---|---|
| 2026 Tax-Rates | By August 31, 2026 |
Payments for municipalities that do not meet their 2026 reporting obligations will be subject to holdback, beginning with the 2026 fourth quarterly payment, until these documents have been filed.
Additional Information
This Technical Guide and other 2026 OMPF supporting materials are posted online at:
https://ontario.ca/document/2026-ontario-municipal-partnership-fund
https://ontario.ca/fr/document/fonds-de-partenariat-avec-les-municipalites-de-lontario-de-2026
For additional information regarding 2026 OMPF allocations or for other general inquiries about the program, email your inquiry and contact information to: info.ompf@ontario.ca.
Municipal Services Offices at the Ministry of Municipal Affairs and Housing
Alternatively, municipalities may also contact their local Municipal Services Office of the Ministry of Municipal Affairs and Housing (MMAH) who can assist in directing their inquiry:
| Central: 777 Bay Street, 16th Floor Toronto ON M7A 2J3 | General Inquiry: (416) 585-6226 Toll Free: 1-800-668-0230 Fax: (416) 585-6882 Email: MSOC.Admin@ontario.ca |
|---|---|
| Eastern: Rockwood House, 8 Estate Lane Kingston ON K7M 9A8 | General Inquiry: (613) 545-2100 Toll Free: 1-800-267-9438 Email: MSO-E@ontario.ca |
| North (Sudbury): 159 Cedar Street, Suite 401 Sudbury ON P3E 6A5 | General Inquiry: (705) 564-0120 Toll Free: 1-800-461-1193 Email: MSONorth@ontario.ca |
| North (Thunder Bay): 435 James St. S., Suite 223 Thunder Bay ON P7E 6S7 | General Inquiry: (807) 475-1651 Toll Free: 1-800-461-1193 Email: MSONorth@ontario.ca |
| Western: 659 Exeter Road, 2nd Floor London ON N6E 1L3 | General Inquiry: (519) 873-4020 Toll Free: 1-800-265-4736 Email: MSO-SW@ontario.ca |
Appendices
Appendix A: Rural and Small Community Measure
The Rural and Small Community Measure (RSCM) represents the proportion of a municipality’s population residing in rural areas and/or small communities. This approach recognizes that some municipalities include a mix of rural and non-rural areas.
The measure is based on Statistics Canada data and is calculated as follows:
- Statistics Canada divides municipalities into small geographic areas, typically less than a few hundred residents.
- These areas are classified by Statistics Canada as rural areas or small communities if they meet one of the following conditions:
- They have a population density of less than 400 per square kilometre.
- They have a population density of greater than 400 per square kilometre but cannot be grouped with other adjacent areas (each also with a population density of greater than 400 per square kilometre), to produce a total population concentration greater than 1,000.
- They are not economically integrated with a population centre of greater than 10,000 (see table below).
- The RSCM is determined by calculating the proportion of a municipality’s population residing in areas that are classified as either rural or a small community.
OMPF calculations incorporate a minor adjustment to Statistics Canada’s classification of “small community.” This adjustment provides a transition between the small community and urban centre classification for areas with a population between 10,000 and 12,500 and is made on a sliding scale:
| Area population | 10,000 | 10,500 | 11,000 | 11,500 | 12,000 | 12,500 |
|---|---|---|---|---|---|---|
| Percentage (%) | 100 | 80 | 60 | 40 | 20 | 0 |
Appendix B: Farm Area Measure
The Farm Area Measure (FAM) represents the percentage of a municipality’s land area comprised of farm land. The measure was introduced in the 2016 OMPF in response to feedback from some municipalities that the OMPF should recognize the variation in farm land across the province.
The FAM is calculated as follows:

A municipality’s FAM is determined using the following components:
- Farm Land Area, which is equal to acres of land for properties in the farm property tax class, as of December 31st, 2024.
- The Ministry of Agriculture, Food and Agribusiness administers the application process for the farm property tax class and is responsible for reviewing eligibility criteria before a property can be placed in the farm property tax class. These criteria include:
- The property must be assessed and valued as farm land by the Municipal Property Assessment Corporation (MPAC).
- The farming business generates at least $7,000 in Gross Farm Income (GFI) per year.
- The farming business has a valid Farm Business Registration number from Agricorp or a valid exemption.
- The property is being used for a farming business by either the owner or tenant farmer or both.
- The acreage of properties in the farm property tax class is determined using the Ontario Parcel database. This database was developed in partnership between the Ministry of Northern Development, Ministry of Mines, Ministry of Natural Resources, MPAC and Teranet Enterprises Inc., and provides information on the land area for each individual property or parcel of land in the province.
- The Ministry of Agriculture, Food and Agribusiness administers the application process for the farm property tax class and is responsible for reviewing eligibility criteria before a property can be placed in the farm property tax class. These criteria include:
- Municipal Land Area, which represents the number of acres of land in a municipality and reflects municipal boundaries as of January 1, 2021. This measure is based on the Spatial Data Infrastructure (SDI) from Statistics Canada and excludes bodies of water.
Appendix C: Summary of Rural Communities Grant Parameters
The following table supports the Rural Communities Grant calculation for single- and lower-tier rural municipalities with an RSCM between 25 and 75 per cent and a FAM of 70 per cent or more.
| Item | FAM 70% | FAM 72% | FAM 74% | FAM 76% | FAM 78% | FAM 80% | FAM 82% | FAM 84% | FAM 86% | FAM 88% | FAM 90+% |
|---|---|---|---|---|---|---|---|---|---|---|---|
| RSCM 25% | 0.00 | 0.00 | 0.00 | 0.00 | 0.00 | 0.00 | 0.00 | 0.00 | 0.00 | 0.00 | 0.00 |
| RSCM 35% | 30.40 | 33.30 | 36.20 | 39.10 | 42.00 | 44.90 | 47.80 | 50.70 | 53.60 | 56.50 | 59.40 |
| RSCM 50% | 76.00 | 83.25 | 90.50 | 97.75 | 105.00 | 112.25 | 119.50 | 126.75 | 134.00 | 141.25 | 148.50 |
| RSCM 65% | 121.60 | 133.20 | 144.80 | 156.40 | 168.00 | 179.60 | 191.20 | 202.80 | 214.40 | 226.00 | 237.60 |
| RSCM 75+% | 152.00 | 166.50 | 181.00 | 195.50 | 210.00 | 224.50 | 239.00 | 253.50 | 268.00 | 282.50 | 297.00 |
Appendix D: Northern and Rural Municipal Fiscal Circumstances Index
The Northern and Rural Municipal Fiscal Circumstances Index (MFCI) measures a municipality’s fiscal circumstances relative to other northern and rural municipalities in the province.
The Northern and Rural MFCI is determined based on six indicators. These indicators are classified as either primary or secondary to reflect their relative importance in determining a municipality’s fiscal circumstances.
The indicators include:
Primary Indicators
- Weighted Assessment Per Household
- Median Household Income
Secondary Indicators
- Average Annual Change in Assessment (New Construction)
- Employment Rate
- Ratio of Working Age to Dependent Population
- Per Cent of Population Above Low-Income Threshold
A municipality’s Northern and Rural MFCI is determined through three steps, as listed below and as described in more detail on the following pages.
- Indicator Score — Each primary and secondary indicator is scored based on its relationship to the median for northern and rural municipalities.
- Average Indicator Score — An average indicator score is calculated based on the average of both the primary and secondary indicators.
- Northern and Rural MFCI — This index reflects a municipality’s fiscal circumstances relative to other northern and rural municipalities in the province and is based on the relative results of each municipality’s average indicator score. The Northern and Rural MFCI is measured on a scale from 0 to 10.
A lower MFCI corresponds to relatively positive fiscal circumstances, whereas a higher MFCI corresponds to more challenging fiscal circumstances. As a result, an MFCI of 5 corresponds to fiscal circumstances similar to the median for northern and rural municipalities.
Additional municipality-specific details are provided in the 2026 Northern and Rural MFCI Workbook.
1. Indicator Score
The indicator score has a range from -100 per cent to 100 per cent and reflects how the value of a municipality’s indicator compares to the median for northern and rural municipalities.
Indicator Value Above Median
An indicator value that is above the median will have a positive score, which is reflective of relatively positive fiscal circumstances.
The indicator score is calculated based on the position of the municipality's indicator value between the median and highest value for northern and rural municipalities.
Indicator Value Below Median
An indicator value that is below the median will have a negative score, which is reflective of more challenging fiscal circumstances.
The indicator score is calculated based on the position of the municipality’s indicator data between the median and lowest value for northern and rural municipalities.
For example, an indicator score of 25 per cent indicates that a data value is one quarter of the distance between the median and highest value, while an indicator score of -25 per cent indicates that a data value is one quarter of the distance between the median and lowest value. An indicator score of 0 per cent reflects the median for northern and rural municipalities.
The following table outlines the median, highest and lowest values for each MFCI indicator. Illustrative examples of indicator score calculations are provided on the following page.
| Item | Lowest | Median | Highest |
|---|---|---|---|
| Weighted Assessment per Household | $47,000 | $294,000 | $827,000 |
| Median Household Income | $45,000 | $82,000 | $141,000 |
| Item | Lowest | Median | Highest |
|---|---|---|---|
| Average Annual Change in Assessment (New Construction) | -2.2% | 1.2% | 4.8% |
| Employment Rate | 23.0% | 53.0% | 71.0% |
| Ratio of Working Age to Dependent Population | 98.0% | 152.0% | 245.0% |
| Per cent of Population Above Low-Income Threshold | 65.0% | 88.0% | 97.0% |
Example 1.1
Indicator: Median Household Income
| Lowest Value | Median Value | Highest Value |
|---|---|---|
| $45,000 | $82,000 | $141,000 |
Example Municipality: Indicator Data Value = $63,500
- Difference between Indicator Value and Median:
$63,500 − $82,000 = -$18,500
Since the indicator value is below the median for northern and rural municipalities, the difference between the median and the lowest value for northern and rural municipalities is calculated.
- Difference between Median and Lowest Value: $82,000 − $45,000 = $37,000
- Indicator Score = A / B: -$18,500 / $37,000 = -50%
Example 1.2
Indicator: Ratio of Working Age to Dependent Population
| Lowest Value | Median Value | Highest Value |
|---|---|---|
| 98% | 152% | 245% |
Example Municipality: Indicator Data Value = 198.5%
- Difference between Indicator Value and Median: 198.5% − 152% = 46.5%
Since the indicator value is above the median for northern and rural municipalities, the difference between the median and the highest value for northern and rural municipalities is calculated.
- Difference between Median and Highest Value: 245% − 152% = 93%
- Indicator Score = A / B: 46.5% / 93% = 50%
2. Average indicator score
The average indicator score summarizes a municipality’s overall results on all six indicators.
A municipality’s average indicator score is based on both the primary and secondary indicator average, as shown below.
Calculating Average Indicator Score
Average Indicator Score =
(Primary Indicator Average + Secondary Indicator Average) / 2
Primary Indicator Average: (A + B) / 2
- Weighted Assessment Per Household indicator score
- Median Household Income indicator score
Secondary Indicator Average: (C + D + E + F) / 4
- Average Annual Change in Assessment (New Construction) indicator score
- Employment Rate indicator score
- Ratio of Working Age to Dependent Population indicator score
- Per Cent of Population Above Low-Income Threshold indicator score
Note: A positive average indicator score reflects relatively positive fiscal circumstances, while a negative average indicator score reflects more challenging fiscal circumstances.
Example 2.1
Average Indicator Score
- Weighted Assessment per Household indicator score: 8%
- Median Household Income indicator score: -50%
Primary Indicator Average: (8% + (−50%)) / 2 = −21%
- Average Annual Change in Assessment (New Construction) indicator score: -87%
- Employment Rate indicator score: 1%
- Ratio of Working Age to Dependent Population indicator score: 50%
- Per Cent of Population Above Low-Income Threshold indicator score: -80%
Secondary Indicator Average: (-87% + 1% + 50% + (-80%)) / 4 = -29%
Average Indicator Score: (-21% + (-29%)) / 2 = -25%
3. Determination of Northern and Rural MFCI
The Northern and Rural MFCI reflects a municipality’s fiscal circumstances relative to other northern and rural municipalities in the province.
The Northern and Rural MFCI is measured on a scale of 0 to 10. A lower MFCI corresponds to relatively positive fiscal circumstances, while a higher MFCI corresponds to more challenging fiscal circumstances. A Northern and Rural MFCI of 5 corresponds to fiscal circumstances similar to the median for northern and rural municipalities.
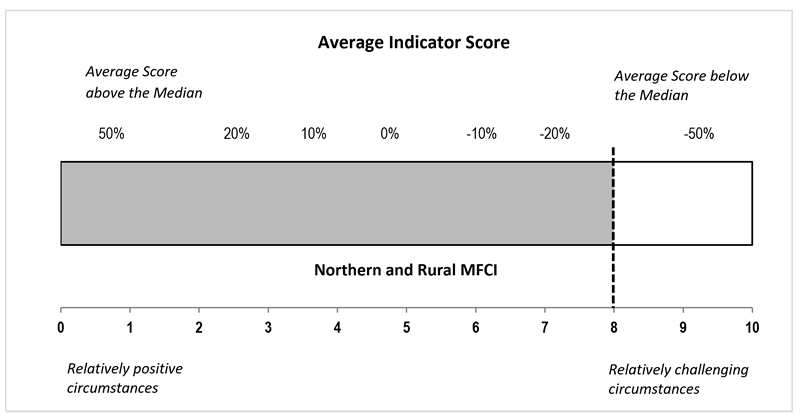
A municipality’s MFCI is determined based on the value of the average indicator score. The example below presents how average indicator scores are used to determine a municipality’s MFCI.
Example 3.1
Average Indicator Score: −25%
Northern and Rural MFCI: 8.0
Appendix E: Northern and Rural Fiscal Circumstances Grant Parameters
The Northern and Rural MFCI is measured on a scale from 0 to 10. A lower MFCI corresponds to relatively positive fiscal circumstances, while a higher MFCI corresponds to more challenging fiscal circumstances. The following table provides details regarding the 2026 per-household funding levels under the Northern and Rural Fiscal Circumstances Grant.
| Item | MFCI 0 | MFCI 1 | MFCI 2 | MFCI 3 | MFCI 4 | MFCI 5 | MFCI 6 | MFCI 7 | MFCI 8 | MFCI 9 | MFCI 10 |
|---|---|---|---|---|---|---|---|---|---|---|---|
| Per‑household ($) | 0 | 10 | 20 | 30 | 40 | 90 | 140 | 195 | 260 | 335 | 420 |
The following table supports the Northern and Rural Fiscal Circumstances Grant calculation for single- and lower-tier rural municipalities with an RSCM between 25 and 75 per cent. The table illustrates the per‑household funding amount associated with a range of RSCM and MFCI values.
| Item | MFCI 0 | MFCI 1 | MFCI 2 | MFCI 3 | MFCI 4 | MFCI 5 | MFCI 6 | MFCI 7 | MFCI 8 | MFCI 9 | MFCI 10 |
|---|---|---|---|---|---|---|---|---|---|---|---|
| RSCM 25% | 0.00 | 0.00 | 0.00 | 0.00 | 0.00 | 0.00 | 0.00 | 0.00 | 0.00 | 0.00 | 0.00 |
| RSCM 35% | 0.00 | 2.00 | 4.00 | 6.00 | 8.00 | 18.00 | 28.00 | 39.00 | 52.00 | 67.00 | 84.00 |
| RSCM 50% | 0.00 | 5.00 | 10.00 | 15.00 | 20.00 | 45.00 | 70.00 | 97.50 | 130.00 | 167.50 | 210.00 |
| RSCM 65% | 0.00 | 8.00 | 16.00 | 24.00 | 32.00 | 72.00 | 112.00 | 156.00 | 208.00 | 268.00 | 336.00 |
| RSCM 75%+ | 0.00 | 10.00 | 20.00 | 30.00 | 40.00 | 90.00 | 140.00 | 195.00 | 260.00 | 335.00 | 420.00 |
Appendix F: Data sources
| Data | Year | Source(s) |
|---|---|---|
| Weighted Assessment | 2025 Returned Roll and 2026 starting tax ratios | Municipal Property Assessment Corporation (MPAC) and municipal tax rate bylaws |
| PIL Weighted Assessment | 2023 or 2024 | Municipal FIR |
| Number of Households | 2025 | MPAC Returned Roll |
| Median Household Income | 2021 | Statistics Canada |
| Rural and Small Community Measure | 2021 | Statistics Canada |
| Per Cent of Population Above Low-Income Threshold | 2021 | Statistics Canada |
| Ratio of Working Age to Dependent Population | 2021 | Statistics Canada |
| Employment Rate | 2021 | Statistics Canada |
| Average Annual Change in Assessment (New Construction) | 2020–2025 | Online Property Tax Analysis System (OPTA) |
| Municipal Land Area | 2021 | Statistics Canada |
| Farm Land Area | 2024 | MPAC and Ontario Parcel |
Note: For municipality-specific details, refer to customized 2026 workbooks developed by the Ministry of Finance.
Appendix G: Definitions
- Average Annual Change in Assessment (New Construction)
- Measures the five-year (2020–2025) average annual change in a municipality’s assessment, for example, as a result of new construction or business property closures, excluding the impact of reassessment.
- Average Indicator Score
- Summarizes a municipality’s overall results on all six indicators, based on both the primary and secondary indicator average.
- Core Grant Components
- Refers to the four OMPF core grant components: Assessment Equalization; Northern Communities; Rural Communities; and Northern and Rural Fiscal Circumstances Grant components.
- Employment Rate
- Statistics Canada’s measure of number of employed persons, divided by persons aged 15 and over.
- Farm Area Measure (FAM)
- Represents the percentage of a municipality’s land area comprised of farm land.
- Farm Land Area
- Equal to the acres of land for properties in the farm property tax class, as of December 31st, 2024. The acreage of properties in the farm property tax class is determined using the Ontario Parcel database.
- Households
- Measure of households based on the 2025 returned roll from the Municipal Property Assessment Corporation (MPAC), including applicable updates. Household reflect the following classes:
(1) Residential Unit (RU) – Permanent households
(2) Residential Dwelling Unit (RDU) – Seasonal households such as cottages
(3) Farm Residential Unit (FRU) – Farmlands on which a farm residence exists - Indicator Score
- Reflects the position of a municipality’s indicator data value relative to other municipalities and has a range from -100 per cent to 100 per cent. A positive indicator score is reflective of relatively positive fiscal circumstances, while a negative score is reflective of more challenging fiscal circumstances.
- Median Household Income
- Statistics Canada’s measure of median income for all private households in 2020.
- Municipal Land Area
- Equal to the acres of land in a municipality and reflects municipal boundaries, as of January 1st, 2021. This measure is based on the Spatial Data Infrastructure (SDI) from Statistics Canada and excludes bodies of water.
- Northern and Rural Base Funding
- Refers to funding provided through the Northern Communities and Rural Communities core grant components, excluding the farm enhancement provided to rural municipalities with the highest levels of farm land, or funding provided through other core grant components.
- Northern and Rural Municipal Fiscal Circumstances Index (MFCI)
- The Northern and Rural MFCI measures a municipality’s fiscal circumstances relative to other northern and rural municipalities in the province, and ranges from 0 to 10. A lower MFCI corresponds to relatively positive fiscal circumstances, whereas a higher MFCI corresponds to relatively more challenging fiscal circumstances. An MFCI of 5 corresponds to fiscal circumstances similar to the median for northern and rural municipalities.
- OMPF Funding
- Refers to funding provided through the OMPF core grant components and Transitional Assistance (must be greater than $4,000).
- Per Cent of Population Above Low-Income Threshold
- Reflects the Statistics Canada measure of the population in private households above the low-income threshold for Ontario compared to the total population in private households. The measure is based on after-tax income, and the low-income threshold is based on half the median adjusted household income in 2020.
- Primary Indicators
- The Northern and Rural MFCI is determined based on six indicators which are classified as either primary or secondary to reflect their relative importance in determining a municipality’s fiscal circumstances. The primary indicators are weighted assessment per household and median household income.
- Ratio of Working Age to Dependent Population
- Statistics Canada’s measure of working age population (aged 15 to 64), divided by youth (aged 14 and under) and senior population (aged 65 and over).
- Rural and Small Community Measure (RSCM)
- RSCM represents the proportion of a municipality’s population residing in rural areas and/or small communities. This approach recognizes that some municipalities include a mix of rural and non-rural areas. The measure is based on Statistics Canada data from the 2021 Census.
- Secondary Indicators
- The Northern and Rural MFCI is determined based on six indicators, which are classified as either primary or secondary to reflect their relative importance in determining a municipality’s fiscal circumstances. The secondary indicators are average annual change in assessment (new construction), employment rate, ratio of working age to dependent population, and per cent of population above low-income threshold.
- Weighted Assessment Per Household
- Measures the size of the municipality’s tax base. Refers to the total assessment of a municipality weighted by the tax ratio for each class of property (including payments in lieu of property taxes retained by the municipality) divided by the total number of households. Subject to eligibility provisions (such as being a small, northern or rural municipality and/or a current recipient).
- Workbooks
- The OMPF workbooks provide customized detailed data and grant calculations to assist municipalities in understanding their allocations. The workbooks include: the Ontario Municipal Partnership Fund Workbook and, where applicable, the Northern and Rural Municipal Fiscal Circumstances Index Workbook. These customized workbooks are provided to municipal treasurers and clerk-treasurers following the announcement of annual funding allocations.