2025 Provincial Apiarist report
2025 Season highlights
The Ministry of Agriculture, Food and Agribusiness’ (OMAFA) Apiary Program conducted regular and targeted inspections in 2025.
22,792 honey bee colonies were shipped outside of Ontario for the pollination of blueberry and cranberry crops in eastern Canada.
Ontario beekeepers reported an overall overwinter honey bee mortality of 37% for the winter of 2024–2025. This was lower than the 50% reported in the previous year.
Notable statistics about the 2025 Ontario beekeeping industry include:
- number of registered beekeepers: 5,195
- number of registered commercial beekeepers (operating 50 or more colonies): 254
- number of registered non-commercial or hobbyist beekeepers (operating 49 or fewer colonies): 4,941
- number of registered colonies: 118,109
- preliminary average honey yield/colony: 30.14 kg (66.46 lb) per colony
- preliminary total estimated honey crop: 3.56 million kg (7.85 million lb)
- overwinter honey bee losses reported by commercial beekeepers: 37%
- overwinter honey bee losses reported by non-commercial beekeepers: 43%
- selling permits issued: 86
- queen and nuc permits issued: 139
- import permits issued: 42
Pest and disease levels
During the 2025 beekeeping season, OMAFA inspected a total of 589 bee yards. OMAFA apiary inspectors assessed the presence of common apiary pests and diseases through the brood nest inspection of 5,430 colonies. Inspectors checked for varroa mites in 2,659 of the colonies receiving brood nest inspections and checked for small hive beetle in an additional 6,360 colonies through top bar inspections.
The prevalence of the following diseases among inspected colonies were:
- American foulbrood: 0.52%
- European foulbrood: 0.66%
- sacbrood virus: 0.55%
The data represents the colonies inspected in 2025 and is not necessarily reflective of the beekeeping industry across the province.
American foulbrood (Paenibacillus larvae)
American foulbrood (AFB), a bacterial disease of honey bees, was detected in 28 honey bee colonies or 0.52% of the colonies inspected in Ontario. These colonies represented 10 bee yards positive for AFB or 1.70% of the yards inspected. The 2025 data represents an increase in AFB from 2024 when AFB was observed in 0.35% of colonies and this increase is in part due to a severe AFB outbreak that took place in Waterloo region in August 2025.
Samples of suspected brood disease found during apiary inspections are collected and submitted for laboratory confirmation by molecular analysis at the University of Guelph’s Animal Health Lab. Although visual signs and symptoms of a brood disease are still important to detect disease within a colony, laboratory confirmation is required since strains of European foulbrood are displaying characteristics of AFB.
Sample analysis continues to confirm that the strains of AFB circulating in Ontario remain susceptible to oxytetracycline.
European foulbrood (Melissococcus plutonius)
European foulbrood (EFB), a bacterial disease of honey bees, was detected in 36 honey bee colonies or 0.66% of the colonies inspected in Ontario. These colonies represented 22 bee yards positive for EFB or 3.74% of the yards inspected. The 2025 data represents a major increase in EFB from 2024 when EFB was observed in 0.16% of colonies.
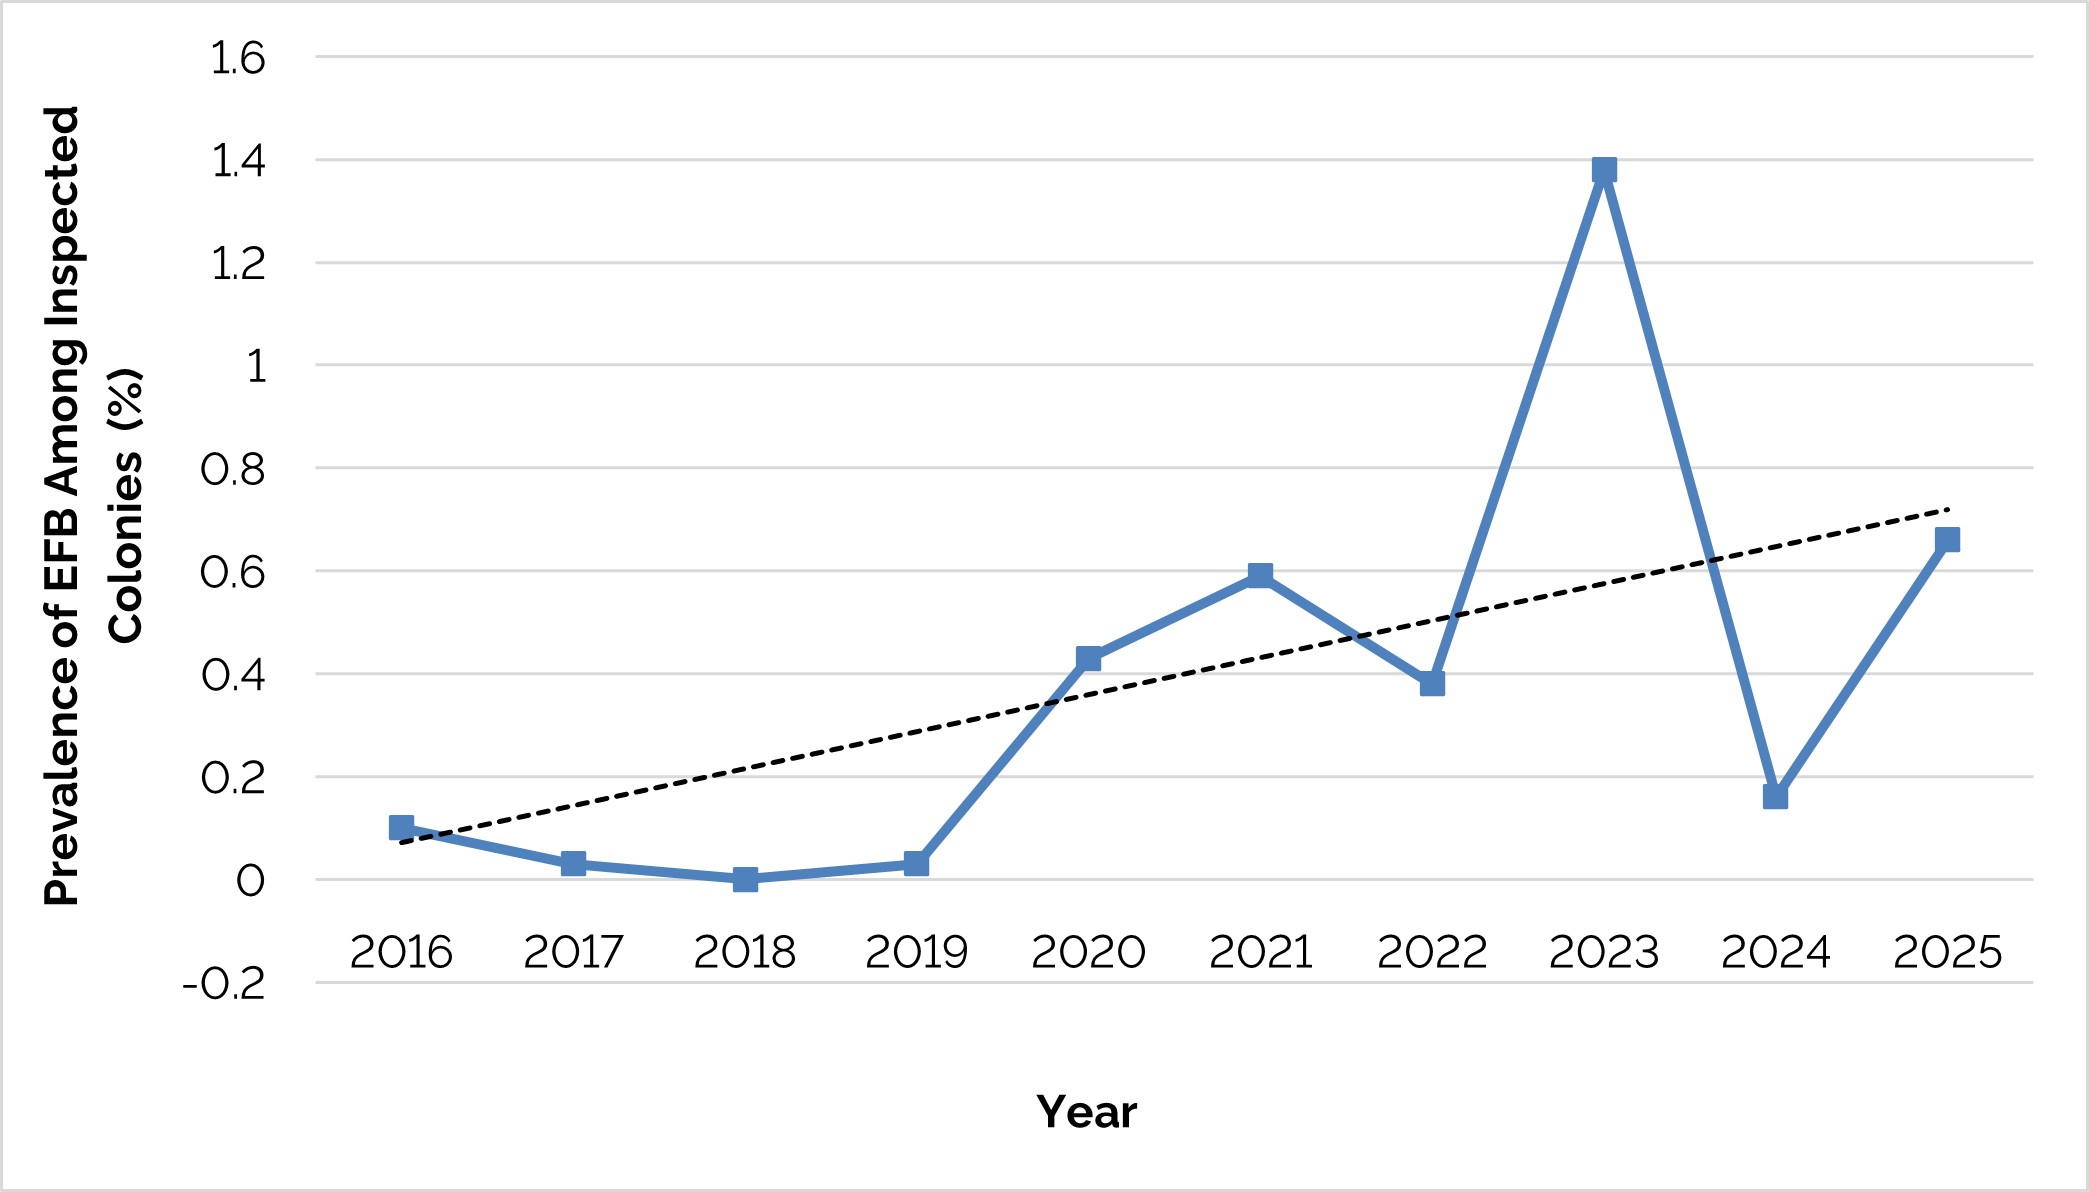
There appears to be a sustained trend of increase in EFB over recent years in Ontario (Figure 1). This trend has also been observed and reported from other apiary programs in North America.
The more recent cases of EFB have been reported to be more difficult to treat and manage. In some provinces, colonies with serious EFB infections have been reported to be incapable of recovering. The possible reasons for this situation are outside the scope of this report and are being investigated by researchers.
Accessible description of Figure 1
Small hive beetle (Aethina tumida)
Small hive beetle (SHB) is an insect pest of honey bees. A total of 7 new bee yards, including both commercial and small-scale operations in municipalities that have not yet been identified as having SHB, tested positive for SHB in Ontario. This represents a decrease in new detections (newly positive bee yards) in 2025 compared to 2024 (n = 9). Differences in detections of SHB in beekeeping operations may be due to variation in:
- weather patterns
- colony conditions
- beekeeper management practices
The positive findings of SHB may also be overrepresented in inspection results due to the high rate of inspection of colonies in the Niagara region to allow for the movement of colonies for out of province pollination. Colonies in the Niagara region make up a large proportion of apiary inspections.
The presence of SHB larvae, which is the main cause of SHB damage to colonies, is documented during apiary inspections. Reports continue to show that there have been very few instances of SHB damaging colonies in the province and the impact of this pest in Ontario has been low.
OMAFA has an online map showing the number of SHB-positive bee yards confirmed in each township. This map provides current data to other jurisdictions that import Ontario honey bees and informs beekeepers about where SHB has been detected in Ontario, which helps them to manage the risk to their beekeeping activities.
Varroa mites (Varroa destructor)
Ministry apiary inspectors sample for varroa mites, a common and very serious pest of honey bees, during regular apiary inspections. Varroa mites were typically documented at low levels of infestation early in the beekeeping season for both commercial and small-scale beekeepers, but increased to higher levels later in the season. Across the province, 2,659 colonies (831 commercial, 1,828 small-scale) were inspected for varroa mites using a standard alcohol wash (a sample of approximately 300 bees collected from the brood nest, washed in alcohol and the varroa mites filtered and quantified). In 2025, the Apiary Program increased the standard number of colonies sampled (from 3 colonies to 6 colonies) for varroa mites in bee yards during general inspections to acquire a more representative sample of infestation.
Since varroa mites are widely distributed (they are in virtually every single honey bee colony in Ontario) and well-established across the province, the prevalence of these mites is not as informative as the degree of infestation.
Guzman et al. (2010) established treatment thresholds for varroa mite infestations. Colonies should be treated for varroa mites in:
- May if the infestation is greater than 2%
- August if the infestation is greater than 3%
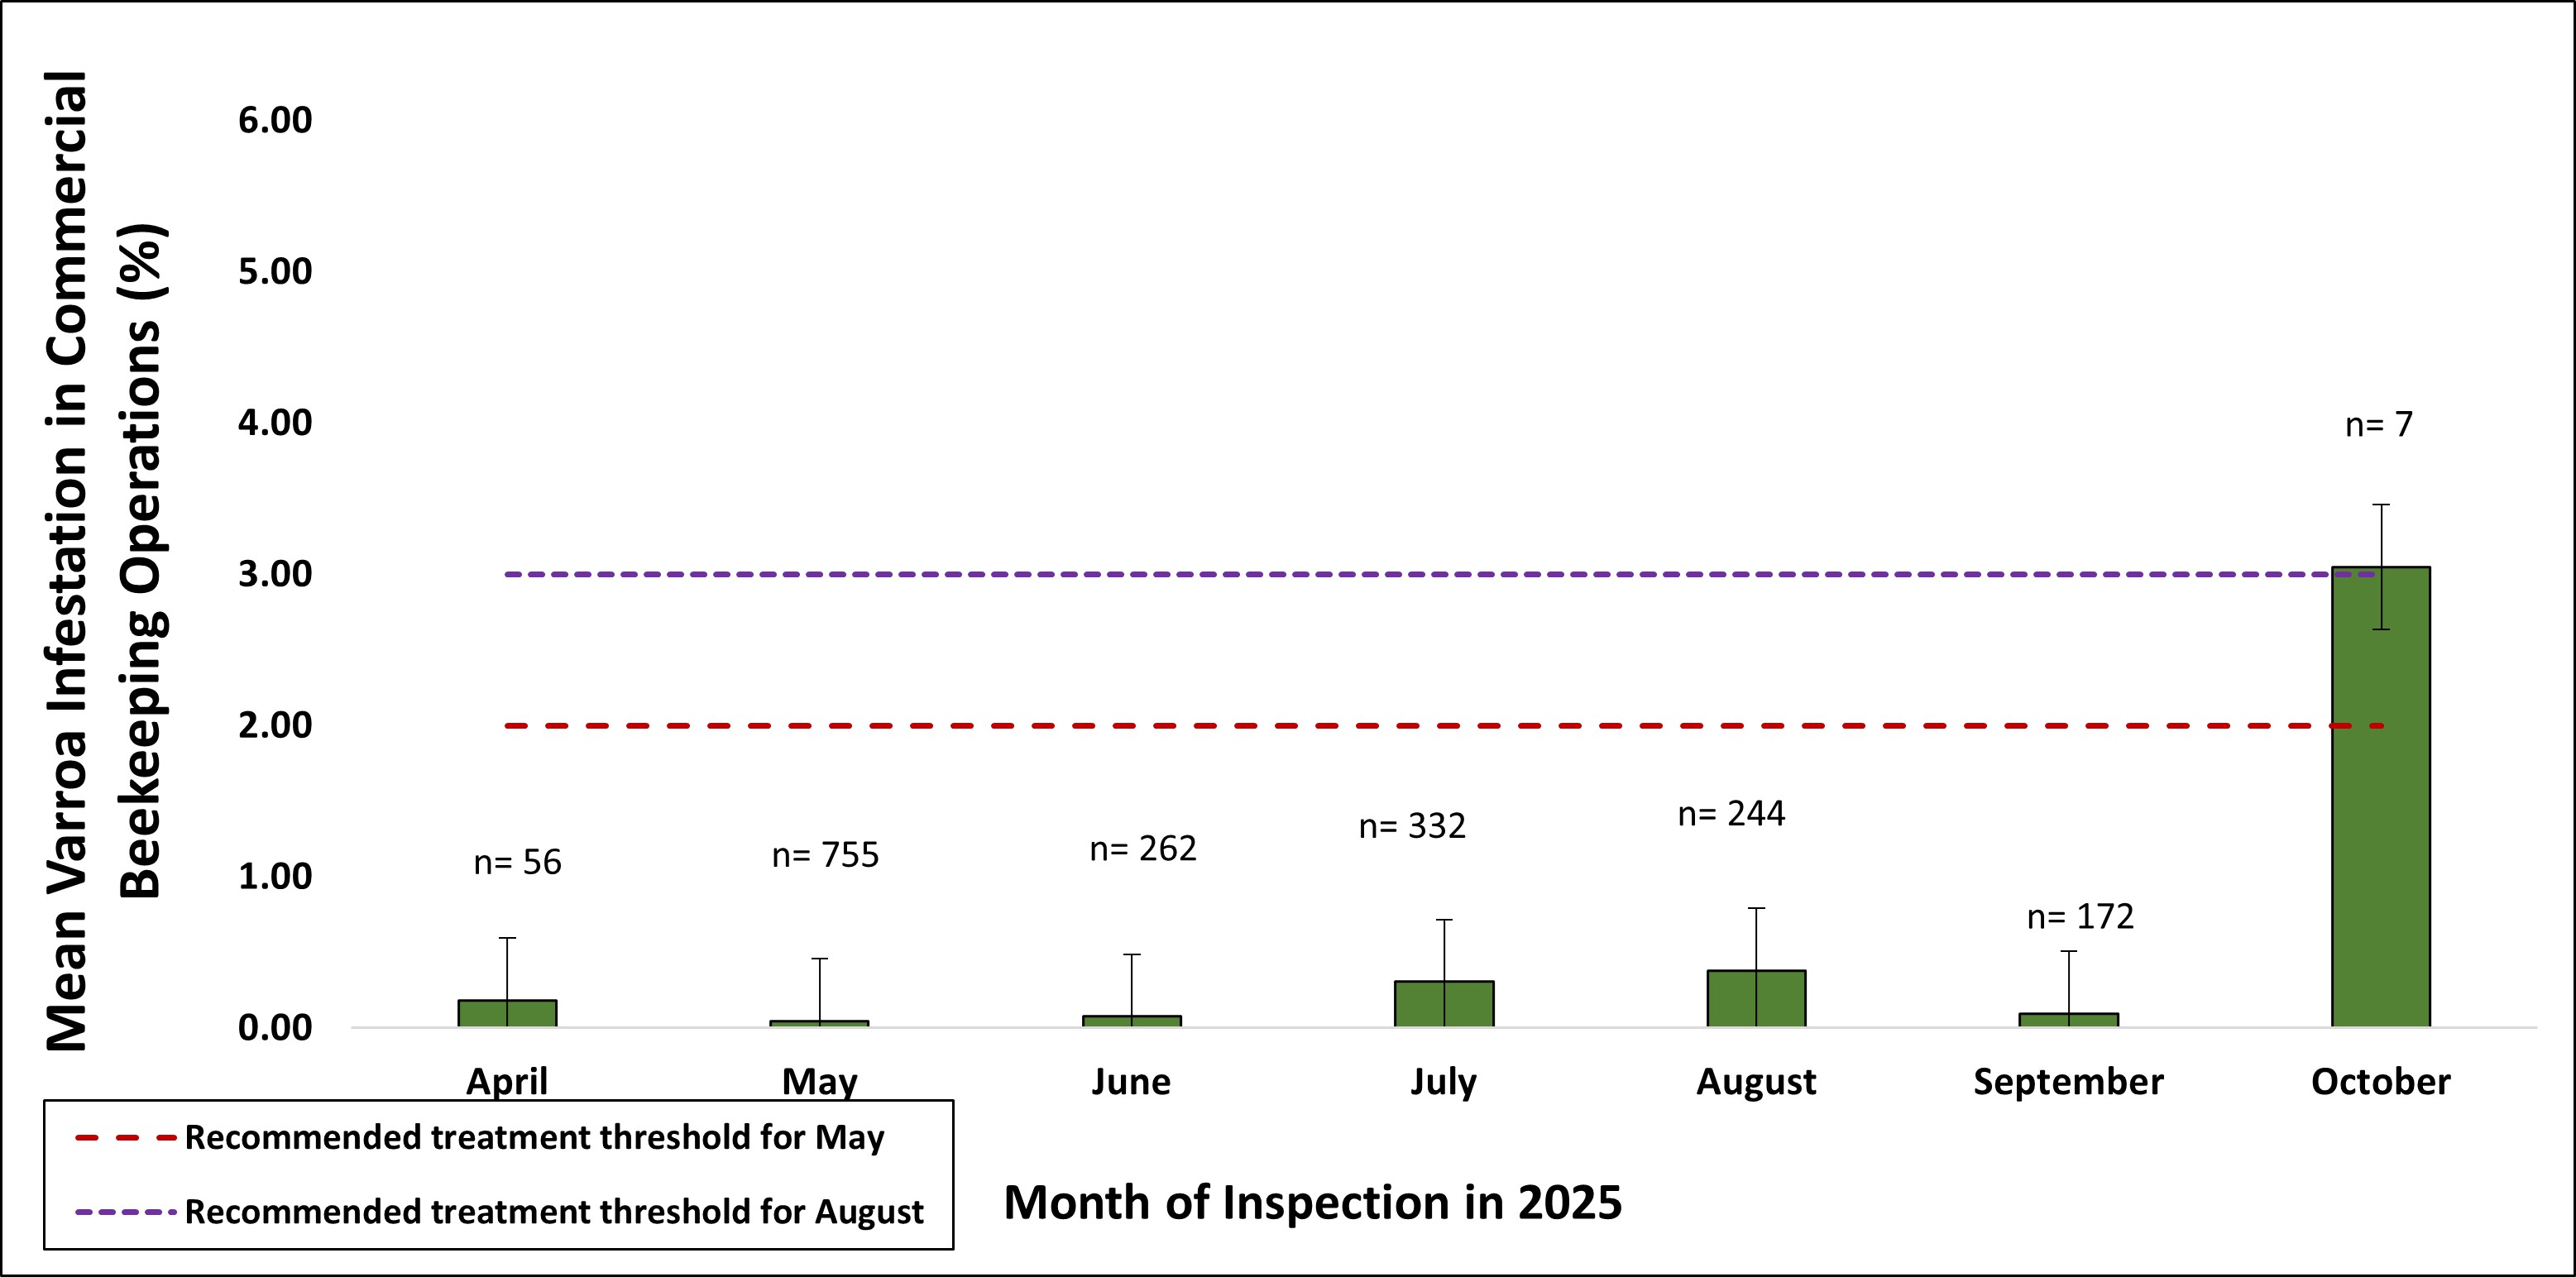
Among commercial operations, the mean varroa mite infestation remained below treatment thresholds throughout the season up until October, which saw an average level right at the treatment threshold. Mean varroa mite infestations ranged from a low of 0.05% in May to a high of 3% in October (Figure 2). The sample size for October was small, so this may not be representative of the commercial honey bee colonies in Ontario.
Accessible description of Figure 2
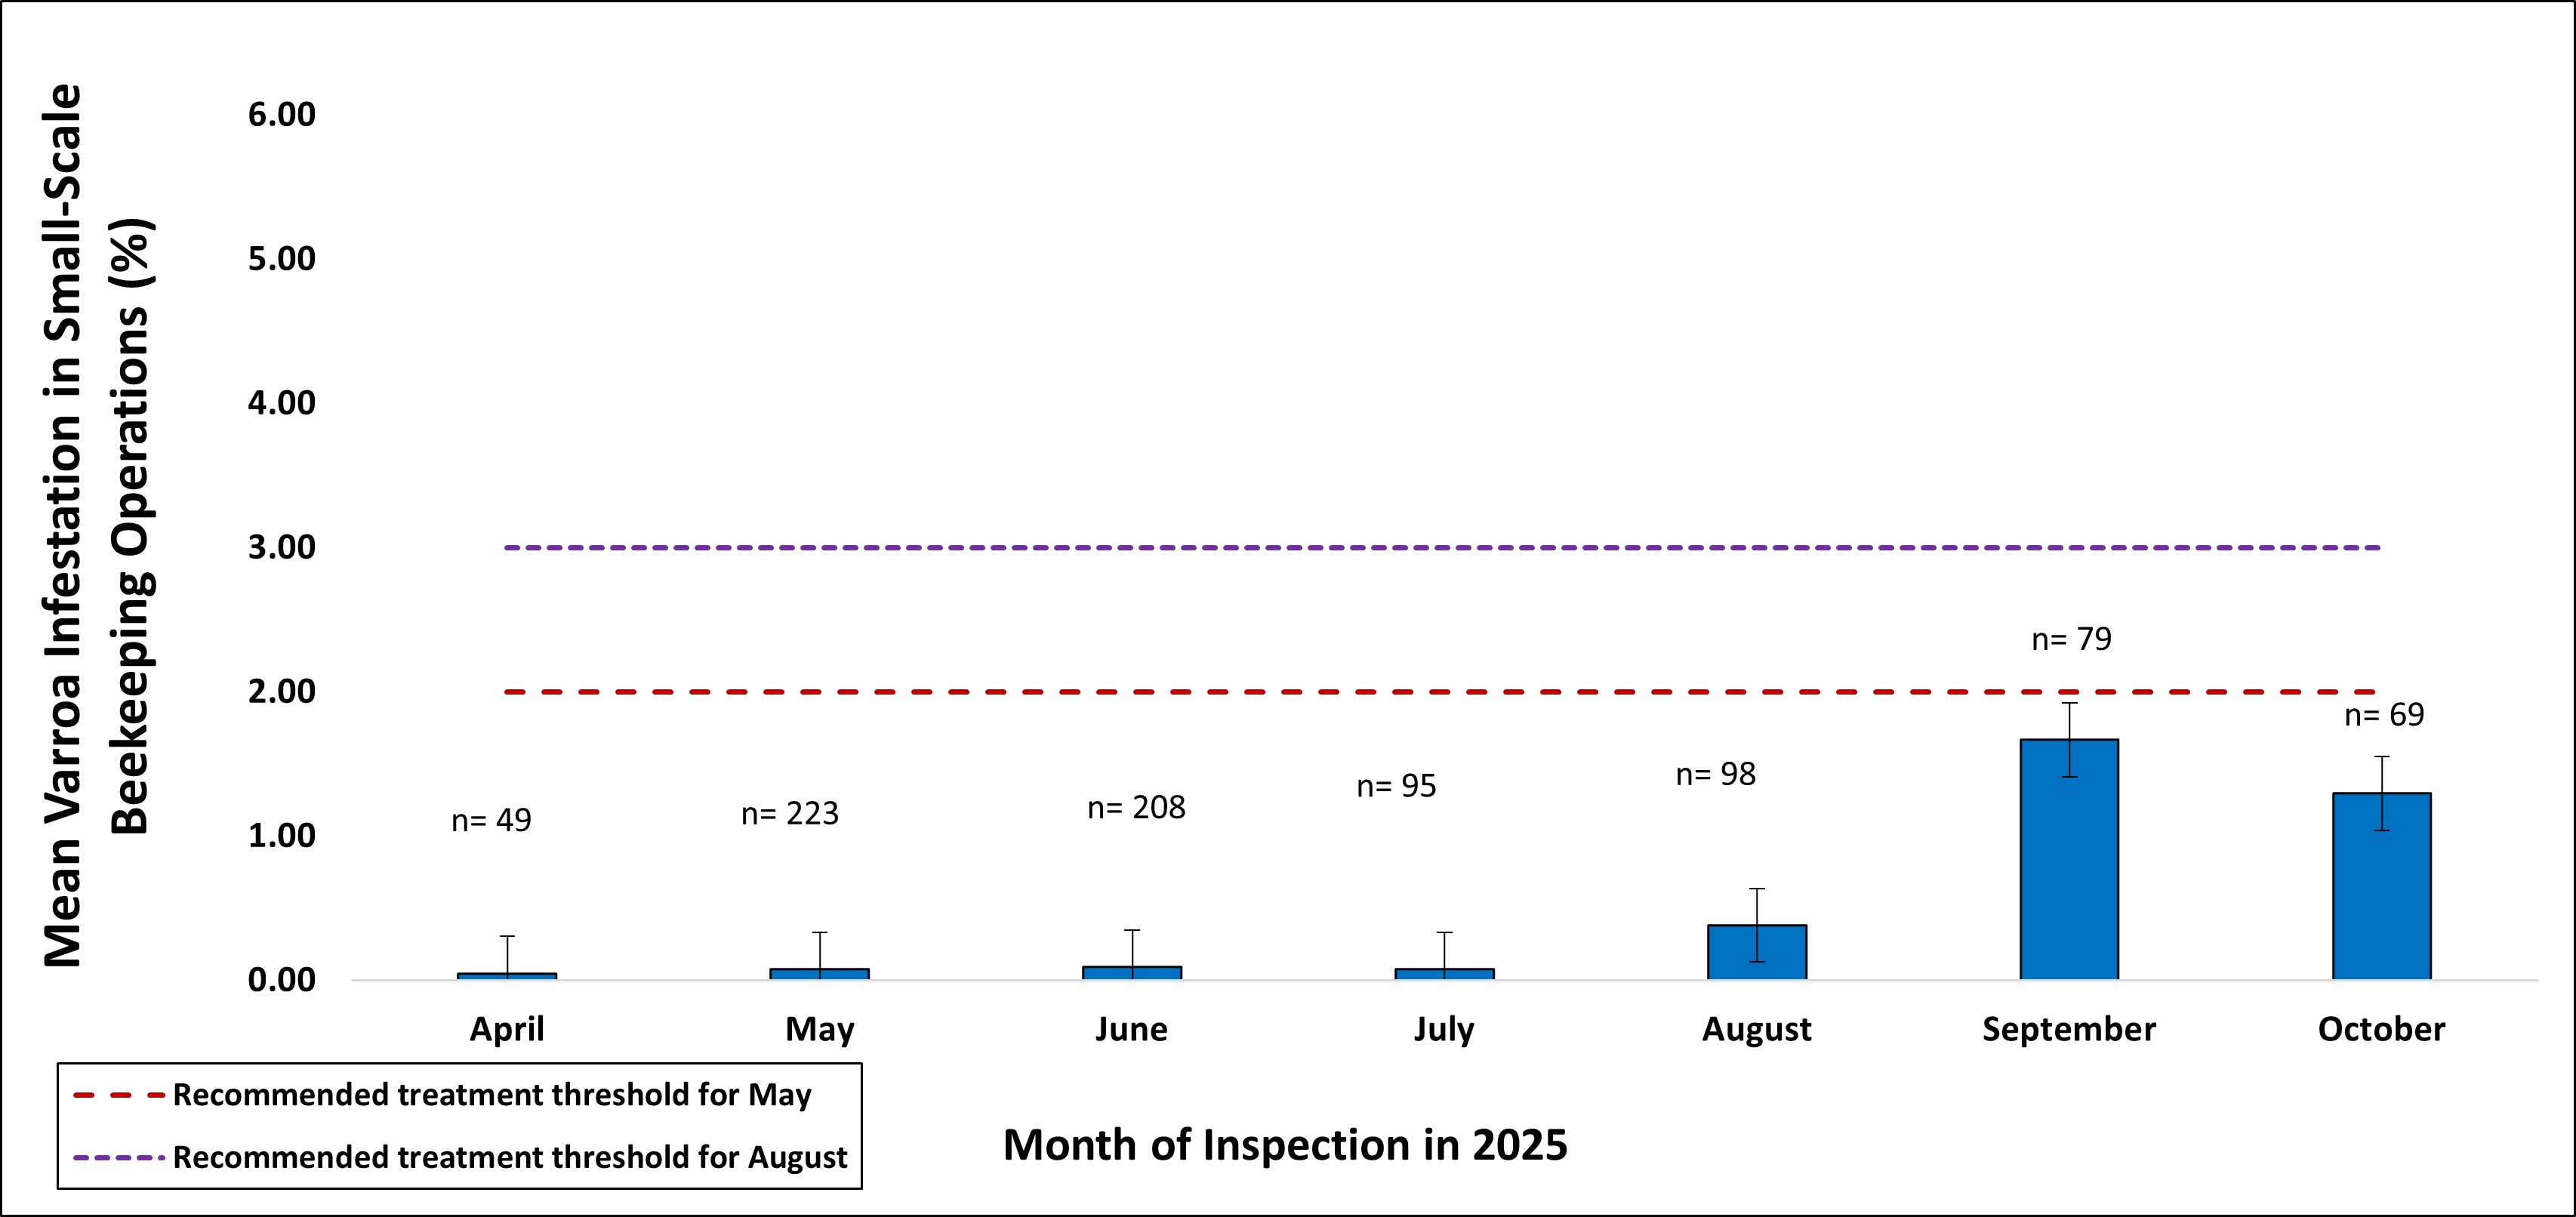
The degree of varroa mite infestation among small-scale operations was low at the beginning of the season, and then increased and peaked in late summer to early fall. Varroa mite infestations ranged from a low of 0.05% in April to a high of 1.7% in September (Figure 3).
Accessible description of Figure 3
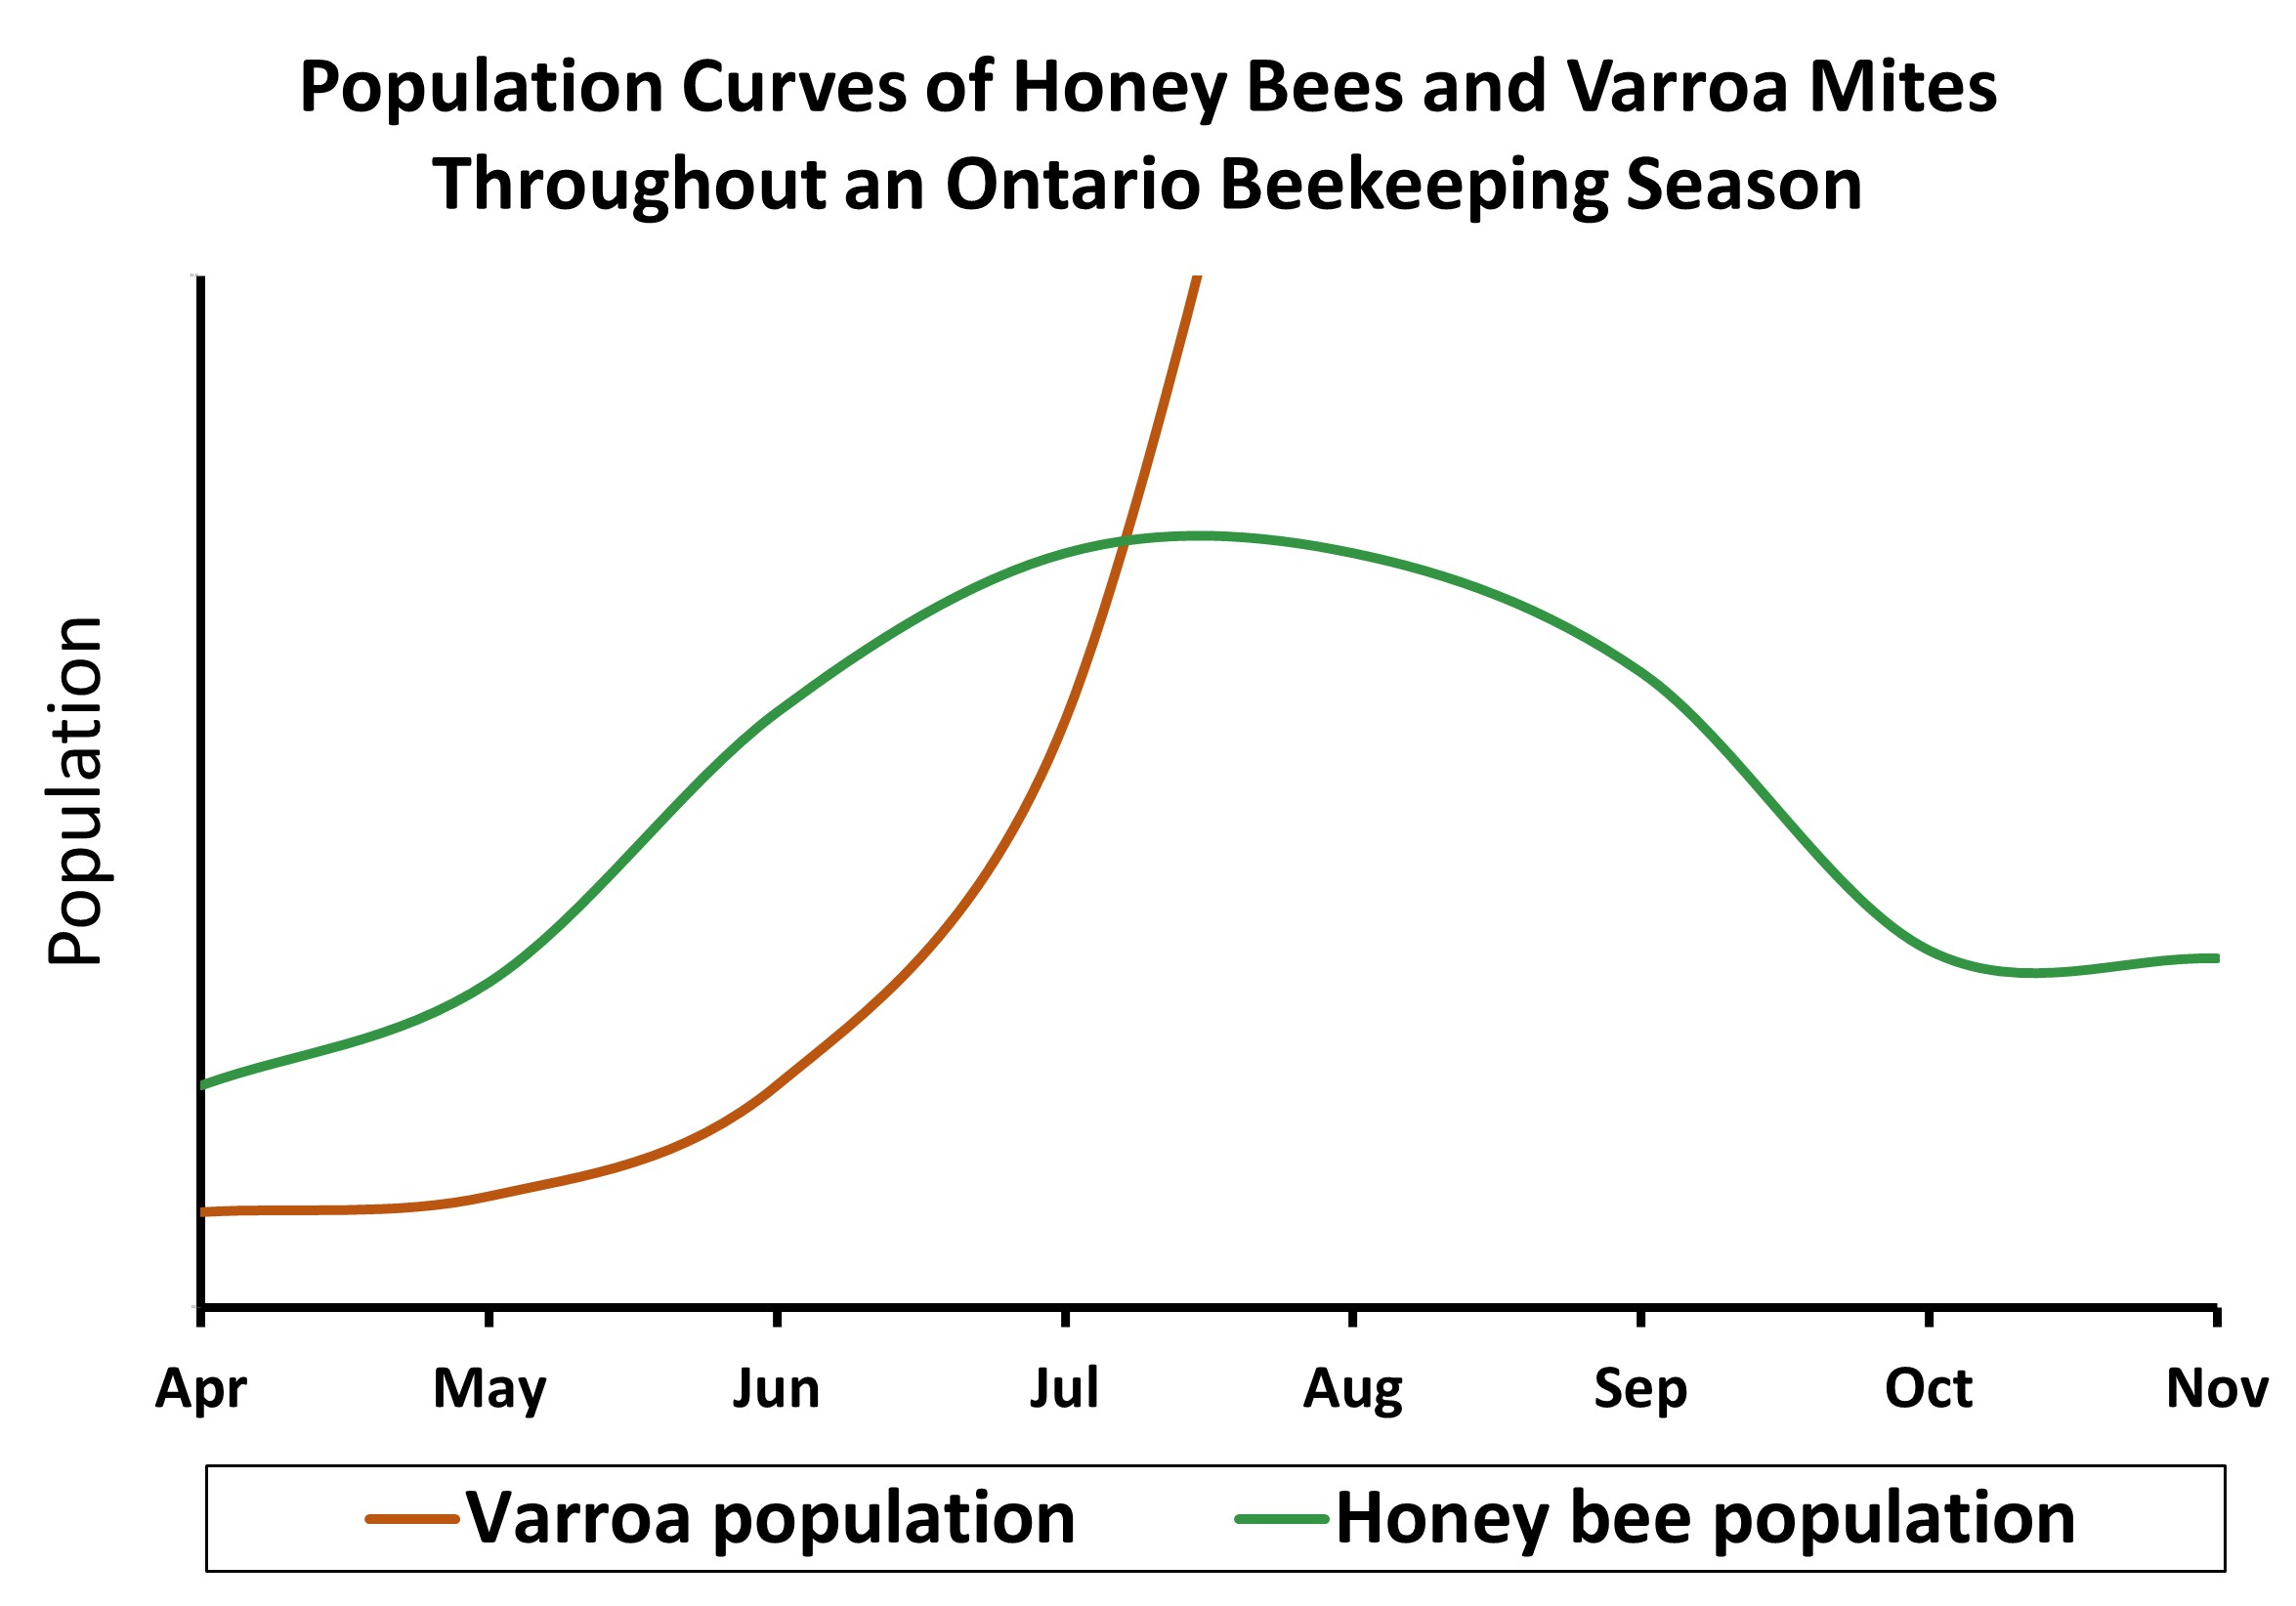
The life cycle of varroa mites is dependent on the life cycle of honey bees since varroa mites cannot reproduce independently of developing honey bees. If honey bees reproduce earlier in the season, varroa mites are accordingly increasing their levels and reaching peak populations earlier. As soon as honey bee brood is produced, varroa mites begin to reproduce and increase their population (Figure 4).
Varroa mites have an exponential population growth, meaning an increase in levels that accelerates faster as time goes on. Once varroa mites reach a certain level, they may become difficult to manage later in the season due to the sheer number present in the colony. Beekeepers can manage this risk by treating early in the spring, and then treating again in early summer to suppress varroa population growth early.
Accessible description of Figure 4
This shows the importance of regularly monitoring for varroa mite levels throughout the beekeeping season as it can be easy to miss early population peaks, especially when growth falls outside of a typical year’s pattern (for example, in early spring). If beekeepers do not sample frequently throughout the season to check varroa mite levels, it becomes difficult to dismiss varroa mites as a major factor of overwinter colony loss.
Weather and seasonal conditions influence varroa mite levels and beekeepers must adapt their management practices accordingly, especially as earlier springs and warmer weather lasting longer into the fall become more common with climate change.
Overall, the available data shows that regular monitoring throughout the season (early spring to late summer/fall) to know when to treat for varroa mites is important because varroa mite risk is present throughout the entire active beekeeping season and increases over time and in line with the natural population growth dynamics of varroa (Figure 4). The data also supports the importance of regular monitoring throughout the season as:
- early monitoring helps to ensure that colonies have low varroa levels in spring
- monitoring throughout the season helps to ensure that increases in varroa levels are caught and can be treated early
- continued monitoring into the late season (September and October) and after summer varroa mite treatment has been applied, is important to ensure that the treatment used was effective at lowering the level of infestation for the bees going into winter
Learn more about varroa mites.
Honey production
In 2024, the honey survey was expanded to survey all registered beekeepers with 20 or more colonies, however, in 2025, the honey survey was sent to only commercial beekeepers with 50 or more colonies, as was done in the past. Given the poor response rate in 2025 it may be prudent to continue reaching out to beekeepers with 20 or more colonies for future surveys.
Honey survey questionnaires were conducted using Survey123 Connect and emailed to registered beekeepers with 50 or more colonies. About 12% of the beekeepers responded, representing approximately 4,526 colonies across the province. This is only about 4% of all colonies in Ontario in 2025.
Based on the responses, the preliminary (final figures are available later in 2026) estimated average honey production in Ontario was 30.14 kg (66.46 lb) per colony. This is a notable increase from the final 2024 statistics, which were 24.02 kg (52.96 lb) per colony. The increase is likely due to more typical weather patterns in 2025 as opposed to the cooler weather and variable nectar-producing conditions seen in 2024. Many beekeepers reported strong honey flows in the early summer of 2025.
Pollination services
Ontario honey bee colonies are regularly sent to pollinate berry crops in eastern Canada (Quebec, New Brunswick and Prince Edward Island).
22,792 honey bee colonies were moved from Ontario to eastern Canada in 2025 for the purpose of pollination. This is a decrease from the 25,004 honey bee colonies that left the province in 2024. This decrease may reflect a decrease in colony numbers from some large operations that may have had higher losses in the previous year and fluctuations in pollination demand. The overall demand trend over time is that more colonies are being sought for pollination (especially in New Brunswick) as blueberry crops continue to expand.
Ontario and the eastern Canadian provinces worked together to set inspection requirements for shipping colonies across provincial borders. The spread of SHB from regions in Ontario to eastern Canada remained a concern for inspection requirements in 2025. In 2025, to better monitor the health status of colonies returning from pollination:
- Ontario beekeepers needed to apply for and be issued an Ontario Import Permit as prescribed by the Bees Act
- the Apiary Program conducted general health inspections on a proportion of returning colonies
Honey bee mortality
Overwinter honey bee mortality
In spring 2025, a survey was used to estimate overwinter honey bee colony losses. The survey was sent to 223 registered commercial beekeepers to see how many full sized colonies survived the winter and were considered viable on May 15th. Responses were received from 27% of the commercial beekeepers surveyed representing 20,019 colonies across the province.
Based on the survey results, commercial beekeepers reported an approximate 37% overall honey bee colony loss during the 2024–2025 winter. This was a decrease from the 50% reported in the previous year (2023–2024). Small-scale beekeepers reported a higher winter loss of 43%.
Refer to the full report on 2025 overwinter losses.
In-season honey bee mortality
An in-season honey bee incident is defined as atypical mortality in a honey bee colony during the active beekeeping season that may be suspected to be related to chemical or pesticide exposure. Pests, disease and management practices are factors that also need to be taken into account when there are notable colony health issues or bee deaths observed by the beekeeper.
Beekeepers can report these incidents to OMAFA through the Agriculture Information Contact Centre or by using the online form. If beekeepers suspect the acute mortality of their bees is related to pesticide exposure, they need to report it to the Ministry of Environment, Conservation and Parks’ (MECP) Spills Action Centre at
Learn more about pollution reporting for the public.
In 2025, OMAFA received 4 in-season honey bee mortality incident reports.
Emerging honey bee pest risk: Tropilaelaps mite
A growing concern that has started to gain global attention in the beekeeping world is the Tropilaelaps mite. Tropilaelaps is the most prominent emerging pest threat to honey bees worldwide, including to Ontario beekeepers. While this mite is not currently known to be in North America, there is heightened risk that it will spread throughout the world as it has recently expanded its territory within Asia (where it originates) and as it was confirmed in both Russia and the country of Georgia in Europe. There is concern and unconfirmed reports that Tropilaelaps is also in Ukraine and Turkey.
Like varroa, Tropilaelaps is an ectoparasitic mite of honey bees. It is smaller than varroa, making it harder to detect by beekeepers and it reproduces faster than varroa, making it more damaging in many circumstances. Additionally, Tropilaelaps may introduce and spread novel viruses.
Since this mite is spreading quickly in Europe and since Canada imports bees from Europe (Europe accounts for approximately 10% of Canada's bee imports), this pest poses a serious, growing concern that Europe may be a gateway for Tropilaelaps to enter Canada and North America during a time when the industry is still grappling with varroa mites.
Swarms brought in via shipping containers and freight are likely the biggest threat of this pest arriving in North America. For example, in October 2025, the New Jersey Department of Agriculture and the United States Department of Agriculture detected Tropilaelaps arriving at the Port of Newark, New Jersey in a swarm of bees on board a container ship. While the mitigation measures taken prevented this pest from entering the continental USA, this detection does serve to illustrate the proximity of the present risk.
In response to this emerging pest risk, numerous working groups have been established to discuss Tropilaelaps and to make plans regarding this pest. Ontario’s Provincial Apiarist is a member of the Canadian Association of Professional Apiarists’ Tropilaelaps Committee and works in collaboration with the Apiary Inspectors of America and the Provincial Apiarists of Canada to discuss strategies to prevent the incursion of this pest as well as control and mitigation measures should it arrive and establish itself. The best scenario is that Tropilaelaps does not make it to North America, however, it is prudent to plan for all possible scenarios.
Accessible image descriptions
Figure 1. Annual prevalence of EFB among Ontario honey bee colonies receiving a brood nest inspection from 2016 to 2025.
Figure 1 shows the annual prevalence of European foulbrood in Ontario apiaries was:
- 0.1% in 2016
- 0.03% in 2017
- 0% in 2018
- 0.03% in 2019
- 0.43% in 2020
- 0.59% in 2021
- 0.38% in 2022
- 1.38% in 2023
- 0.16% in 2024
- 0.66% in 2025
Figure 2. Mean varroa mite infestation levels and treatment thresholds in Ontario commercial honey bee operations in 2025.
Figure 2 shows the mean varroa mite infestation of commercial honey bee operations was:
- 0.18% in April
- 0.05% in May
- 0.08% in June
- 0.3% in July
- 0.4% in August
- 0.10% in September
- 3% in October
Figure 3. Mean varroa mite infestation levels and treatment thresholds in Ontario small-scale honey bee operations in 2025.
Figure 3 shows the mean varroa mite infestation of small-scale honey bee operations was:
- 0.05% in April
- 0.07% in May
- 0.09% in June
- 0.07% in July
- 0.4% in August
- 1.7% in September
- 1.3% in October
Figure 4. Varroa mite population curve (without treatment or intervention) in relation to a honey bee population curve over a typical Ontario beekeeping season.
Figure 4 is a line graph showing the relationship between varroa mite (brown line) and honey bee (green line) populations within a single honey bee colony over the beekeeping season. The relationship reflects the growth of varroa mite populations if no varroa mite treatments are applied to the colony. In this situation, the varroa mite population shows exponential growth beginning in the spring (May) and overtaking the honey bee population in the summer months (July). The honey bee population growth line resembles a bell curve, peaking in the summer months and declining into the fall months.