Labour market report, December 2020
Employment in Ontario declined by 11,900 in December. Get the details in this report.
Quick facts
In December 2020:
- There were 12.4 million people in Ontario aged 15 years or older
- 8.1 million (65%) were in the labour force, including those who had worked, were unemployed or did not work at their job, which includes people on temporary layoff because of ongoing COVID-related business closures. The labour force increased in December compared to November (16,900 or 0.2%).
- 7.3 million (58.9%) were employed, down 11,900 jobs (−0.2%) from November.
- Ontario's unemployment rate increased to 9.5% in December from 9.1% in November and 762,500 people were unemployed, up 3.9% (28,800) from November.
Important note:
This report is based on the Labour Force Survey (LFS), a household survey carried out by Statistics Canada. December’s LFS results covers labour market conditions as of the week of December 6 to 12.
Ontario’s mandatory closure of non-essential businesses and other measures aimed at addressing the impact of COVID-19 took effect on March 24.
A provincewide shutdown has been in in effect since December 26, 2020, superseding five levels of public health restrictions that were in effect across the province on a regional basis.
The types of businesses that were deemed essential and remained open during the COVID-19 economic shutdown and the types of businesses that reopened at the different stages of the Ontario government’s plan for reopening the economy should be considered in the context of the information provided in this report.
Employment decreased in December
Employment declined in December (−11,900 or −0.2%) compared with an increase of 36,600 or 0.5% in November, marking the first monthly decline since May.
In December, employment in Ontario was 7,291,900 and was 263,200 or 3.5% lower than its February level.
The total number of hours worked in Ontario in December (at all jobs) was down by 5.5% compared to December 2019 (data are not seasonally adjusted).
Chart 1 shows employment in Ontario from January 2015 to December 2020.
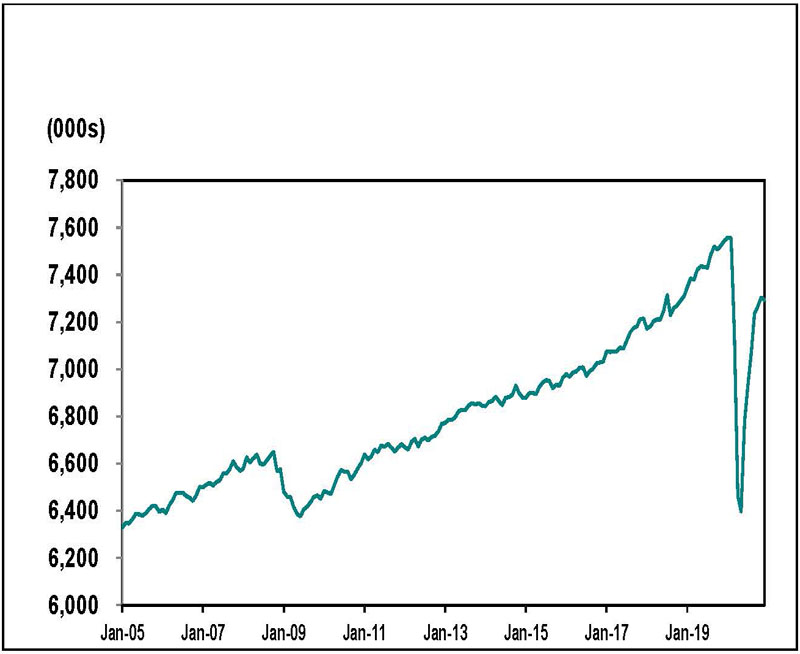
Source: Statistics Canada, Labour Force Survey, Table 14-10-0287-01, (seasonally adjusted data).
Full-time vs. part-time
Part-time jobs (−19,600 or −1.5%) accounted for all the decline in December. Full-time jobs increased (7,700 or 0.1%).
Employment change by sex and age
Employment among women fell by 14,100 (−0.4%) between November and December, above the pace of employment decline overall (−0.2%). Employment among men increased (0.1% or 2,300). Women’s employment level remains 4.2% (150,000) lower than in February, while December’s employment level for men was 2.9% (113,200) lower compared to February.
Youth employment (those aged 15 to 24) increased by 15,400 (1.7%) in December, following an increase of 12,100 (1.3%) in November. Youth employment remains further from pre-COVID February levels than other major age groups (−80,700 or −8.0%).
Employment for people aged 25 to 54 declined by 35,300 (−0.7%) in December after being unchanged in November (1,700 or 0.0%). Employment for those aged 55 and older increased by 8,000 (0.5%) jobs in December, following an increase of 22,800 (1.4%) in November.
Employment in Canada declined by 62,600 (−0.3%) in December and now totals 18,553,000. In December, Canada’s employment was 636,400 (−3.3%) below its February 2020 level.
Employment change by industry
The government’s restrictions on the types of businesses that were deemed essential and other measures aimed at addressing the impact of COVID-19 should be considered in the context of employment change by sector.
Over half (57.0%) of the job losses over the February to May major downturn period were concentrated in four sectors — wholesale and retail trade, accommodation and food services, manufacturing and health care and social assistance. These sectors account for 58.5% of the net jobs gained since May.
Employment was furthest from pre-COVID February levels in accommodation and food services (−23.9%), business, building and other support services (−18.0%), transportation and warehousing (−13.2%), other services (−8.1%) and utilities (−5.9%).
Employment was above pre-COVID February levels in forestry, fishing, mining, quarrying, oil and gas (7.1%), finance, insurance, real estate, rental and leasing (4.2%), manufacturing (3.9%), professional, scientific and technical services (3.1%), and public utilities (0.5%).
Chart 2 shows industries by employment change in Ontario, February 2020 to December 2020.
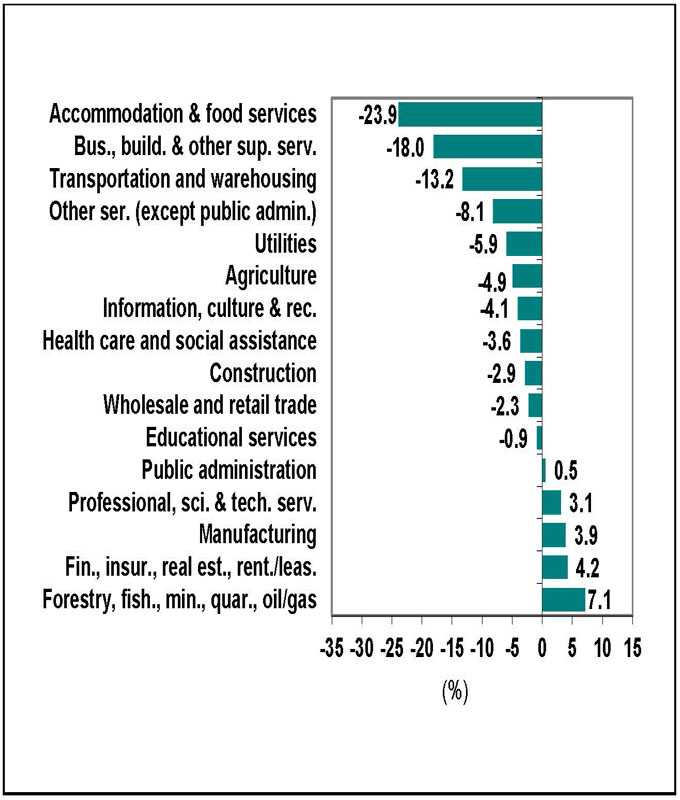
Source: Statistics Canada, Labour Force Survey, Table 14-10-0355-02, (seasonally adjusted data).
Employment in 2020
On an annual basis, employment in Ontario fell by 371,200 (−5.0%) in 2020 compared to an increase of 210,200 (2.9%) net new jobs in 2019. The employment decline in 2020 was the largest decline on record.
Full-time jobs fell by 217,000 (−3.6%) and part-time jobs fell by 154,200 (−11.1%) in 2020.
Nationally, employment in Canada declined by 996,200 (−5.2%) in 2020, the largest annual decline on record. This compared with employment growth of 398,200 (2.1%) in 2019.
Unemployment rate increased to 9.5%
Chart 3 shows unemployment rates, Ontario and Canada, January 2005 to December 2020.
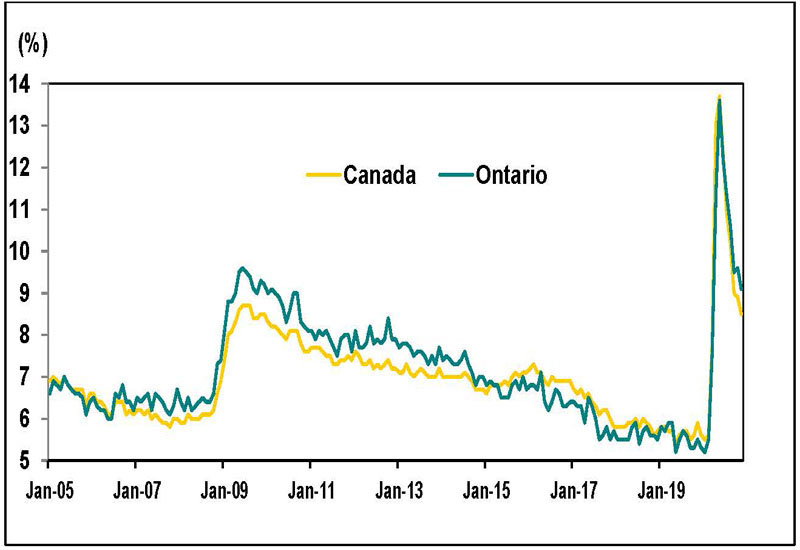
Source: Statistics Canada, Labour Force Survey, Table 14-10-0287-01, (seasonally adjusted data).
Ontario’s unemployment rate in December was 9.5%, up from 9.1% in November. The unemployment rate in February 2020 was 5.5%.
Canada’s unemployment rate increased to 8.6% in December from 8.5% in November. Canada’s unemployment rate in February 2020 was 5.6%.
Unemployment rate by sex and age
The unemployment rate for women was 10.0% in December, up from 9.8% in November, while the rate for men climbs to 9.0% from 8.5% during the period. Women remain further behind their pre-COVID employment level than men.
In Ontario, the unemployment rate among population groups designated as visible minorities was estimated at 10.0% in December in comparison to a 7.7% rate for non-visible minorities and those that did not identify as Indigenous (data are for the population aged 15 to 69 and are not adjusted for seasonality).
For individuals aged 15 to 24, the unemployment rate increased to 20.9% in December from 20.2% in November and remains the highest among all age groups. The youth unemployment rate reached a record high of 30.0% in May and June.
The unemployment rate for individuals aged 25 to 54 was unchanged at 7.6% in December compared to November. It increased to 7.2% from 6.5% for those aged 55 and older during this period.
Unemployment rate in 2020
On an annual basis, Ontario’s unemployment rate was 9.6% in 2020, up from 5.6% in 2019 and matching the highest unemployment rate recorded since 1994.
Canada’s unemployment rate was 9.5% in 2020, up from 5.7% in 2019 and matching the highest unemployment rate since 1996.
Long-term unemployment
In December, an average of 239,100 Ontarians or 31.4% of all unemployed people were unemployed for 27 weeks or longer (long-term unemployed). This was up from 184,600 in November and 3.4 times the pre-COVID February 2020 level of 70,700.
The average time in unemployment increased to 19.8 weeks in December 2020 from 15.8 weeks in February.
Chart 4 shows the number of people unemployed for 27 weeks or more in Ontario, from January 2005 to December 2020.
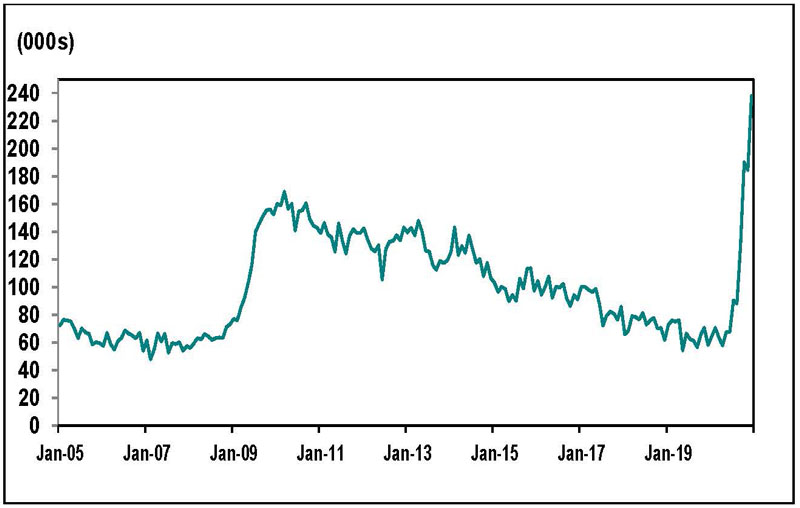
Source: Statistics Canada, Labour Force Survey, Table 14-10-0342-01, (seasonally adjusted data).
Employment and unemployment in urban centres
Employment change in urban centres
Chart 5 shows the rate of employment change for Ontario Census Metropolitan Areas (CMAs) from November 2020 to December 2020.
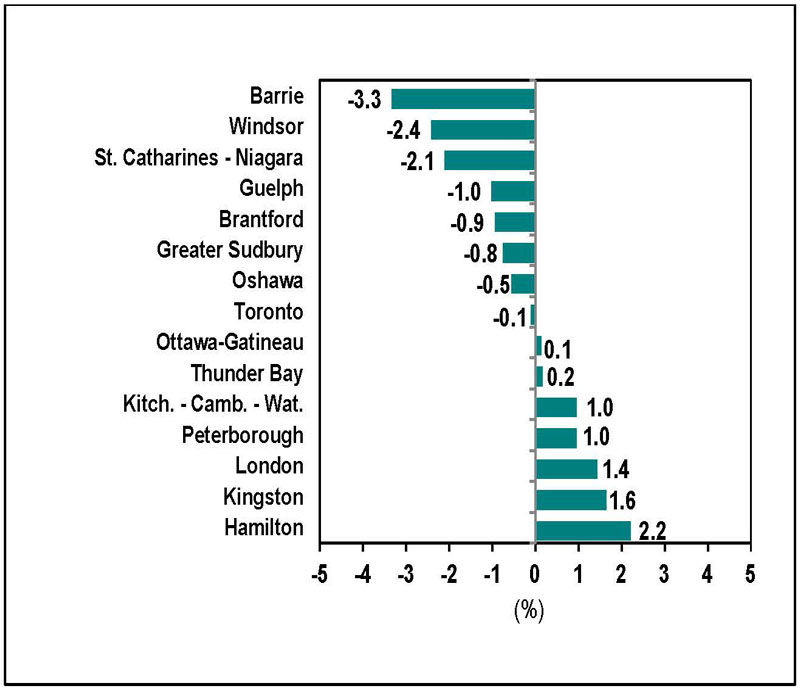
Source: Statistics Canada, Labour Force Survey, Table 14-10-0294-01, (seasonally adjusted data three-month moving average to reduce volatility caused by small sample size).
Employment levels fell in eight of the fifteen Ontario CMAs between November and December. Barrie (−3.3% or −3,900) recorded the highest percentage employment decline, followed by Windsor (−2.4% or −3,700) and St. Catharine-Niagara (−2.1% or −4,100).
Hamilton (2.2% or 8,700) recorded the largest percentage increase in employment, notably followed by Kingston (1.6% or 1,400) and London (1.4% or 3,700).
Employment in all but three of Ontario’s urban centres remained below February 2020 levels in December, led by Barrie (−12.0% or −15,500), Windsor (−10.5% or −17,600), Kitchener-Cambridge-Waterloo (−7.8% or −24,000), Greater Sudbury (−7.3% or −6,200) and Peterborough (−7.3% or −4,100).
In December, employment was notably above February 2020 levels in Oshawa (1.1% or 2,300).
Lowest and highest unemployment rates in urban centres
Chart 6 shows Census Metropolitan Areas (CMAs) with highest and lowest unemployment rates in Canada, December 2020.
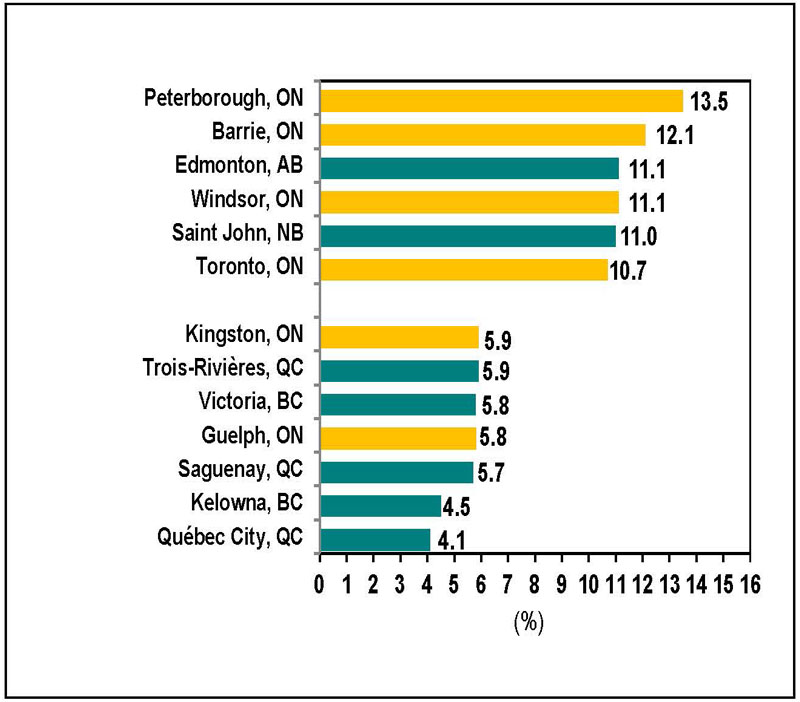
Source: Statistics Canada, Labour Force Survey, Table 14-10-0294-01, (seasonally adjusted data three-month moving average to reduce volatility caused by small sample size).
Ontario Census Metropolitan Areas (CMAs) recorded some of the highest unemployment rates in Canada in December. Peterborough recorded the highest unemployment rate in Canada in December (13.5%), followed by Barrie (12.1%), while Windsor and Edmonton were tied for the third-highest rate (11.1%).
Guelph recorded the lowest unemployment rate in Ontario in December (5.8%), while the City of Quebec had the lowest unemployment rate in Canada (4.1%).
Download data
Source: Statistics Canada, Labour Force Survey
December 2020 Labour Market Report:
- CSV, Chart 1, employment in Ontario from January 2015 to December 2020, 1 Kb
- CSV, Chart 2, industries with highest and lowest employment change in Ontario, February 2020 to December 2020, 2 Kb
- CSV, Chart 3, unemployment rates, Ontario and Canada, January 2015 to December 2020, 2 Kb
- CSV, Chart 4, number of people unemployed for 27 week or more in Ontario, January 2005 to December 2020, 2 Kb
- CSV, Chart 5, the rate of employment change for Ontario Census Metropolitan Areas (CMAs) from November 2020 to December 2020, 12 Kb
- CSV, Chart 6, Census Metropolitan Areas (CMAs) highest and lowest unemployment rates, December 2020, 2 Kb